| Param | Original file | Final file |
|---|---|---|
| Filename | modeM0/AS1G06_103T01_9000000812_06215cztM0_level2.evt | modeM0/AS1G06_103T01_9000000812_06215cztM0_level2_quad_clean.evt |
| Size (bytes) | 474,883,200 | 84,216,960 |
| Size | 452.9 MB | 80.3 MB |
| Events in quadrant A | 3,519,242 | 512,686 |
| Events in quadrant B | 3,542,448 | 518,971 |
| Events in quadrant C | 3,376,815 | 512,020 |
| Events in quadrant D | 3,439,823 | 491,455 |
| Mode SS | |||
|---|---|---|---|
| Quadrant | BADHDUFLAG | Total packets | Discarded packets |
| A | 0 | 159 | 7 |
| B | 0 | 160 | 6 |
| C | 0 | 160 | 6 |
| D | 0 | 160 | 14 |
| Mode M9 | |||
|---|---|---|---|
| Quadrant | BADHDUFLAG | Total packets | Discarded packets |
| A | 0 | 6 | 0 |
| B | 0 | 6 | 0 |
| C | 0 | 6 | 0 |
| D | 0 | 6 | 0 |
| Mode M0 | |||
|---|---|---|---|
| Quadrant | BADHDUFLAG | Total packets | Discarded packets |
| A | 0 | 16446 | 907 |
| B | 0 | 16465 | 930 |
| C | 0 | 16176 | 938 |
| D | 0 | 16530 | 871 |
| Quadrant | Total seconds | Saturated seconds | Saturation percentage |
|---|---|---|---|
| A | 7405 | 97 | 1.309926% |
| B | 7392 | 134 | 1.812771% |
| C | 7379 | 60 | 0.813118% |
| D | 7416 | 67 | 0.903452% |
Noise dominated data is calculated using 1-second bins in cleaned event files. If a bin has >2000 counts, and if more than 50% of those come from <1% of pixels, then it is considered to be noise-dominated and hence unusable.
| Quadrant | # 1 sec bins | Bins with >0 counts | Bins with >2000 counts | High rate bins dominated by noise | Noise dominated (total time) | Noise dominated (detector-on time) | Marked lightcurve |
|---|---|---|---|---|---|---|---|
| A | 8413 | 7647 | 0 | 0 | 0.00% | 0.00% | 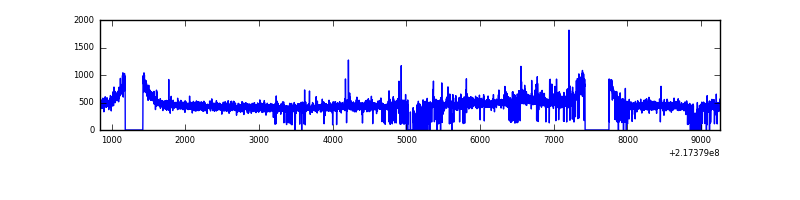 |
| B | 8413 | 7604 | 1 | 1 | 0.01% | 0.01% | 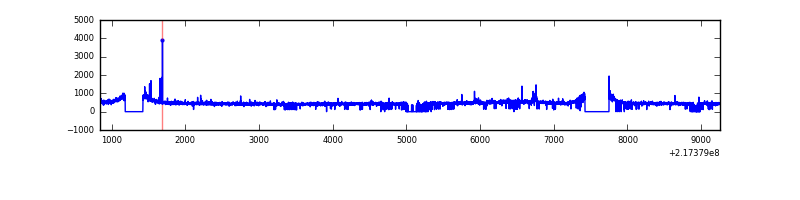 |
| C | 8413 | 7621 | 0 | 0 | 0.00% | 0.00% | 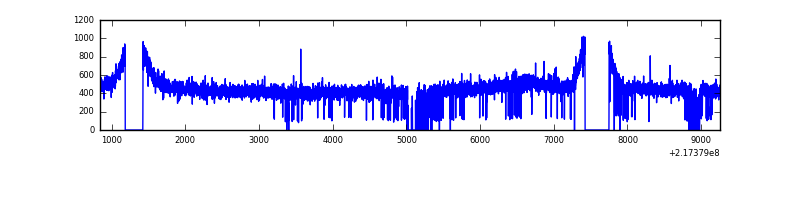 |
| D | 8413 | 7637 | 14 | 14 | 0.17% | 0.18% | 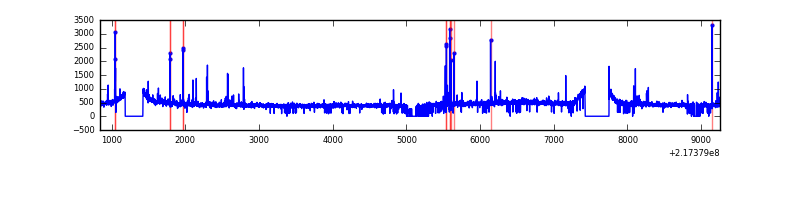 |
Top three noisy pixels from each quadrant. If the there are fewer than three noisy pixels in the level2.evt file, extra rows are filled as -1
| Pixel properties | Quadrant properties | ||||||
|---|---|---|---|---|---|---|---|
| Quadrant | DetID | PixID | Counts | Sigma | Mean | Median | Sigma |
| A | 8 | 15 | 65676 | 361.94 | 873 | 853 | 179.1 |
| A | 15 | 236 | 62664 | 345.13 | 873 | 853 | 179.1 |
| A | 4 | 2 | 9811 | 50.02 | 873 | 853 | 179.1 |
| B | 4 | 81 | 34202 | 193.27 | 885 | 861 | 172.5 |
| B | 0 | 219 | 29104 | 163.72 | 885 | 861 | 172.5 |
| B | 15 | 204 | 25121 | 140.63 | 885 | 861 | 172.5 |
| C | 1 | 16 | 25204 | 120.59 | 859 | 864 | 201.8 |
| C | 13 | 61 | 6877 | 29.79 | 859 | 864 | 201.8 |
| C | 3 | 202 | 2140 | 6.32 | 859 | 864 | 201.8 |
| D | 5 | 97 | 51439 | 237.42 | 861 | 833 | 213.2 |
| D | 2 | 136 | 43774 | 201.46 | 861 | 833 | 213.2 |
| D | 2 | 14 | 39587 | 181.81 | 861 | 833 | 213.2 |
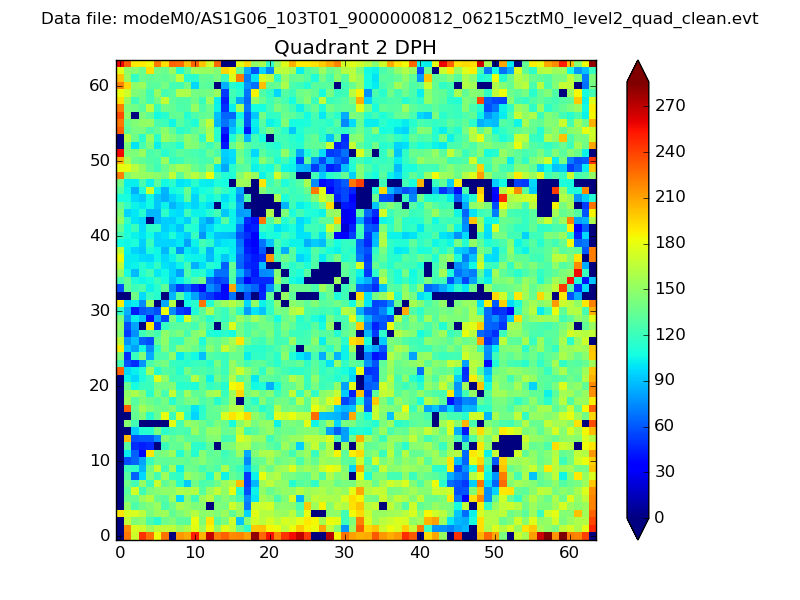
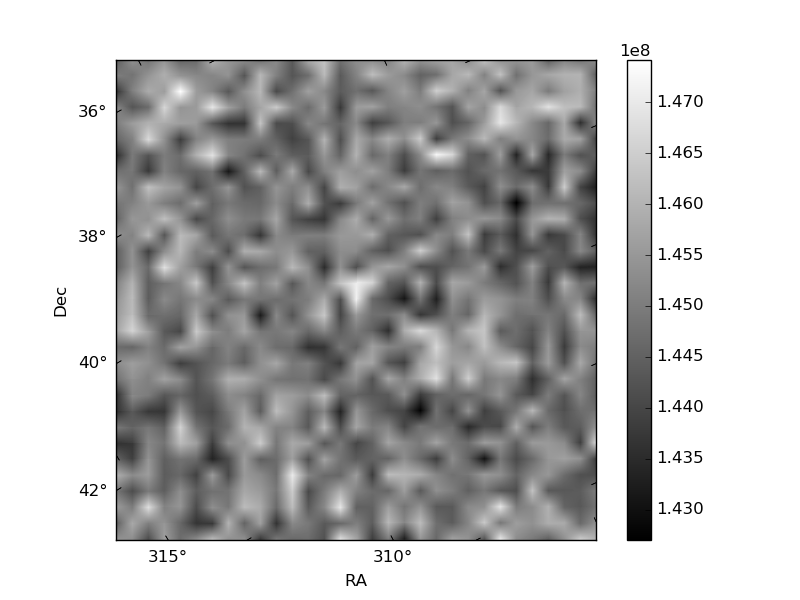
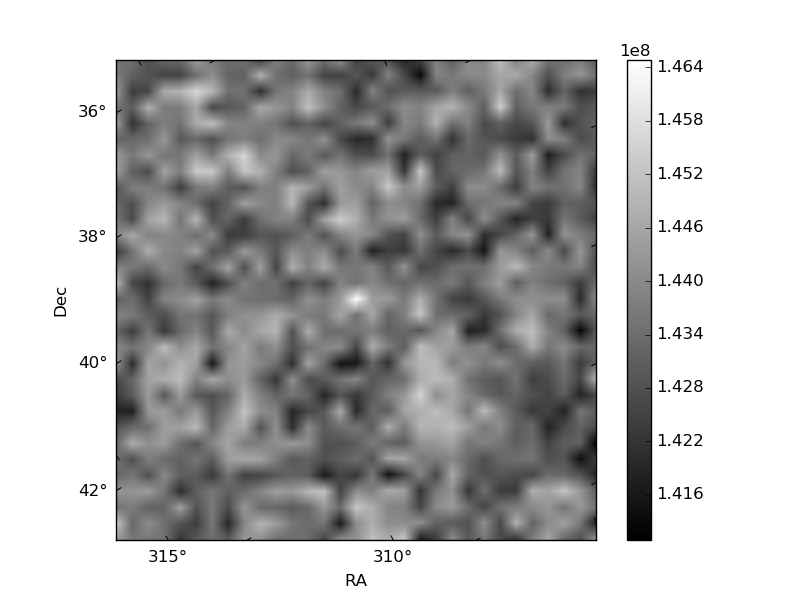
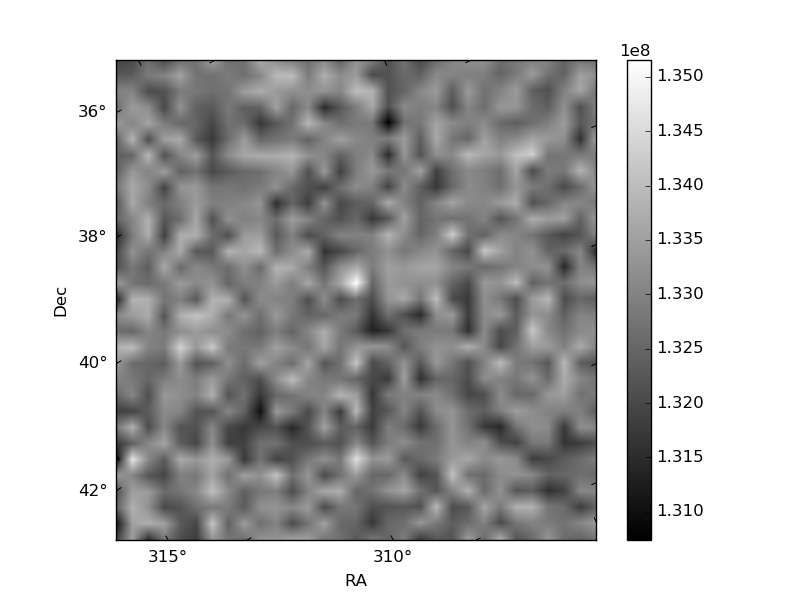
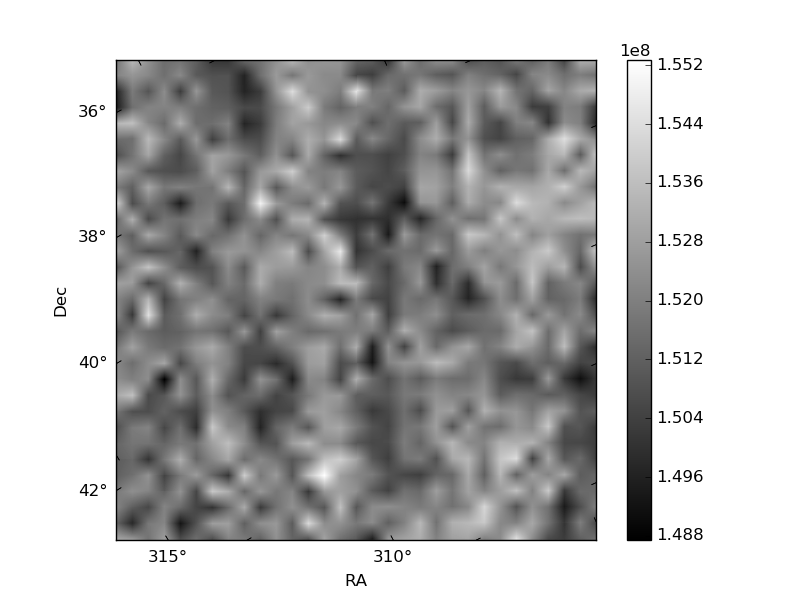
Histogram calculated using DETX and DETY for each event in the final _common_clean file
| Quadrant A | 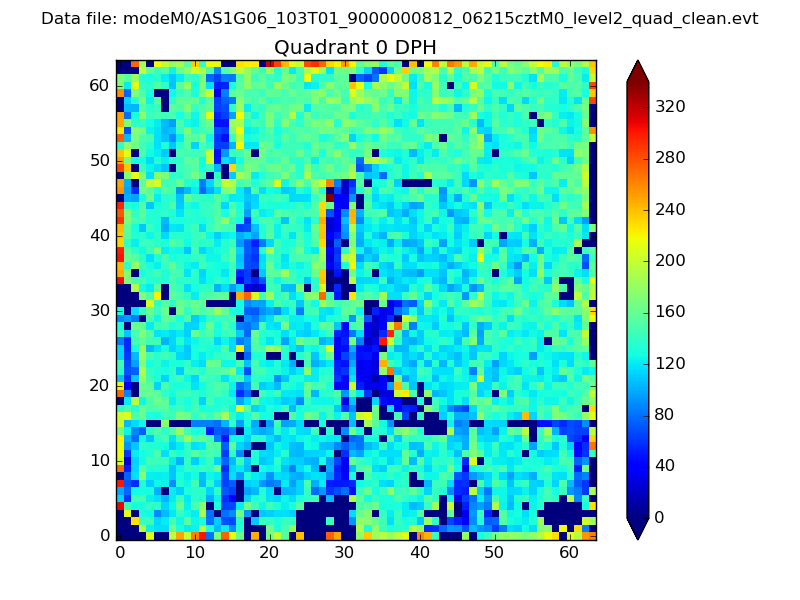 |
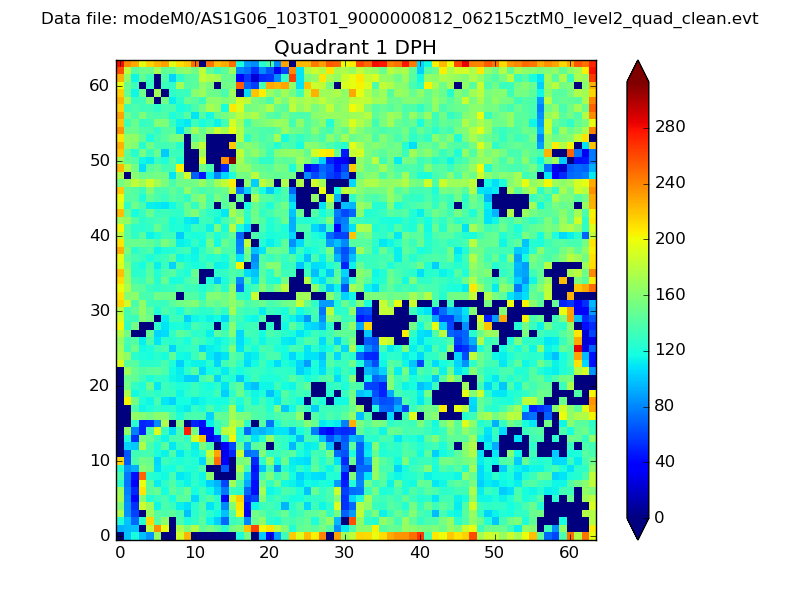 |
Quadrant B |
|---|---|---|---|
| Quadrant D | 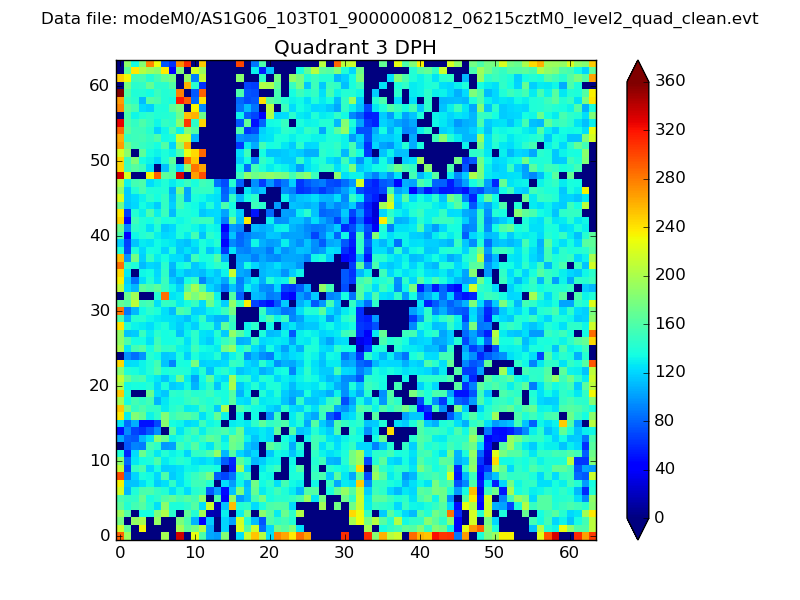 |
 |
Quadrant C |
| Plot type | Count rate plots | Images |
|---|---|---|
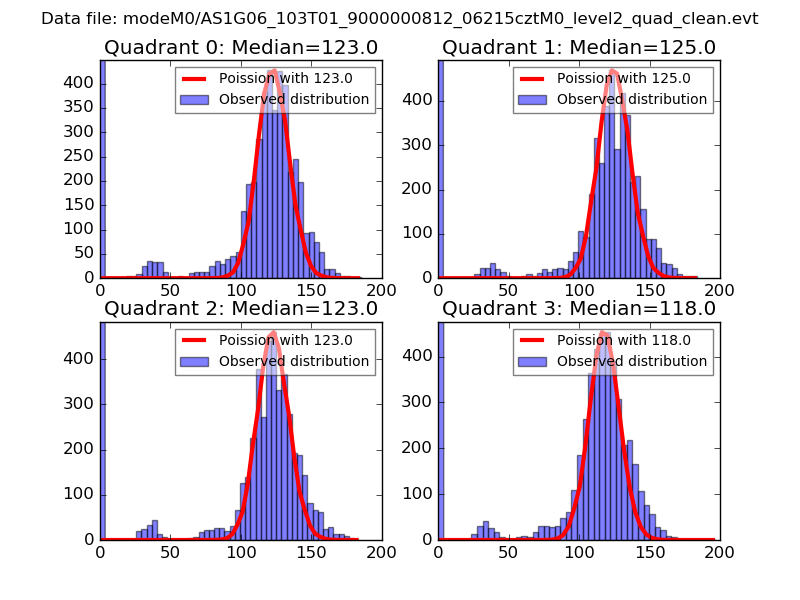
| Comparison with Poisson distribution Blue bars denote a histogram of data divided into 1 sec bins. Red curve is a Poisson curve with rate = median count rate of data. |
 |
 |
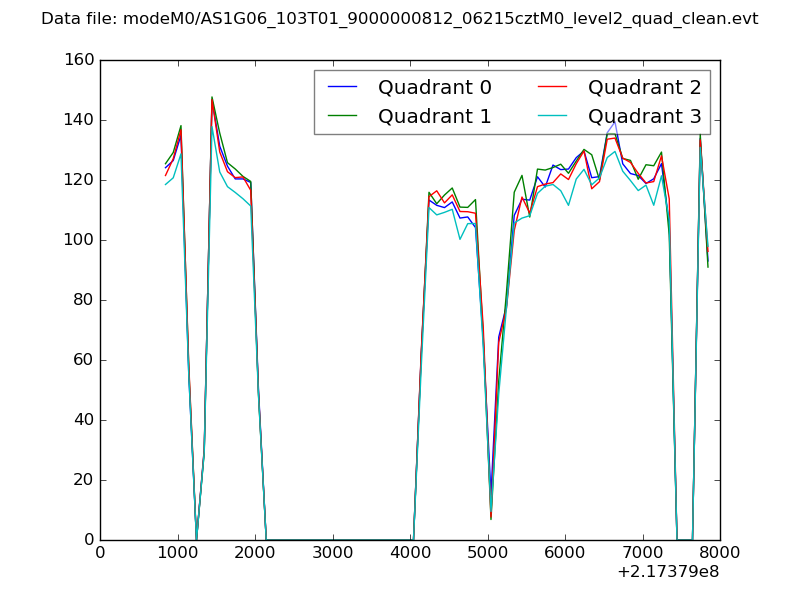
| Quadrant-wise count rates Data is divided into 100 sec bins |
 |
|
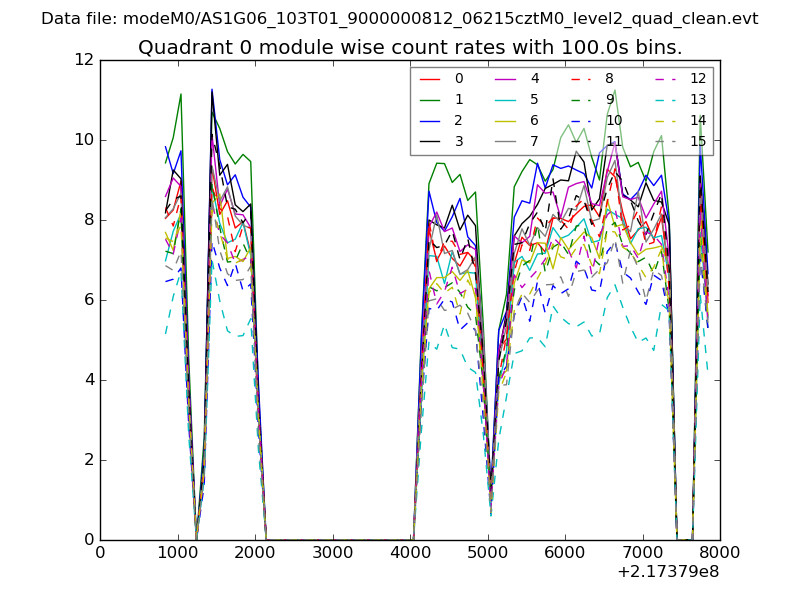
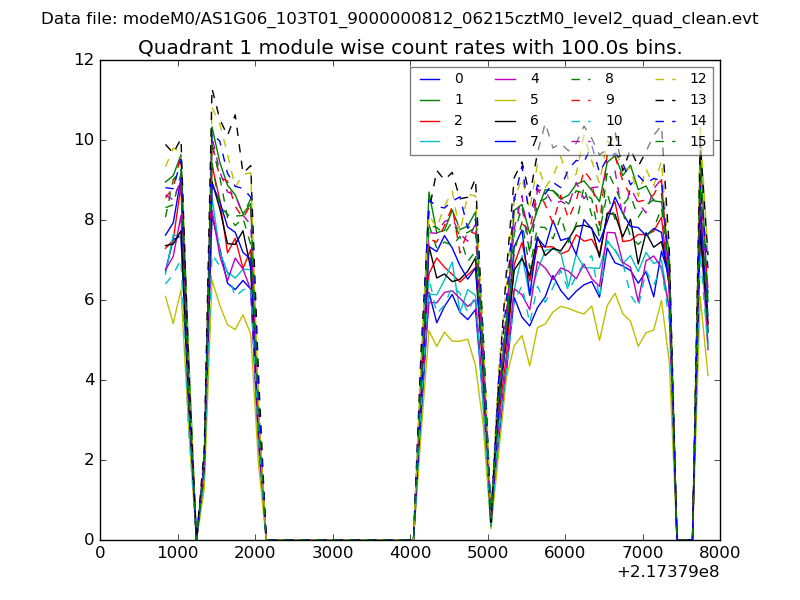
| Module-wise count rates for Quadrant A Data is divided into 100 sec bins |
 |
 |
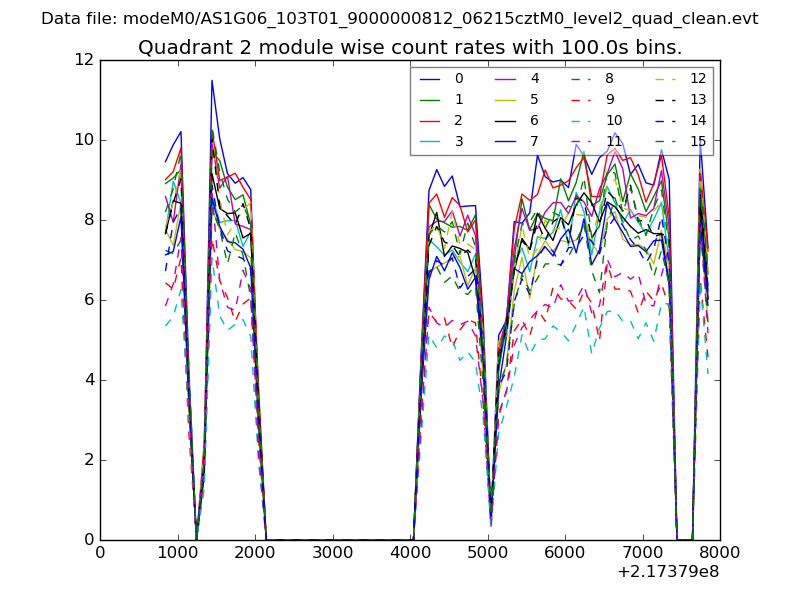
| Module-wise count rates for Quadrant B Data is divided into 100 sec bins |
 |
 |
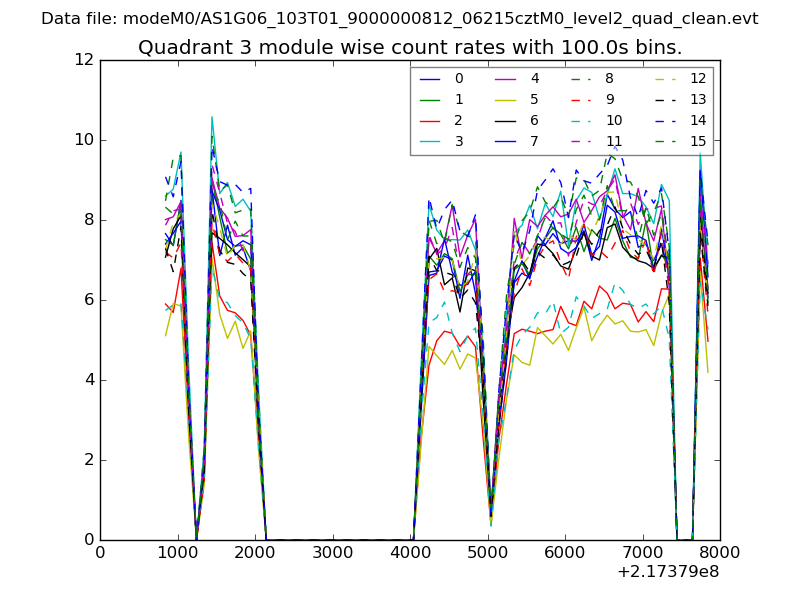
| Module-wise count rates for Quadrant C Data is divided into 100 sec bins |
 |
 |
| Module-wise count rates for Quadrant D Data is divided into 100 sec bins |
 |
 |
| Parameter | Plot |
|---|---|
| CZT HV Monitor | 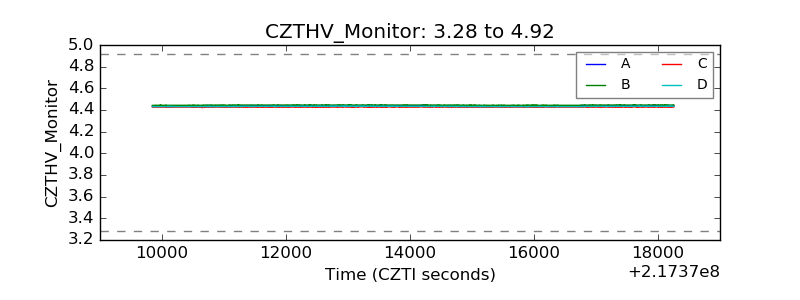 |
| D_VDD | 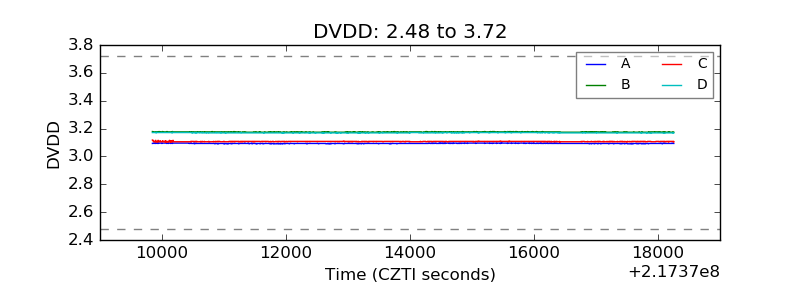 |
| Temperature 1 | 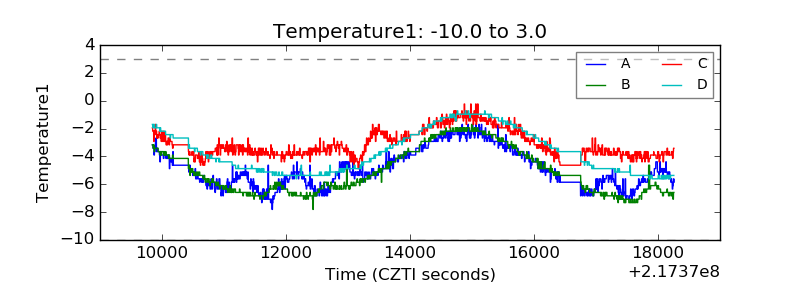 |
| Veto HV Monitor | 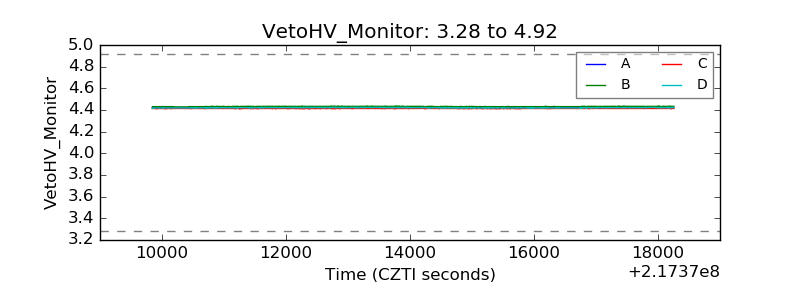 |
| Veto LLD | 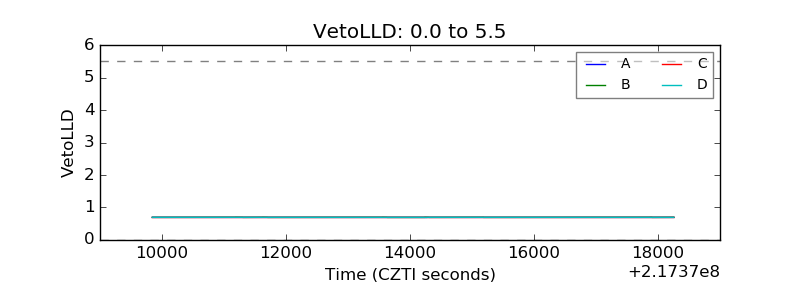 |
| Alpha Counter | 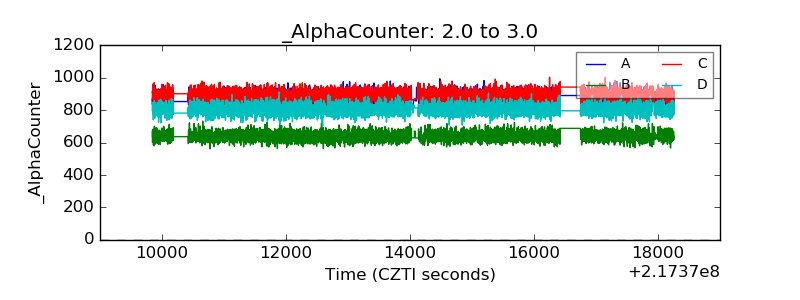 |
| _CPM_Rate | 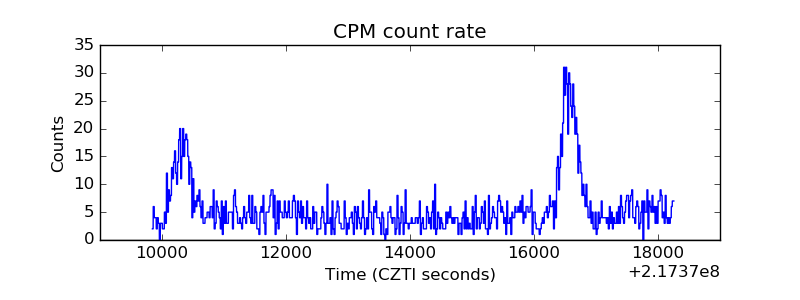 |
| CZT Counter | 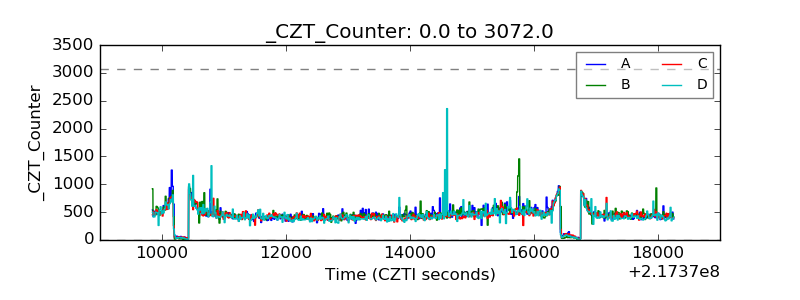 |
| +2.5 Volts monitor | 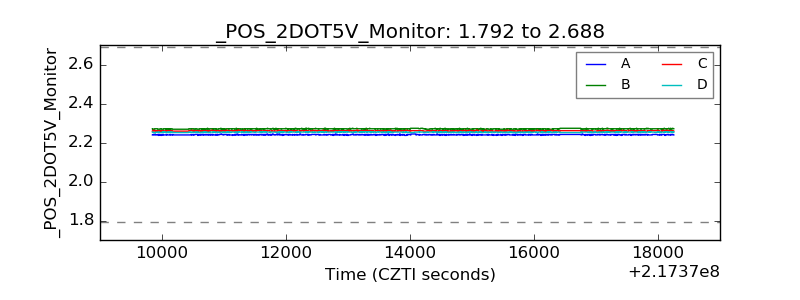 |
| +5 Volts monitor | 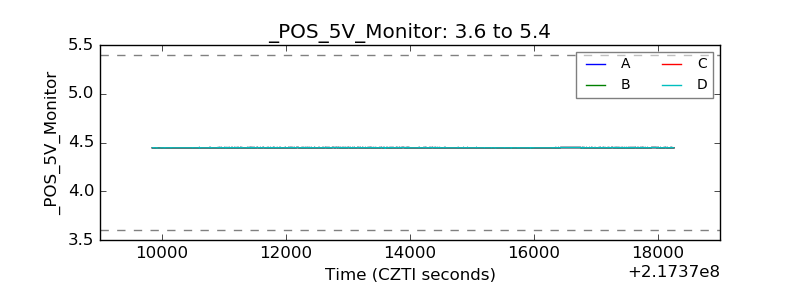 |
| _ROLL_ROT | 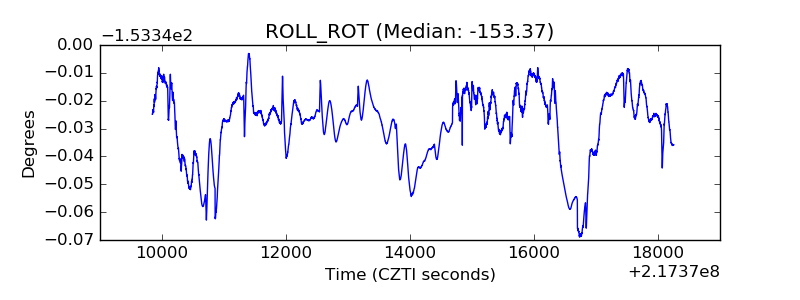 |
| _Roll_DEC | 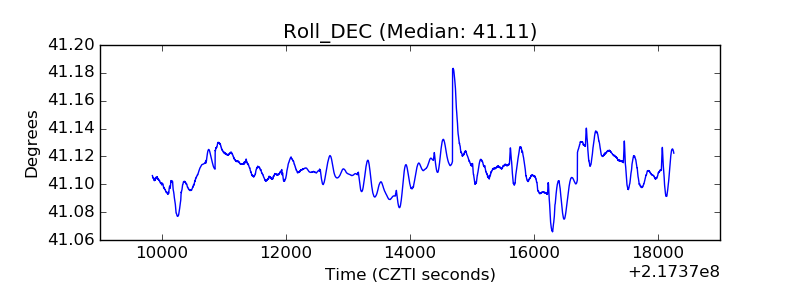 |
| _Roll_RA | 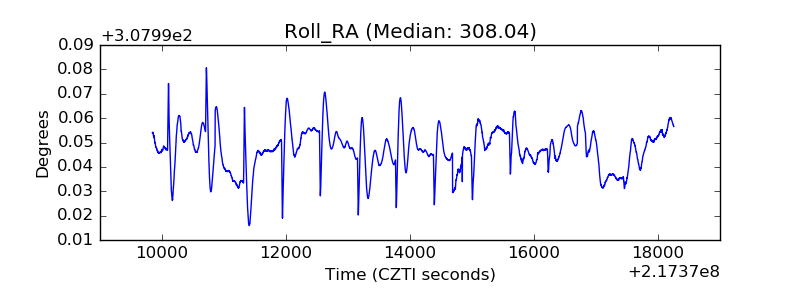 |
| Veto Counter | 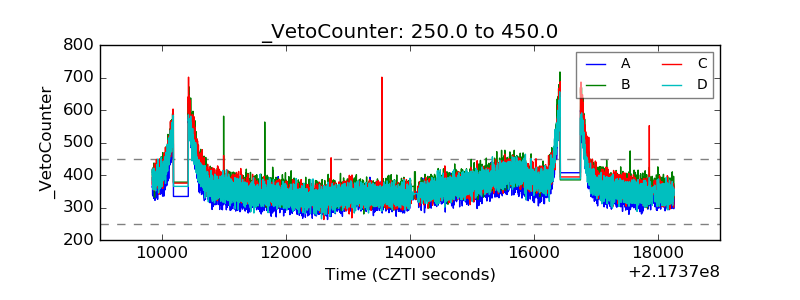 |