| Param | Original file | Final file |
|---|---|---|
| Filename | modeM0/AS1G06_103T01_9000000812_06217cztM0_level2.evt | modeM0/AS1G06_103T01_9000000812_06217cztM0_level2_quad_clean.evt |
| Size (bytes) | 847,448,640 | 148,717,440 |
| Size | 808.2 MB | 141.8 MB |
| Events in quadrant A | 7,265,001 | 896,752 |
| Events in quadrant B | 6,031,755 | 927,048 |
| Events in quadrant C | 5,792,734 | 914,684 |
| Events in quadrant D | 5,703,061 | 875,619 |
| Mode SS | |||
|---|---|---|---|
| Quadrant | BADHDUFLAG | Total packets | Discarded packets |
| A | 0 | 270 | 12 |
| B | 0 | 270 | 4 |
| C | 0 | 270 | 2 |
| D | 0 | 270 | 0 |
| Mode M9 | |||
|---|---|---|---|
| Quadrant | BADHDUFLAG | Total packets | Discarded packets |
| A | 0 | 14 | 0 |
| B | 0 | 14 | 0 |
| C | 0 | 14 | 0 |
| D | 0 | 14 | 0 |
| Mode M0 | |||
|---|---|---|---|
| Quadrant | BADHDUFLAG | Total packets | Discarded packets |
| A | 0 | 30828 | 520 |
| B | 0 | 26924 | 406 |
| C | 0 | 26567 | 284 |
| D | 0 | 26904 | 375 |
| Quadrant | Total seconds | Saturated seconds | Saturation percentage |
|---|---|---|---|
| A | 12831 | 178 | 1.387265% |
| B | 12863 | 182 | 1.414911% |
| C | 12899 | 122 | 0.945810% |
| D | 12859 | 120 | 0.933199% |
Noise dominated data is calculated using 1-second bins in cleaned event files. If a bin has >2000 counts, and if more than 50% of those come from <1% of pixels, then it is considered to be noise-dominated and hence unusable.
| Quadrant | # 1 sec bins | Bins with >0 counts | Bins with >2000 counts | High rate bins dominated by noise | Noise dominated (total time) | Noise dominated (detector-on time) | Marked lightcurve |
|---|---|---|---|---|---|---|---|
| A | 14567 | 13020 | 5 | 5 | 0.03% | 0.04% | 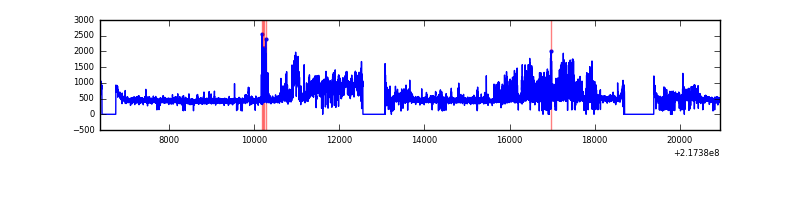 |
| B | 14567 | 13021 | 10 | 10 | 0.07% | 0.08% | 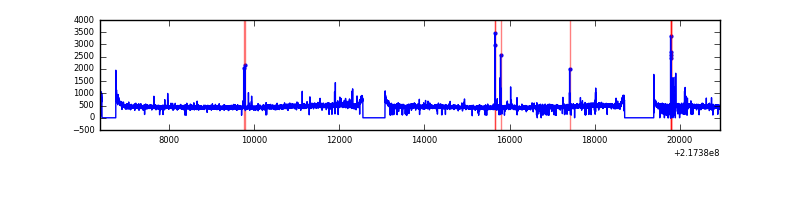 |
| C | 14567 | 13033 | 0 | 0 | 0.00% | 0.00% | 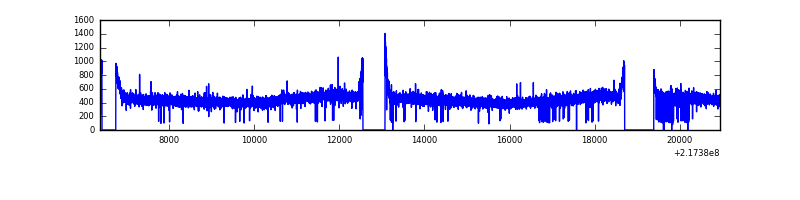 |
| D | 14567 | 13027 | 12 | 12 | 0.08% | 0.09% | 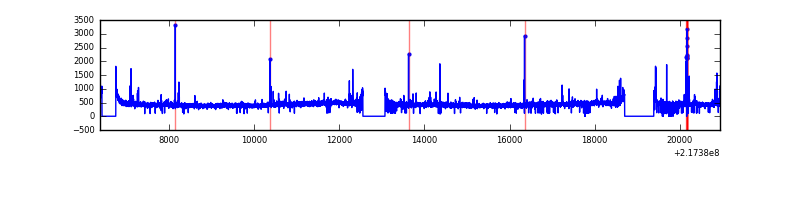 |
Top three noisy pixels from each quadrant. If the there are fewer than three noisy pixels in the level2.evt file, extra rows are filled as -1
| Pixel properties | Quadrant properties | ||||||
|---|---|---|---|---|---|---|---|
| Quadrant | DetID | PixID | Counts | Sigma | Mean | Median | Sigma |
| A | 15 | 236 | 740126 | 2420.49 | 1486 | 1451 | 305.2 |
| A | 13 | 34 | 642777 | 2101.5 | 1486 | 1451 | 305.2 |
| A | 8 | 15 | 128587 | 416.6 | 1486 | 1451 | 305.2 |
| B | 0 | 219 | 92079 | 314.42 | 1511 | 1475 | 288.2 |
| B | 15 | 204 | 42863 | 143.63 | 1511 | 1475 | 288.2 |
| B | 4 | 81 | 41408 | 138.58 | 1511 | 1475 | 288.2 |
| C | 1 | 16 | 68291 | 195.93 | 1467 | 1474 | 341.0 |
| C | 13 | 61 | 11757 | 30.15 | 1467 | 1474 | 341.0 |
| C | 8 | 222 | 4242 | 8.12 | 1467 | 1474 | 341.0 |
| D | 2 | 136 | 89765 | 246.15 | 1458 | 1411 | 358.9 |
| D | 5 | 97 | 42050 | 113.22 | 1458 | 1411 | 358.9 |
| D | 2 | 206 | 36240 | 97.03 | 1458 | 1411 | 358.9 |
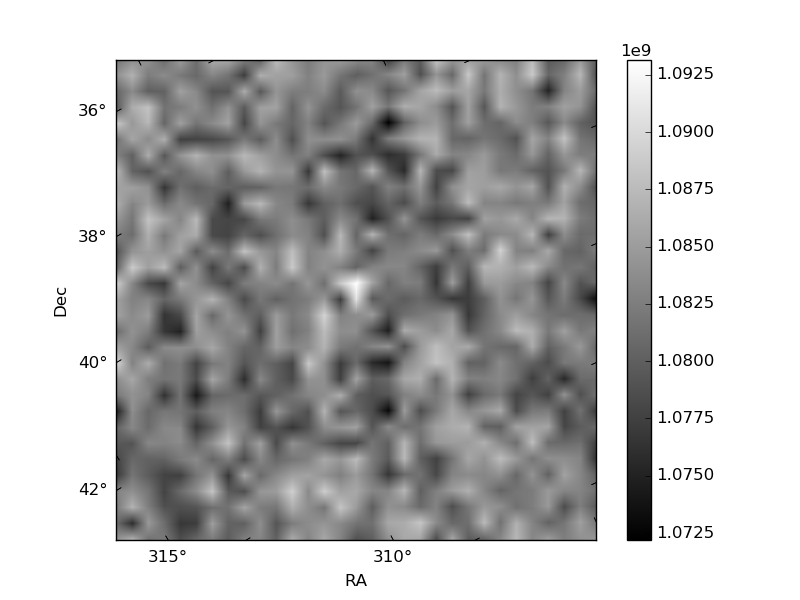
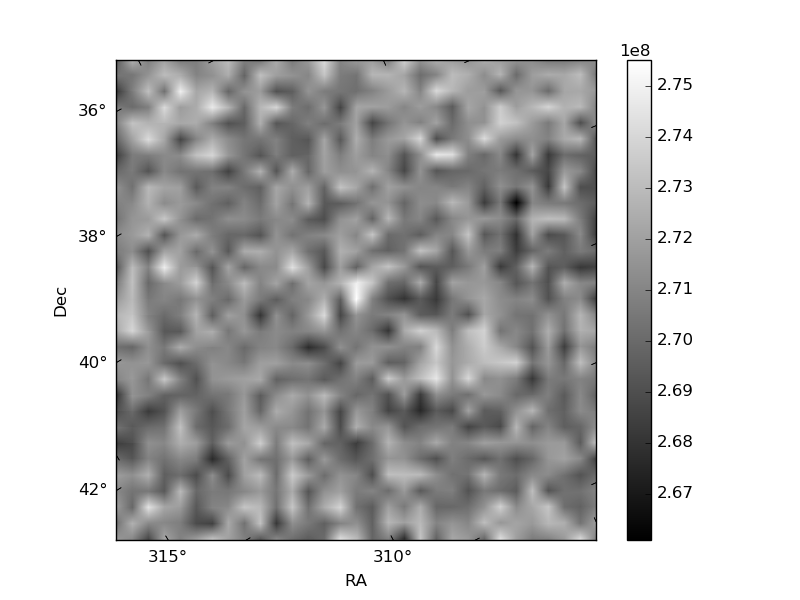
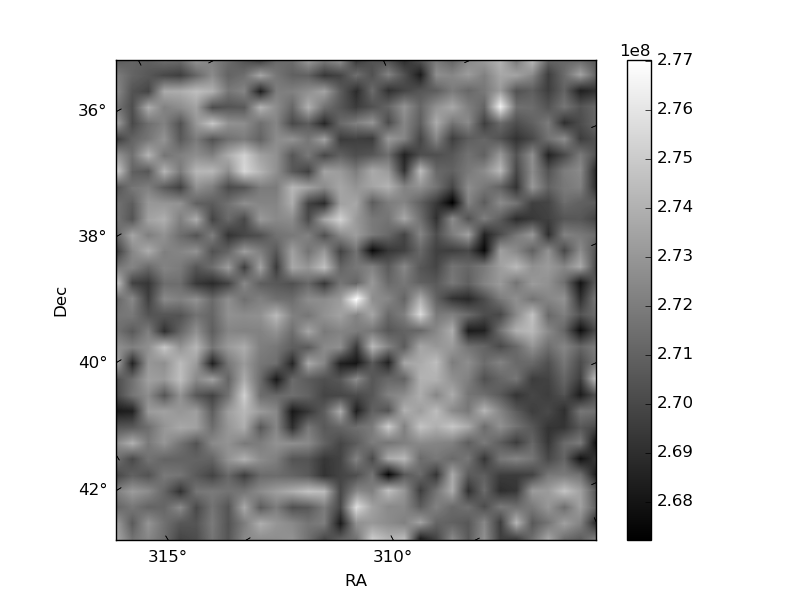
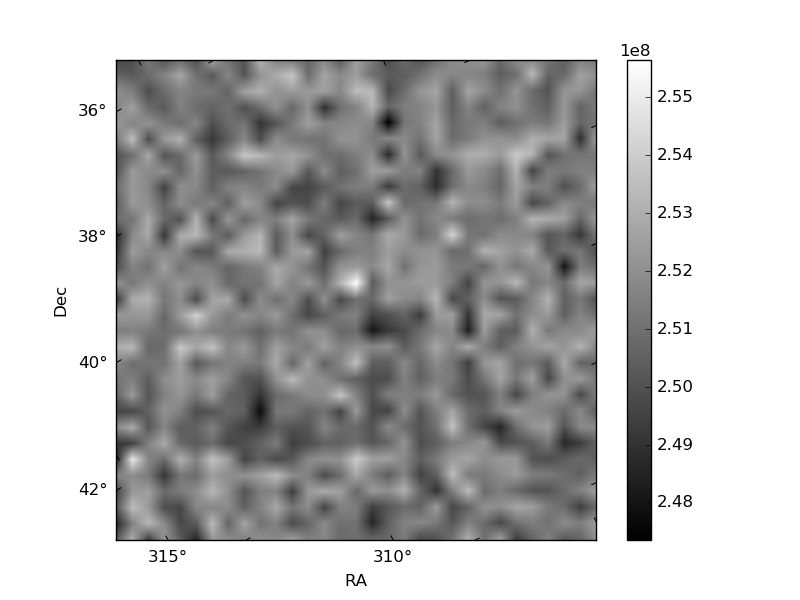
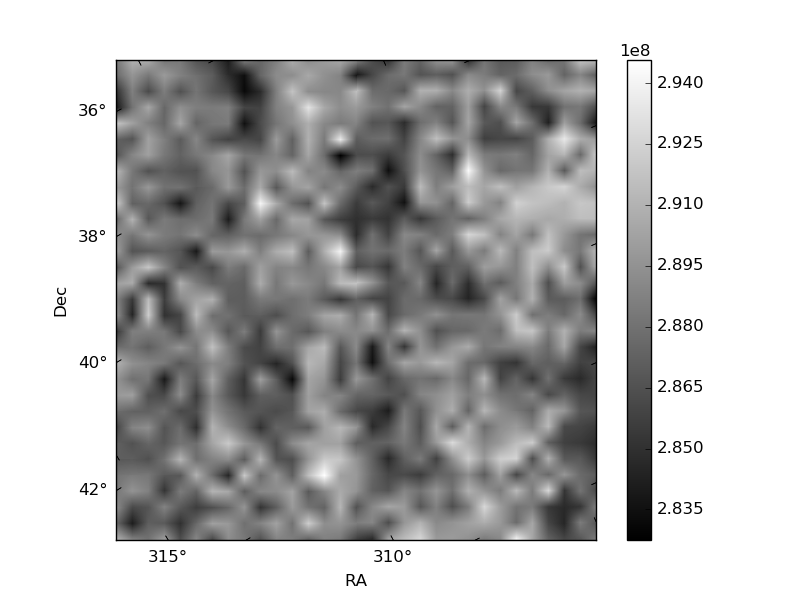
Histogram calculated using DETX and DETY for each event in the final _common_clean file
| Quadrant A | 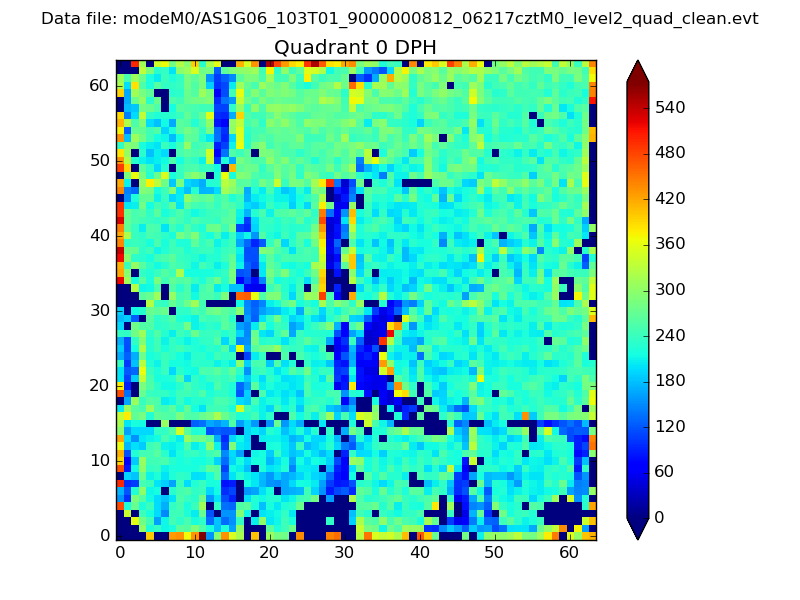 |
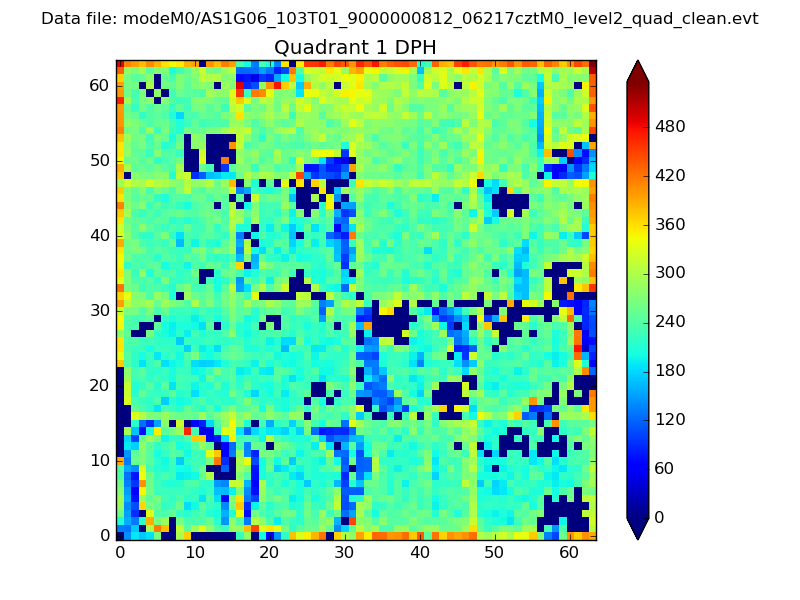 |
Quadrant B |
|---|---|---|---|
| Quadrant D | 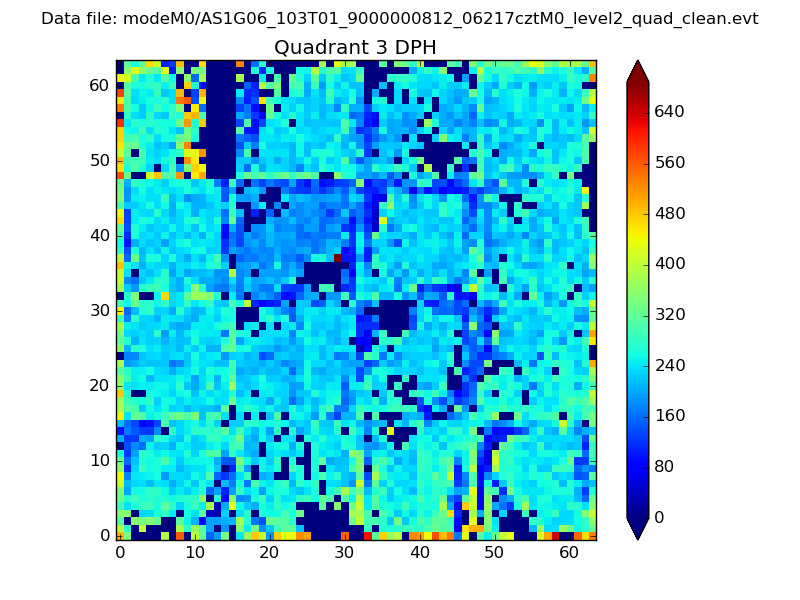 |
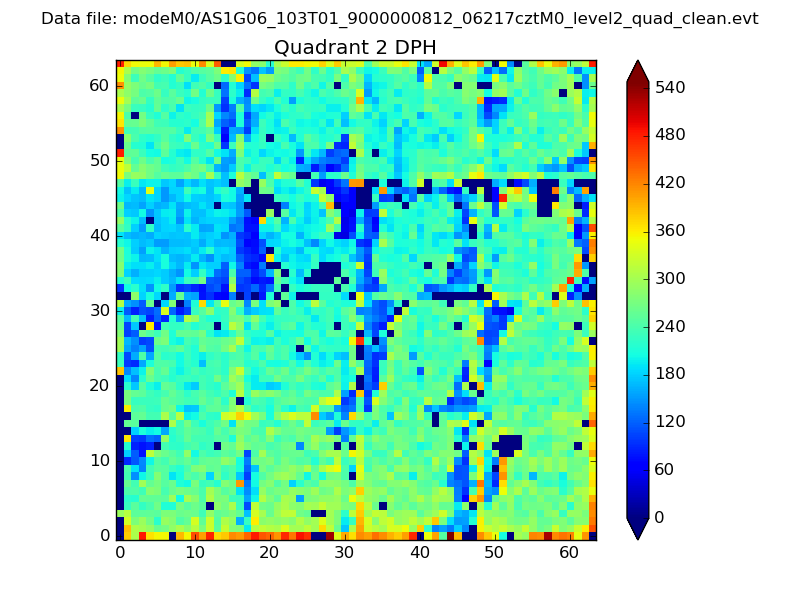 |
Quadrant C |
| Plot type | Count rate plots | Images |
|---|---|---|
| Comparison with Poisson distribution Blue bars denote a histogram of data divided into 1 sec bins. Red curve is a Poisson curve with rate = median count rate of data. |
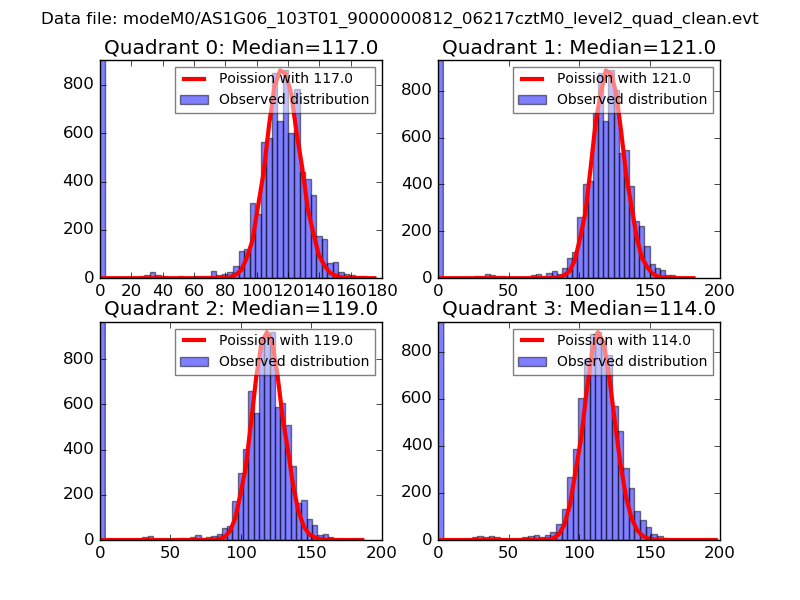 |
 |
| Quadrant-wise count rates Data is divided into 100 sec bins |
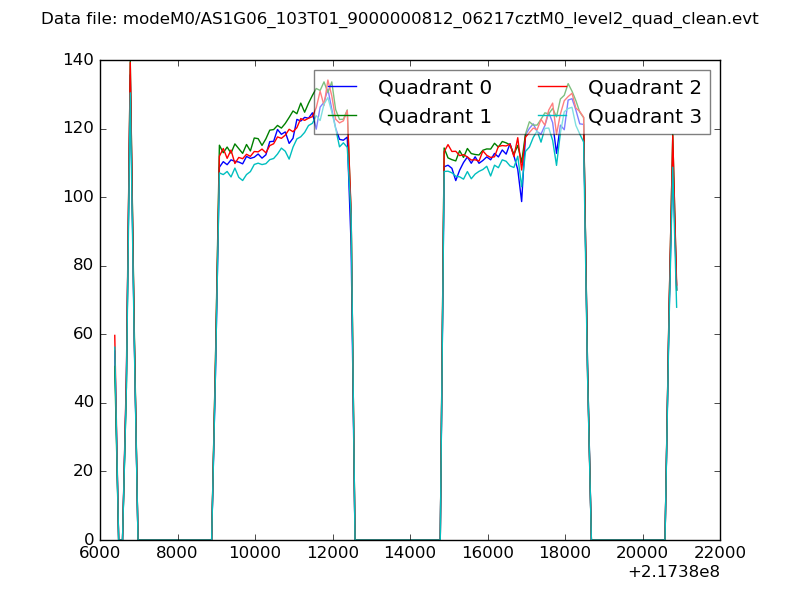 |
|
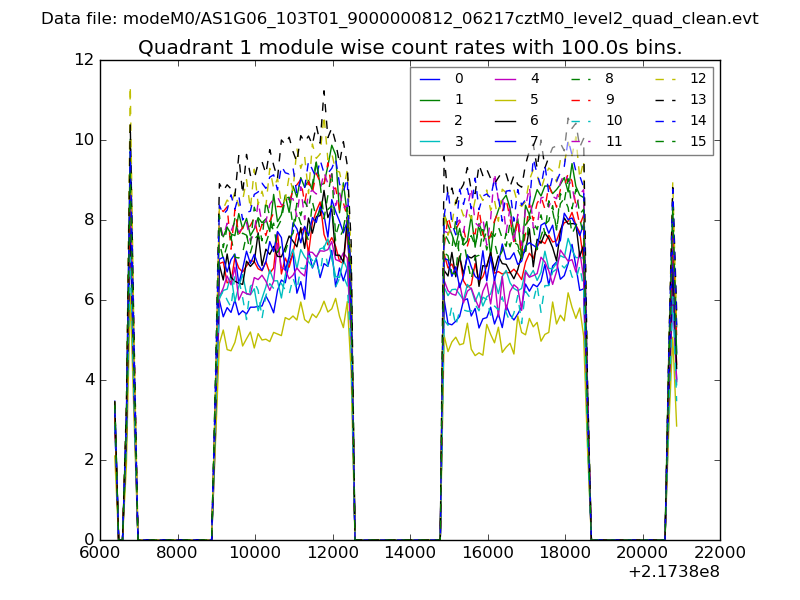
| Module-wise count rates for Quadrant A Data is divided into 100 sec bins |
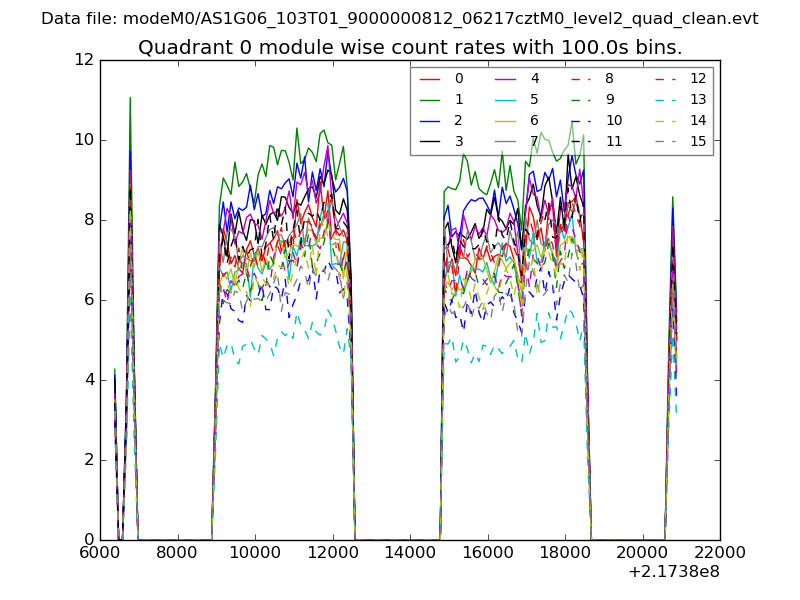 |
 |
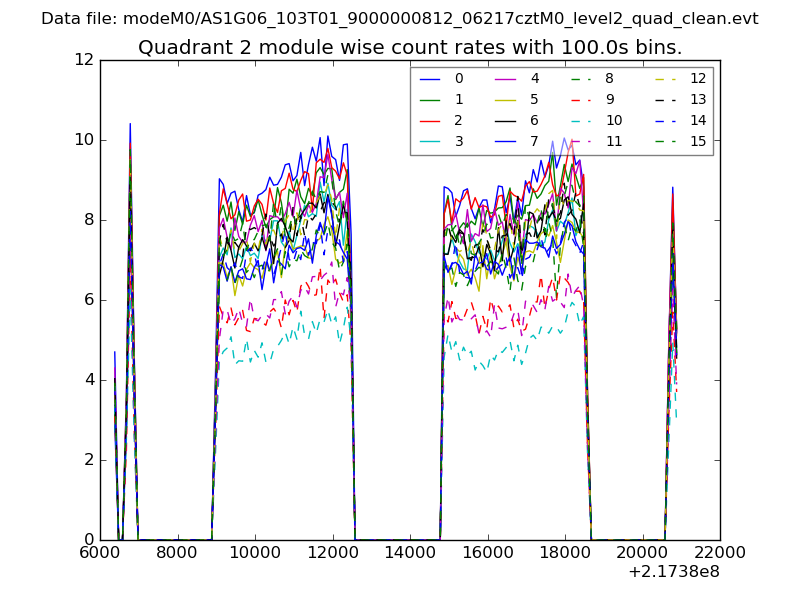
| Module-wise count rates for Quadrant B Data is divided into 100 sec bins |
 |
 |
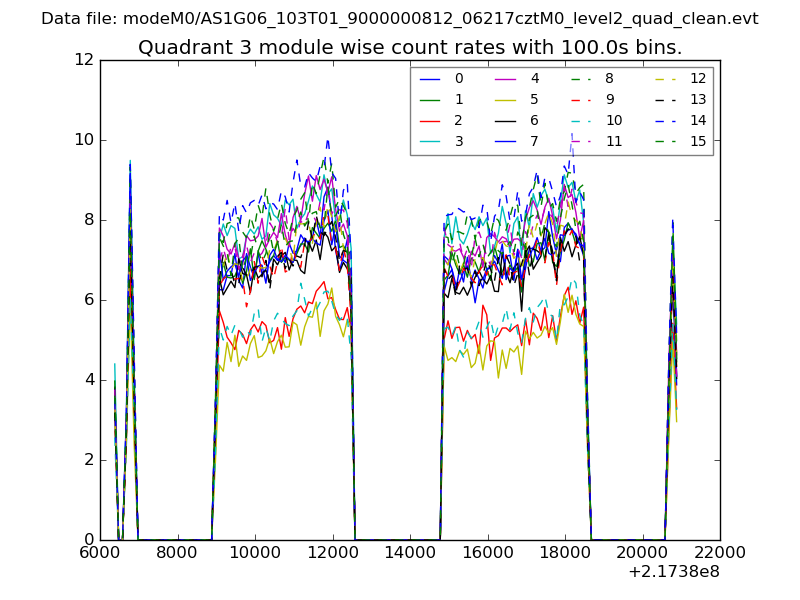
| Module-wise count rates for Quadrant C Data is divided into 100 sec bins |
 |
 |
| Module-wise count rates for Quadrant D Data is divided into 100 sec bins |
 |
 |
| Parameter | Plot |
|---|---|
| CZT HV Monitor | 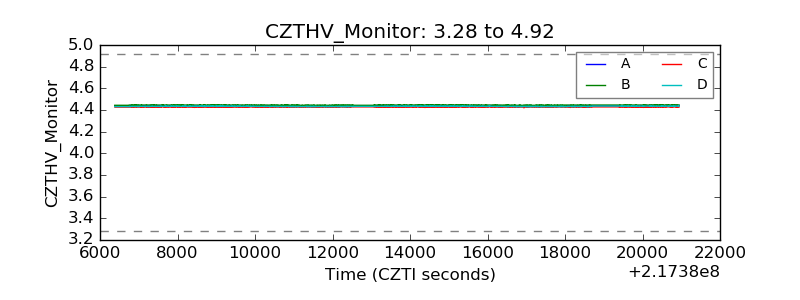 |
| D_VDD | 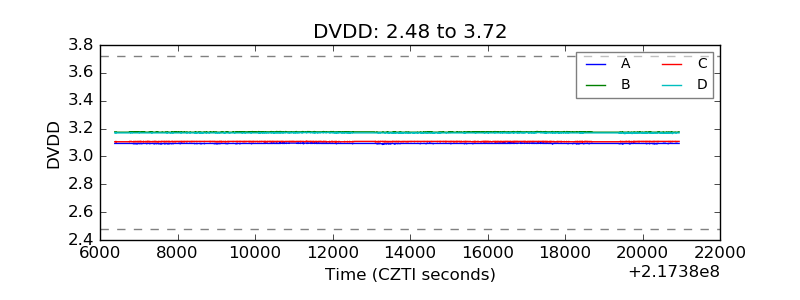 |
| Temperature 1 | 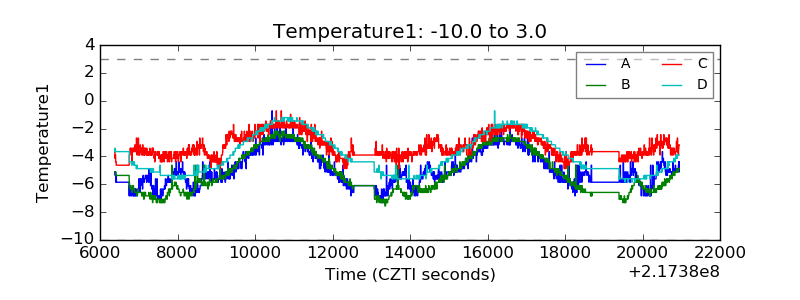 |
| Veto HV Monitor | 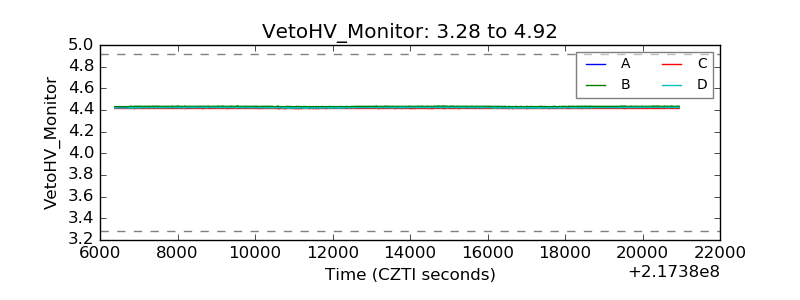 |
| Veto LLD | 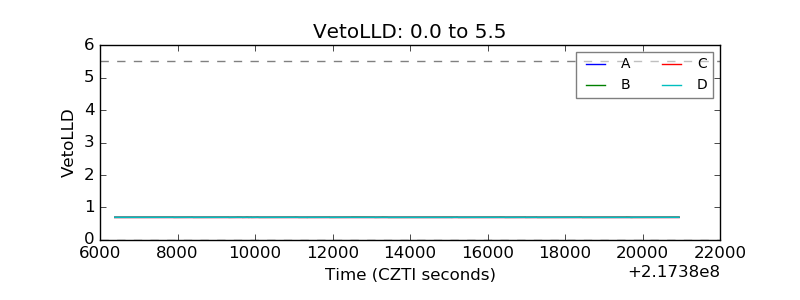 |
| Alpha Counter | 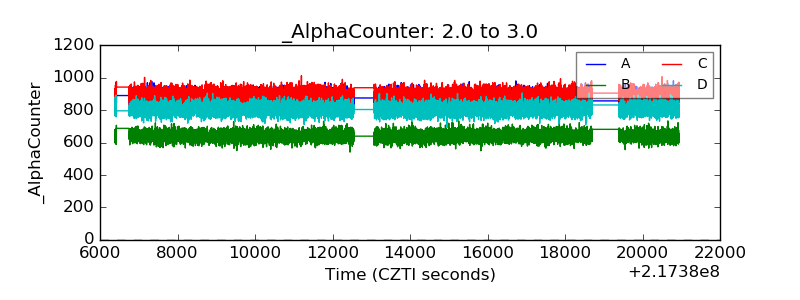 |
| _CPM_Rate | 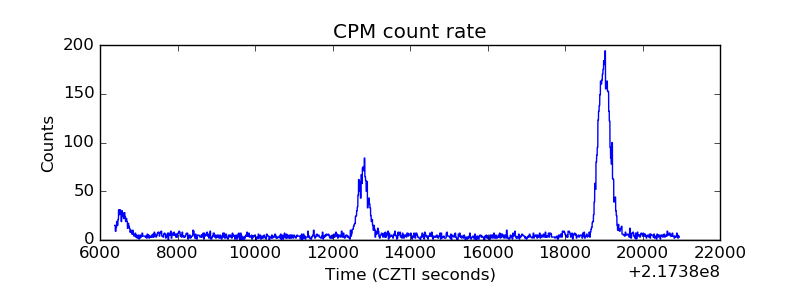 |
| CZT Counter | 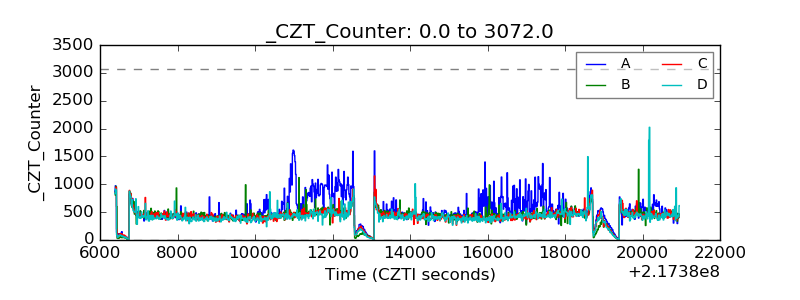 |
| +2.5 Volts monitor |  |
| +5 Volts monitor |  |
| _ROLL_ROT | 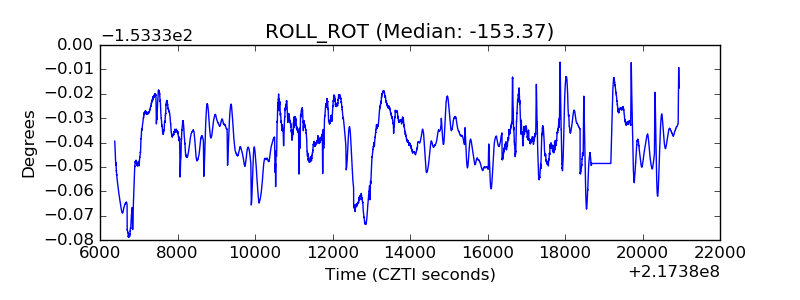 |
| _Roll_DEC | 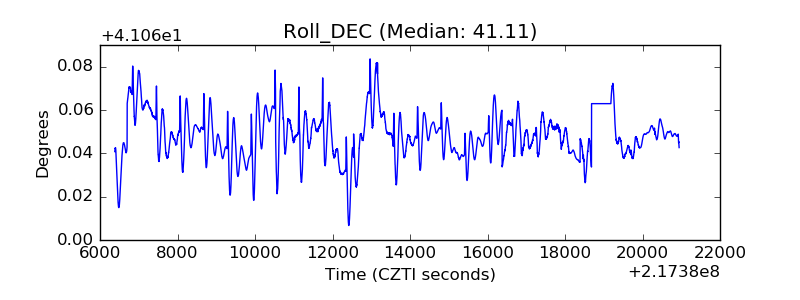 |
| _Roll_RA | 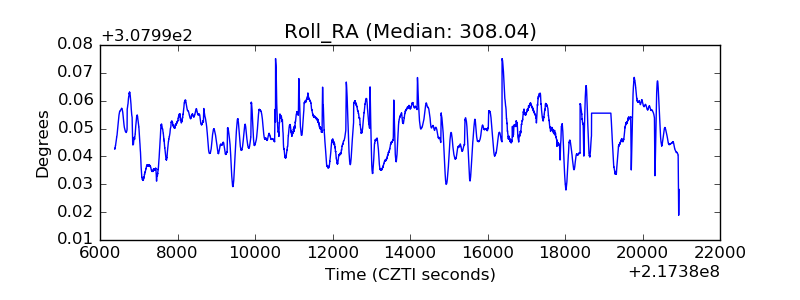 |
| Veto Counter | 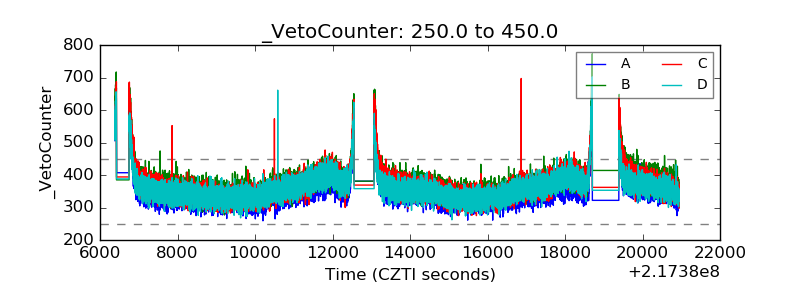 |