| Param | Original file | Final file |
|---|---|---|
| Filename | modeM0/AS1G06_103T01_9000000812_06218cztM0_level2.evt | modeM0/AS1G06_103T01_9000000812_06218cztM0_level2_quad_clean.evt |
| Size (bytes) | 404,426,880 | 80,170,560 |
| Size | 385.7 MB | 76.5 MB |
| Events in quadrant A | 3,060,176 | 499,611 |
| Events in quadrant B | 3,057,489 | 508,824 |
| Events in quadrant C | 2,791,359 | 502,102 |
| Events in quadrant D | 2,909,235 | 476,856 |
| Mode SS | |||
|---|---|---|---|
| Quadrant | BADHDUFLAG | Total packets | Discarded packets |
| A | 0 | 132 | 4 |
| B | 0 | 132 | 8 |
| C | 0 | 132 | 4 |
| D | 0 | 132 | 2 |
| Mode M9 | |||
|---|---|---|---|
| Quadrant | BADHDUFLAG | Total packets | Discarded packets |
| A | 0 | 9 | 2 |
| B | 0 | 9 | 0 |
| C | 0 | 9 | 0 |
| D | 0 | 9 | 0 |
| Mode M0 | |||
|---|---|---|---|
| Quadrant | BADHDUFLAG | Total packets | Discarded packets |
| A | 0 | 13702 | 458 |
| B | 0 | 13727 | 493 |
| C | 0 | 13144 | 383 |
| D | 0 | 13675 | 455 |
| Quadrant | Total seconds | Saturated seconds | Saturation percentage |
|---|---|---|---|
| A | 6310 | 26 | 0.412044% |
| B | 6292 | 77 | 1.223776% |
| C | 6334 | 19 | 0.299968% |
| D | 6304 | 40 | 0.634518% |
Noise dominated data is calculated using 1-second bins in cleaned event files. If a bin has >2000 counts, and if more than 50% of those come from <1% of pixels, then it is considered to be noise-dominated and hence unusable.
| Quadrant | # 1 sec bins | Bins with >0 counts | Bins with >2000 counts | High rate bins dominated by noise | Noise dominated (total time) | Noise dominated (detector-on time) | Marked lightcurve |
|---|---|---|---|---|---|---|---|
| A | 7402 | 6499 | 0 | 0 | 0.00% | 0.00% | 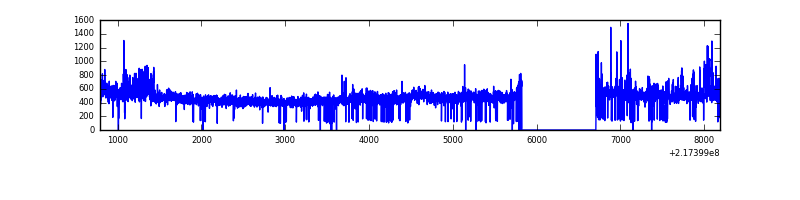 |
| B | 7402 | 6497 | 29 | 29 | 0.39% | 0.45% |  |
| C | 7402 | 6503 | 0 | 0 | 0.00% | 0.00% |  |
| D | 7402 | 6503 | 15 | 15 | 0.20% | 0.23% |  |
Top three noisy pixels from each quadrant. If the there are fewer than three noisy pixels in the level2.evt file, extra rows are filled as -1
| Pixel properties | Quadrant properties | ||||||
|---|---|---|---|---|---|---|---|
| Quadrant | DetID | PixID | Counts | Sigma | Mean | Median | Sigma |
| A | 15 | 236 | 197586 | 1307.21 | 732 | 714 | 150.6 |
| A | 15 | 239 | 17350 | 110.46 | 732 | 714 | 150.6 |
| A | 13 | 34 | 16115 | 102.26 | 732 | 714 | 150.6 |
| B | 0 | 219 | 197492 | 1385.16 | 734 | 717 | 142.1 |
| B | 12 | 111 | 14394 | 96.28 | 734 | 717 | 142.1 |
| B | 11 | 111 | 11500 | 75.9 | 734 | 717 | 142.1 |
| C | 1 | 16 | 6439 | 34.55 | 713 | 717 | 165.6 |
| C | 13 | 61 | 5667 | 29.89 | 713 | 717 | 165.6 |
| C | 8 | 222 | 2934 | 13.39 | 713 | 717 | 165.6 |
| D | 2 | 136 | 157657 | 910.71 | 707 | 685 | 172.4 |
| D | 12 | 110 | 26459 | 149.53 | 707 | 685 | 172.4 |
| D | 2 | 206 | 20874 | 117.13 | 707 | 685 | 172.4 |
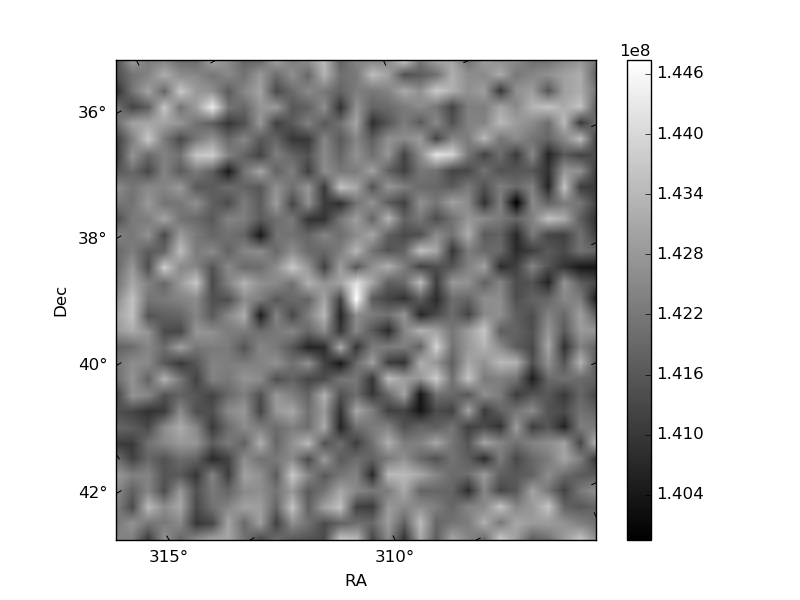
Histogram calculated using DETX and DETY for each event in the final _common_clean file
| Quadrant A | 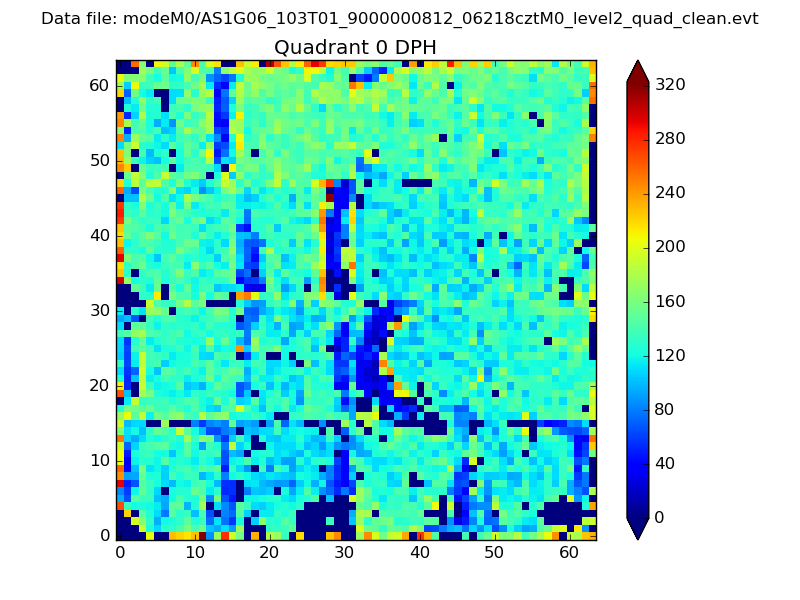 |
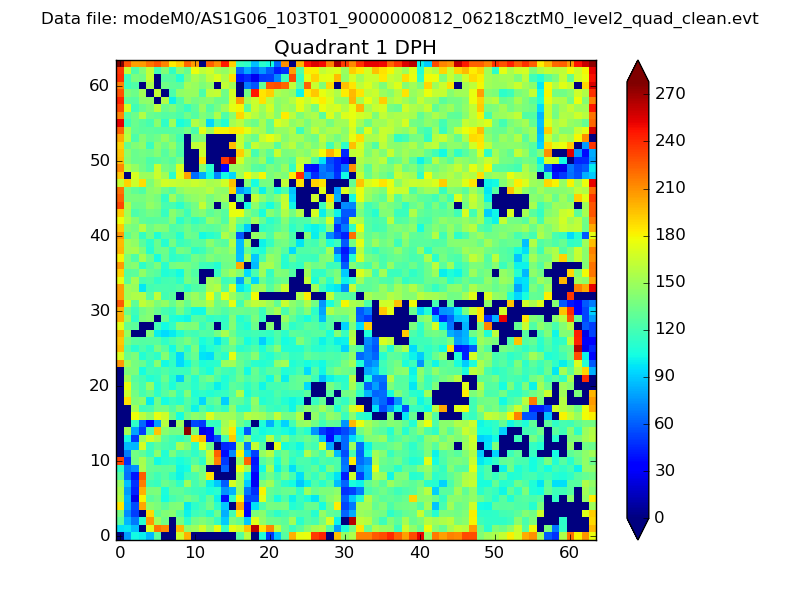 |
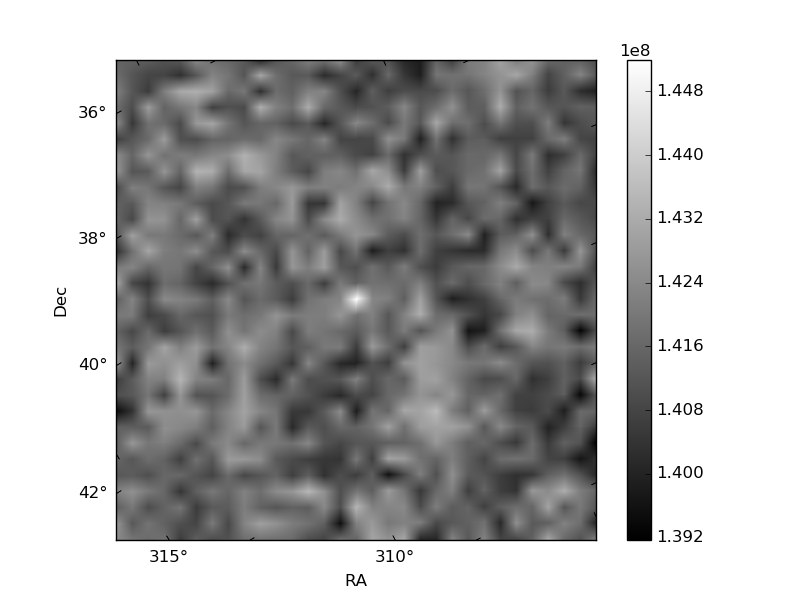
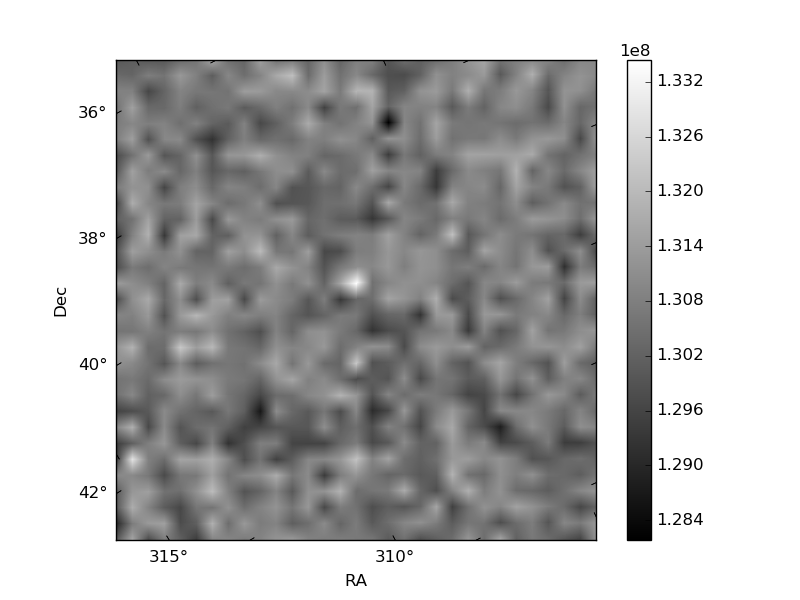
Quadrant B |
|---|---|---|---|
| Quadrant D | 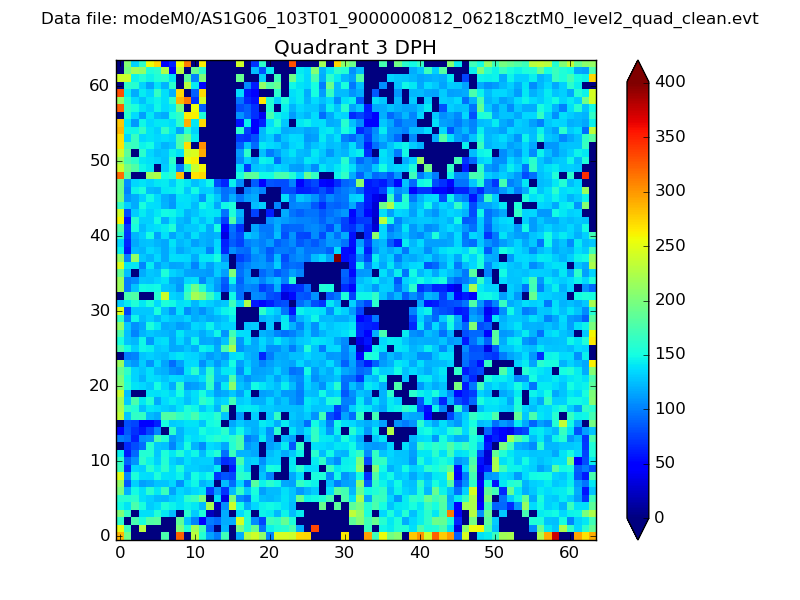 |
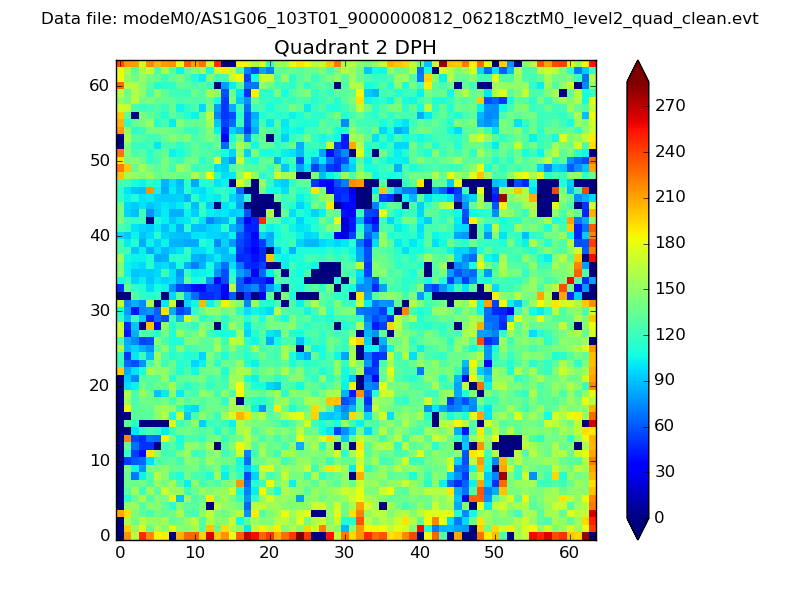 |
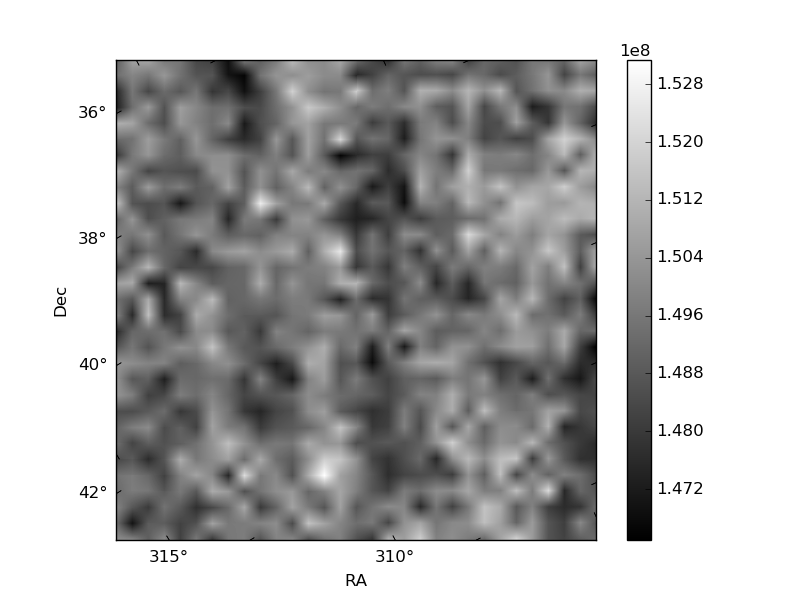
Quadrant C |
| Plot type | Count rate plots | Images |
|---|---|---|
| Comparison with Poisson distribution Blue bars denote a histogram of data divided into 1 sec bins. Red curve is a Poisson curve with rate = median count rate of data. |
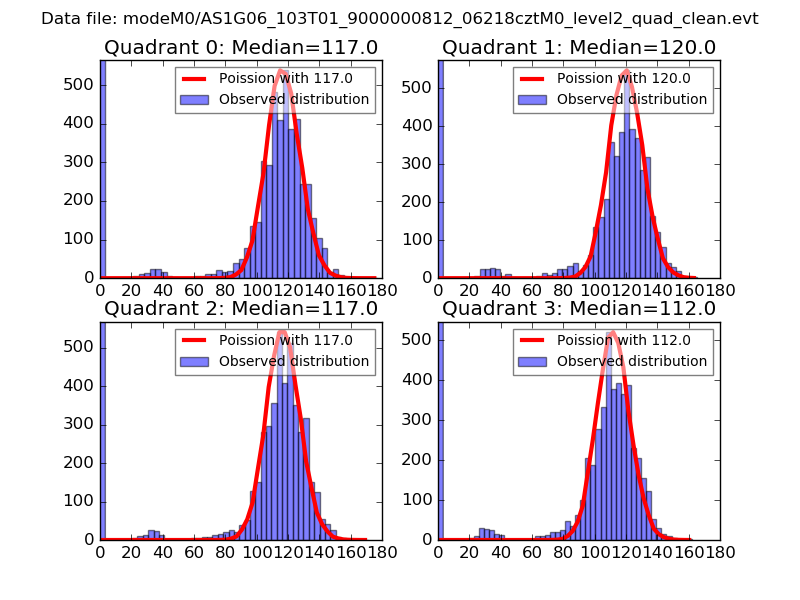 |
 |
| Quadrant-wise count rates Data is divided into 100 sec bins |
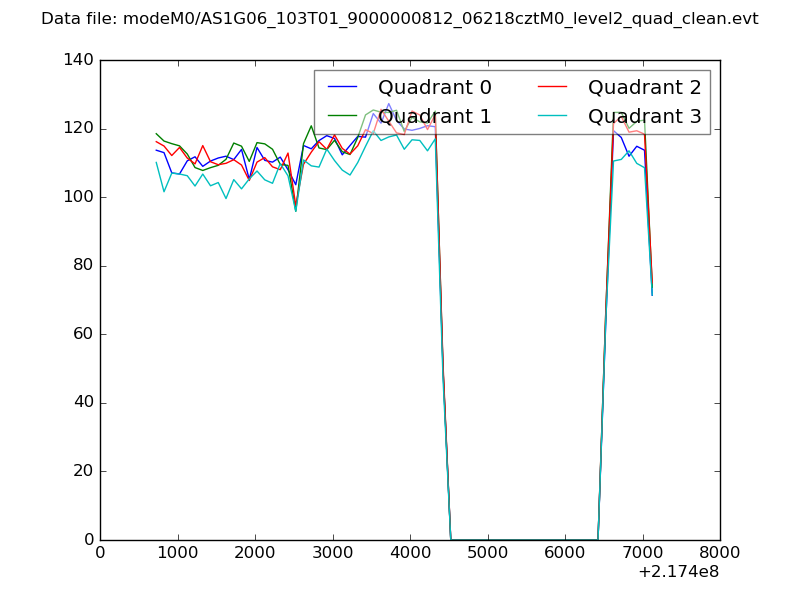 |
|
| Module-wise count rates for Quadrant A Data is divided into 100 sec bins |
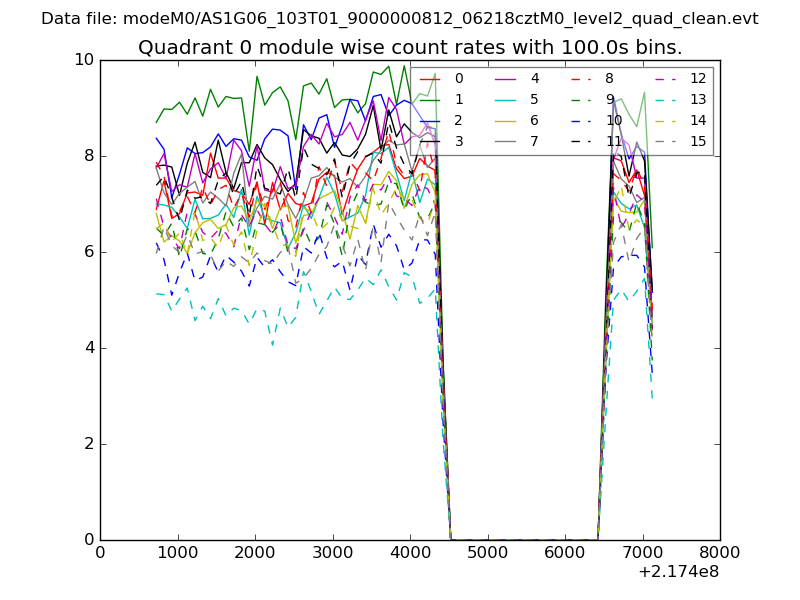 |
 |
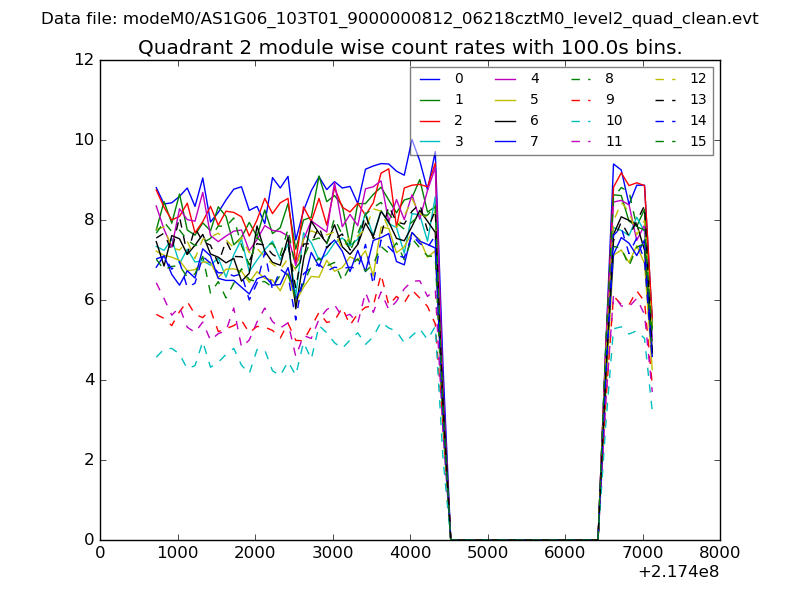
| Module-wise count rates for Quadrant B Data is divided into 100 sec bins |
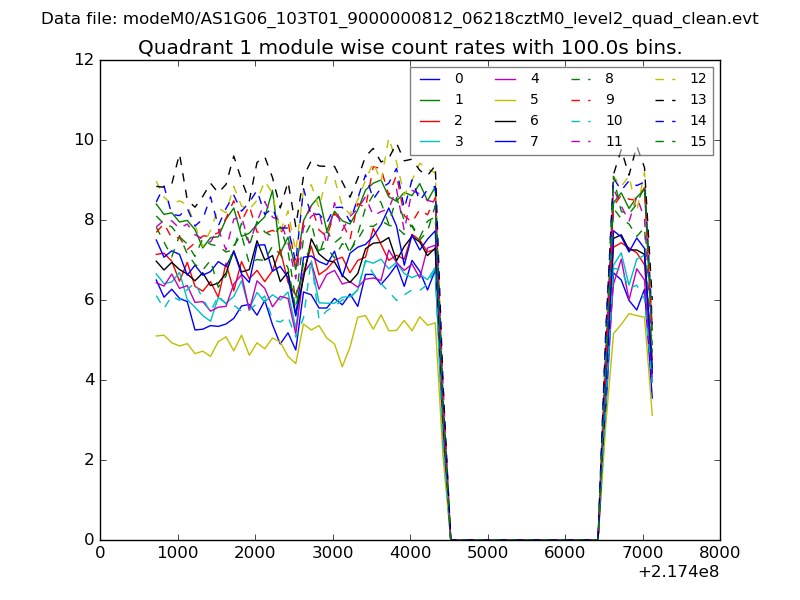 |
 |
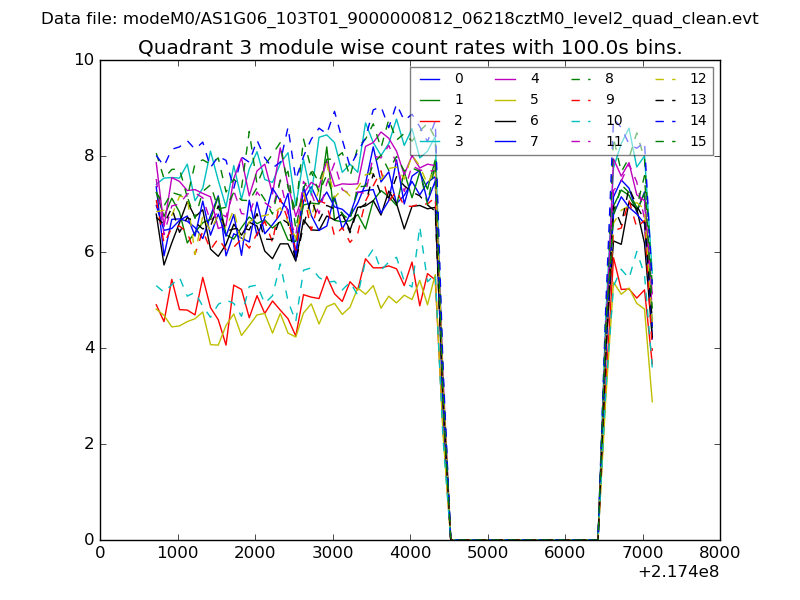
| Module-wise count rates for Quadrant C Data is divided into 100 sec bins |
 |
 |
| Module-wise count rates for Quadrant D Data is divided into 100 sec bins |
 |
 |
| Parameter | Plot |
|---|---|
| CZT HV Monitor | 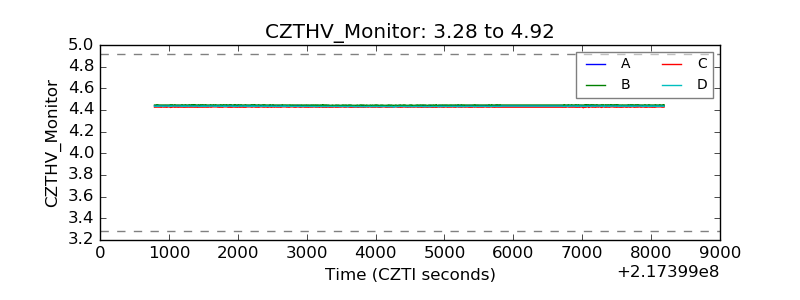 |
| D_VDD | 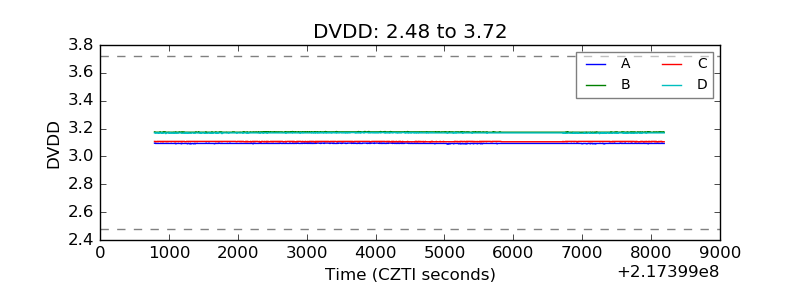 |
| Temperature 1 | 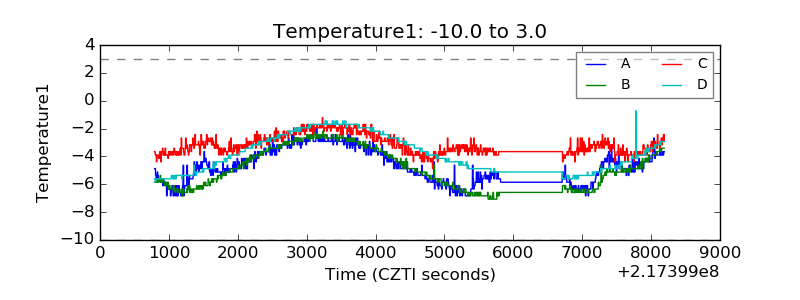 |
| Veto HV Monitor | 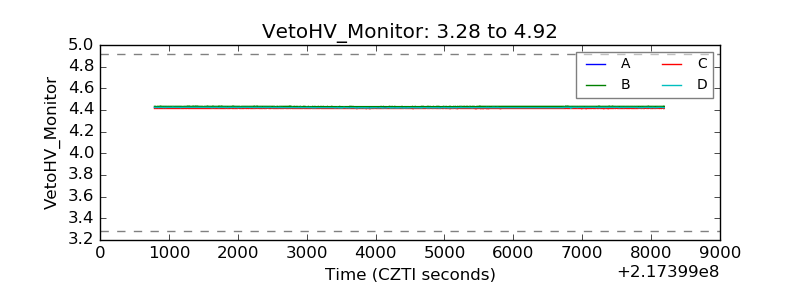 |
| Veto LLD | 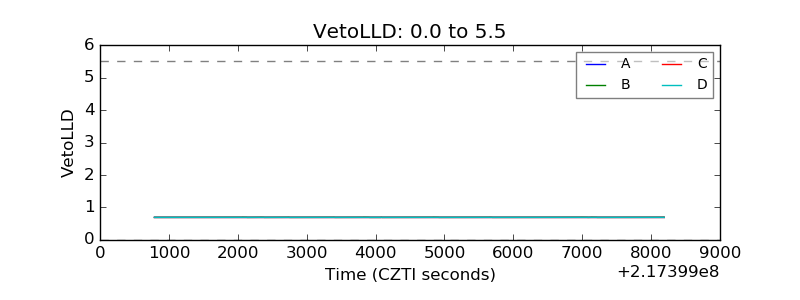 |
| Alpha Counter | 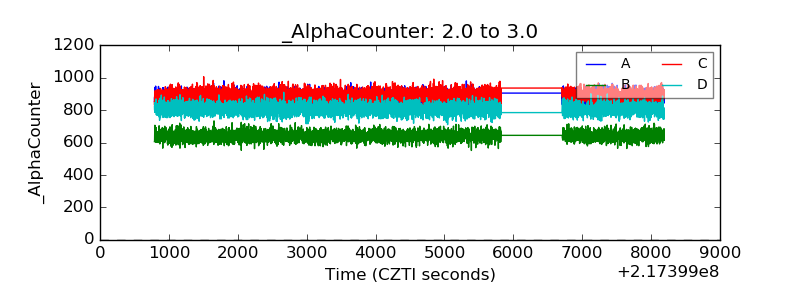 |
| _CPM_Rate | 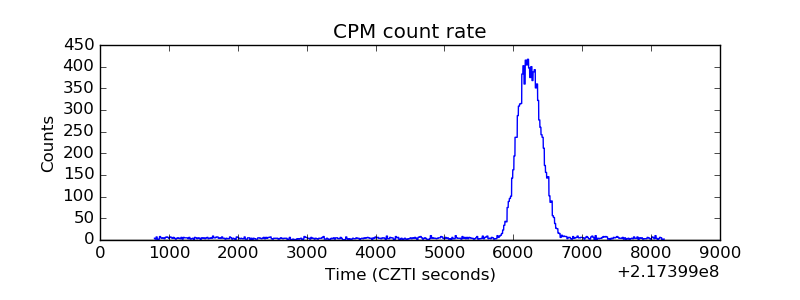 |
| CZT Counter | 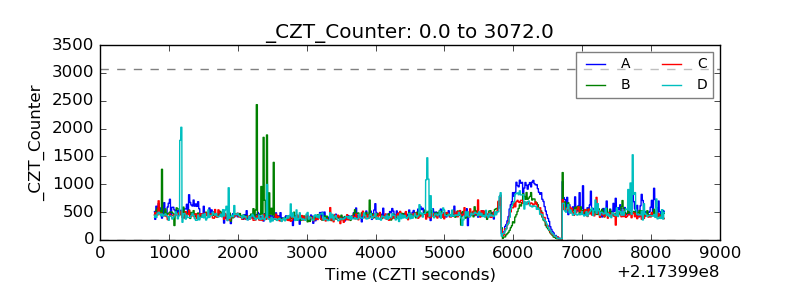 |
| +2.5 Volts monitor |  |
| +5 Volts monitor |  |
| _ROLL_ROT | 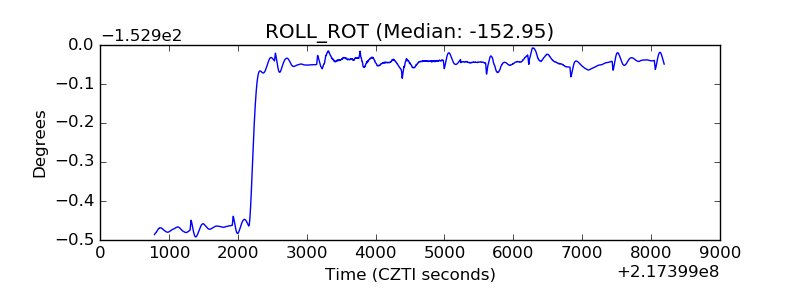 |
| _Roll_DEC | 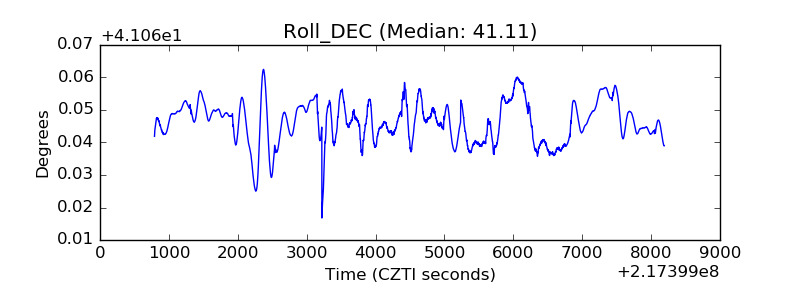 |
| _Roll_RA | 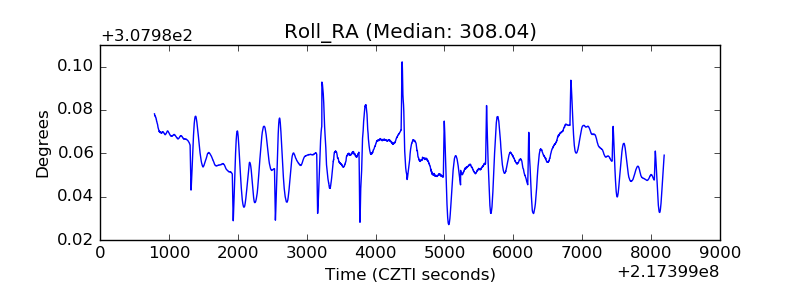 |
| Veto Counter | 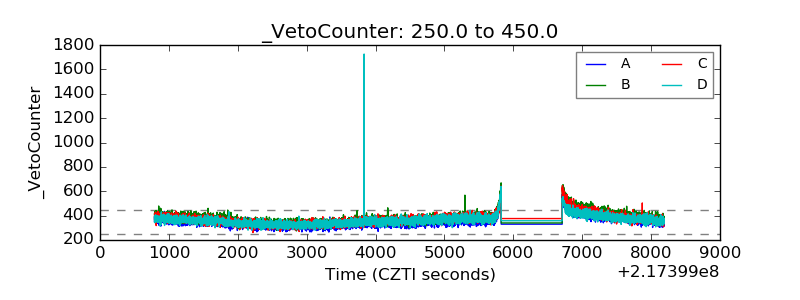 |