| Param | Original file | Final file |
|---|---|---|
| Filename | modeM0/AS1G06_103T01_9000000812_06219cztM0_level2.evt | modeM0/AS1G06_103T01_9000000812_06219cztM0_level2_quad_clean.evt |
| Size (bytes) | 395,737,920 | 87,523,200 |
| Size | 377.4 MB | 83.5 MB |
| Events in quadrant A | 2,968,746 | 558,586 |
| Events in quadrant B | 3,000,718 | 570,791 |
| Events in quadrant C | 2,753,773 | 557,750 |
| Events in quadrant D | 2,840,572 | 531,654 |
| Mode SS | |||
|---|---|---|---|
| Quadrant | BADHDUFLAG | Total packets | Discarded packets |
| A | 0 | 126 | 0 |
| B | 0 | 126 | 0 |
| C | 0 | 126 | 0 |
| D | 0 | 126 | 0 |
| Mode M9 | |||
|---|---|---|---|
| Quadrant | BADHDUFLAG | Total packets | Discarded packets |
| A | 0 | 10 | 0 |
| B | 0 | 10 | 0 |
| C | 0 | 10 | 0 |
| D | 0 | 10 | 0 |
| Mode M0 | |||
|---|---|---|---|
| Quadrant | BADHDUFLAG | Total packets | Discarded packets |
| A | 0 | 12961 | 74 |
| B | 0 | 13038 | 71 |
| C | 0 | 12637 | 75 |
| D | 0 | 12924 | 100 |
| Quadrant | Total seconds | Saturated seconds | Saturation percentage |
|---|---|---|---|
| A | 6186 | 75 | 1.212415% |
| B | 6189 | 104 | 1.680401% |
| C | 6184 | 39 | 0.630660% |
| D | 6175 | 41 | 0.663968% |
Noise dominated data is calculated using 1-second bins in cleaned event files. If a bin has >2000 counts, and if more than 50% of those come from <1% of pixels, then it is considered to be noise-dominated and hence unusable.
| Quadrant | # 1 sec bins | Bins with >0 counts | Bins with >2000 counts | High rate bins dominated by noise | Noise dominated (total time) | Noise dominated (detector-on time) | Marked lightcurve |
|---|---|---|---|---|---|---|---|
| A | 7206 | 6221 | 0 | 0 | 0.00% | 0.00% | 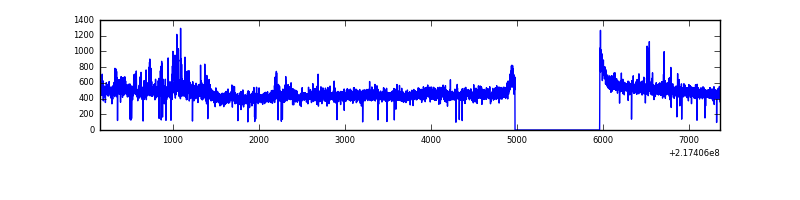 |
| B | 7206 | 6220 | 16 | 16 | 0.22% | 0.26% | 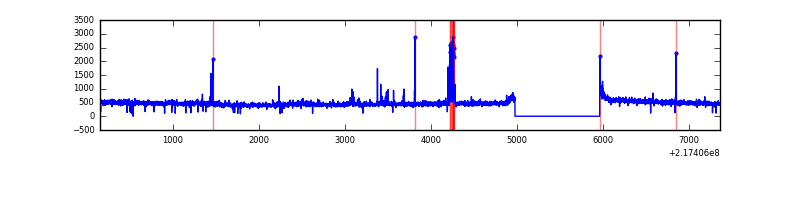 |
| C | 7206 | 6222 | 0 | 0 | 0.00% | 0.00% | 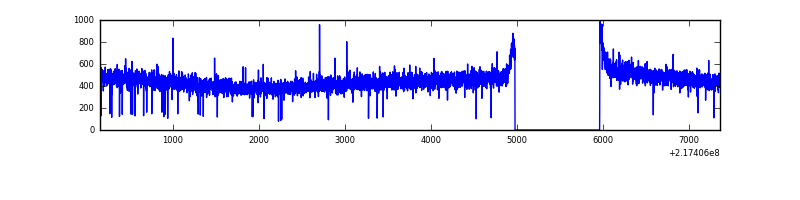 |
| D | 7206 | 6221 | 0 | 0 | 0.00% | 0.00% | 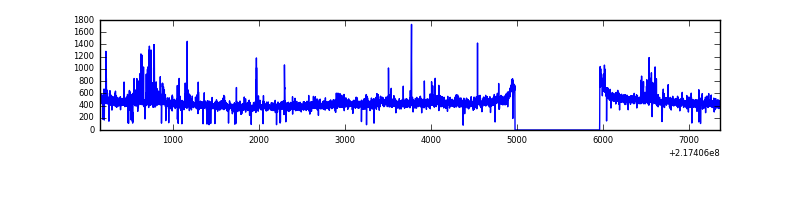 |
Top three noisy pixels from each quadrant. If the there are fewer than three noisy pixels in the level2.evt file, extra rows are filled as -1
| Pixel properties | Quadrant properties | ||||||
|---|---|---|---|---|---|---|---|
| Quadrant | DetID | PixID | Counts | Sigma | Mean | Median | Sigma |
| A | 15 | 236 | 129086 | 852.95 | 731 | 713 | 150.5 |
| A | 8 | 15 | 13485 | 84.86 | 731 | 713 | 150.5 |
| A | 0 | 31 | 9364 | 57.48 | 731 | 713 | 150.5 |
| B | 15 | 35 | 64083 | 452.73 | 733 | 717 | 140.0 |
| B | 0 | 219 | 37861 | 265.38 | 733 | 717 | 140.0 |
| B | 0 | 214 | 21521 | 148.64 | 733 | 717 | 140.0 |
| C | 1 | 16 | 9663 | 55.07 | 703 | 707 | 162.6 |
| C | 13 | 61 | 5464 | 29.25 | 703 | 707 | 162.6 |
| C | 9 | 54 | 2075 | 8.41 | 703 | 707 | 162.6 |
| D | 2 | 136 | 94301 | 534.35 | 705 | 681 | 175.2 |
| D | 2 | 63 | 36539 | 204.66 | 705 | 681 | 175.2 |
| D | 14 | 173 | 20814 | 114.91 | 705 | 681 | 175.2 |
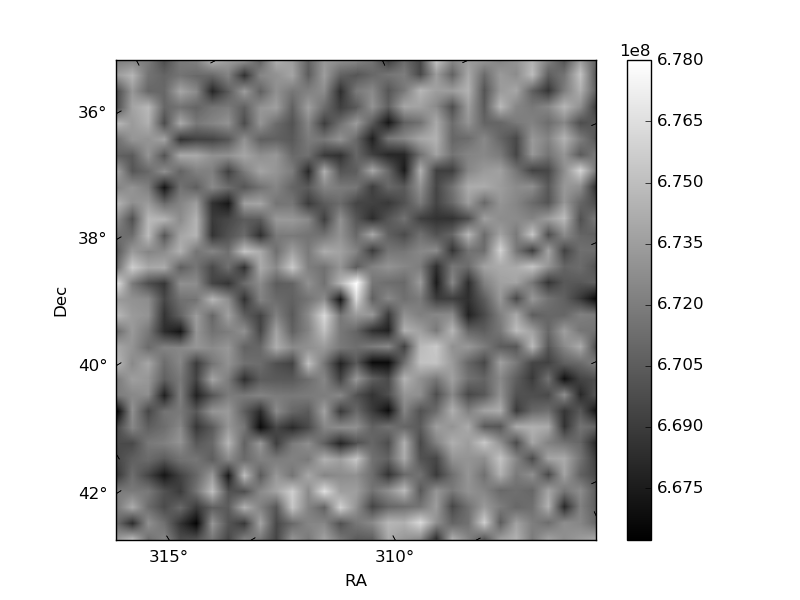
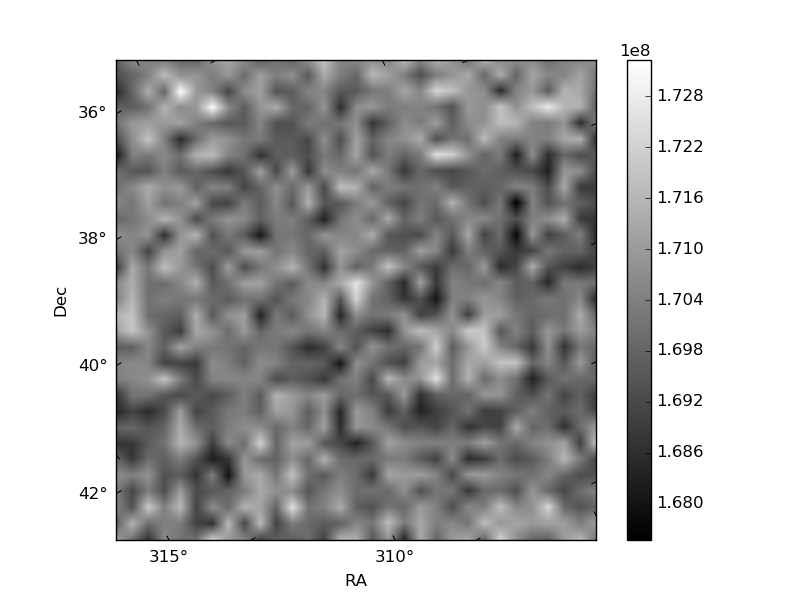
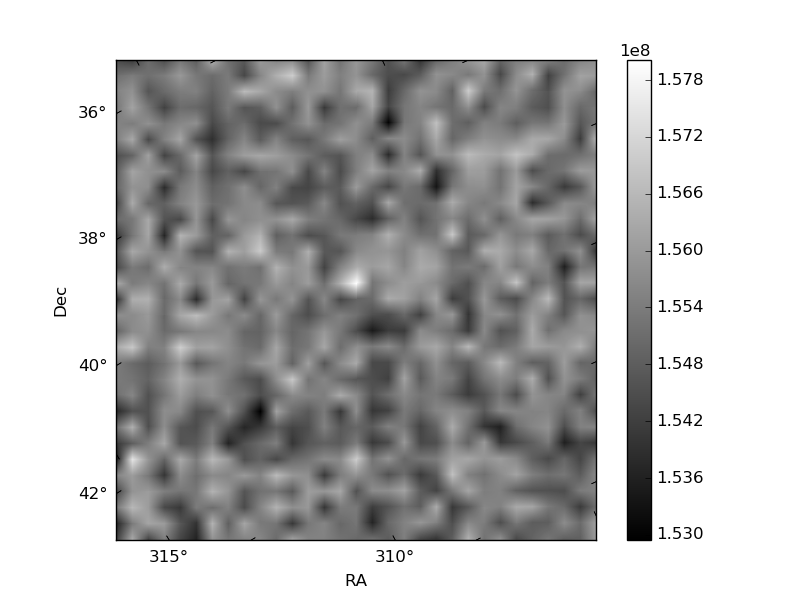
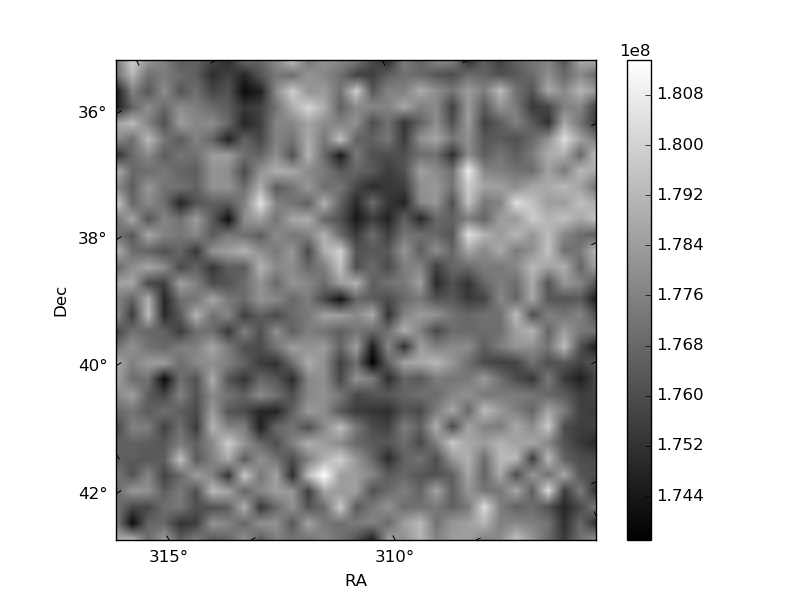
Histogram calculated using DETX and DETY for each event in the final _common_clean file
| Quadrant A | 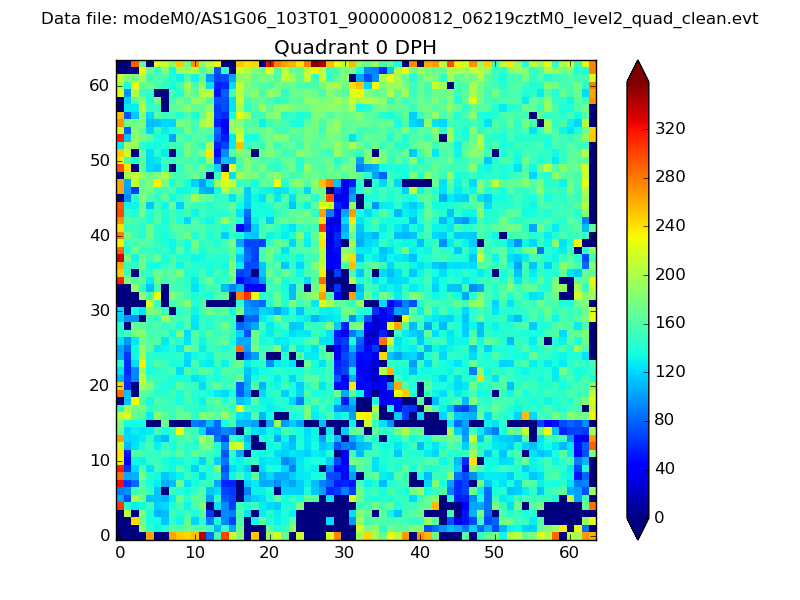 |
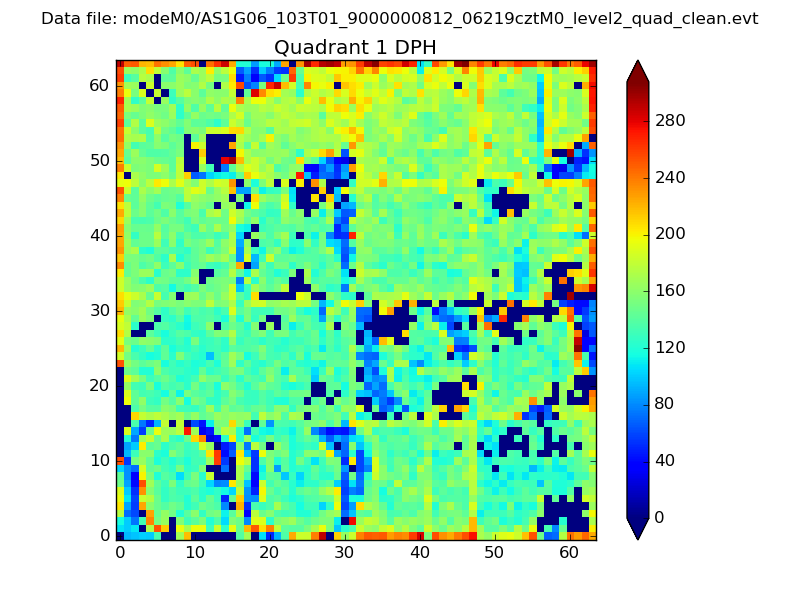 |
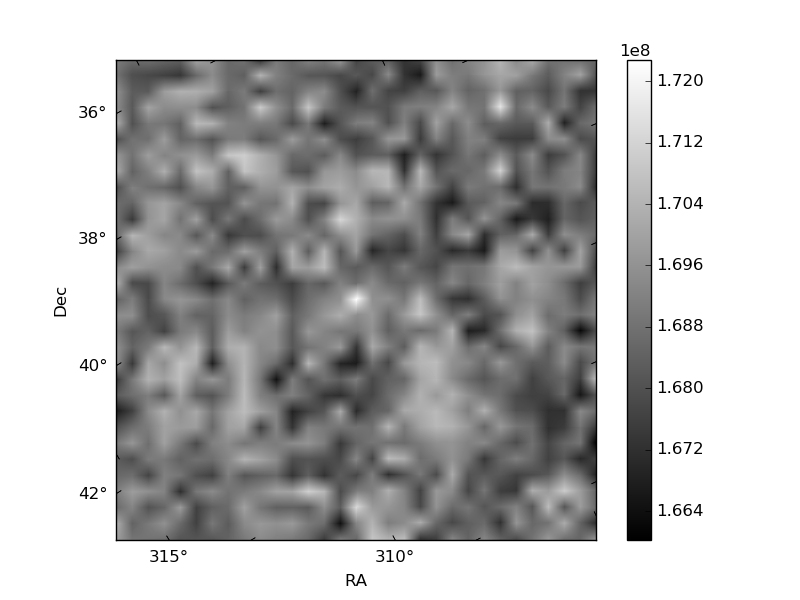
Quadrant B |
|---|---|---|---|
| Quadrant D | 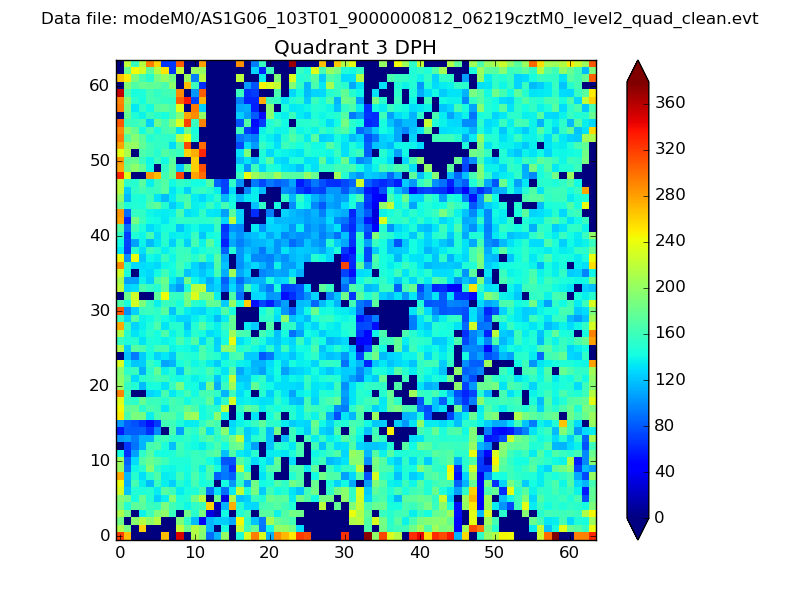 |
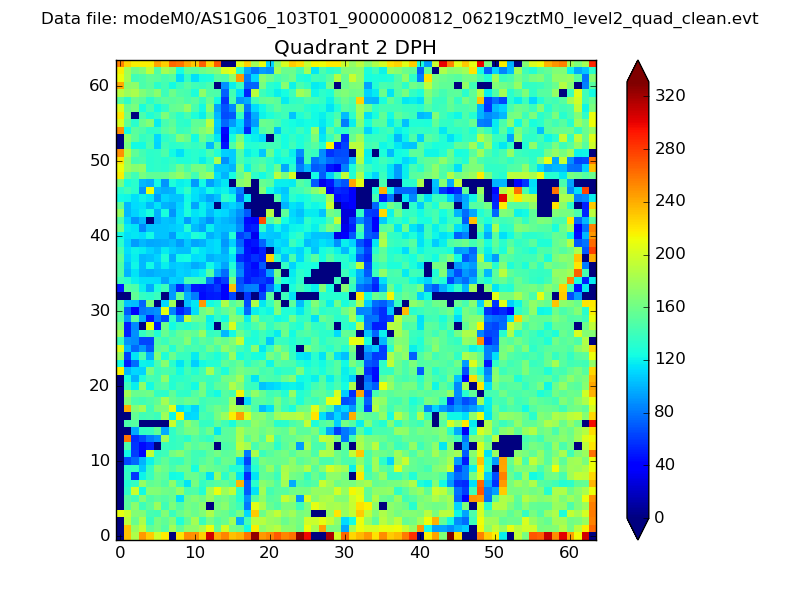 |
Quadrant C |
| Plot type | Count rate plots | Images |
|---|---|---|
| Comparison with Poisson distribution Blue bars denote a histogram of data divided into 1 sec bins. Red curve is a Poisson curve with rate = median count rate of data. |
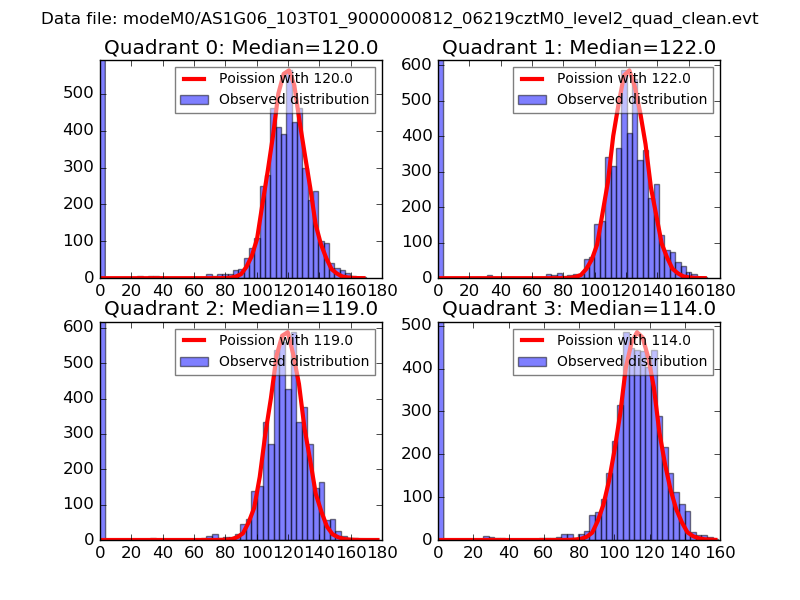 |
 |
| Quadrant-wise count rates Data is divided into 100 sec bins |
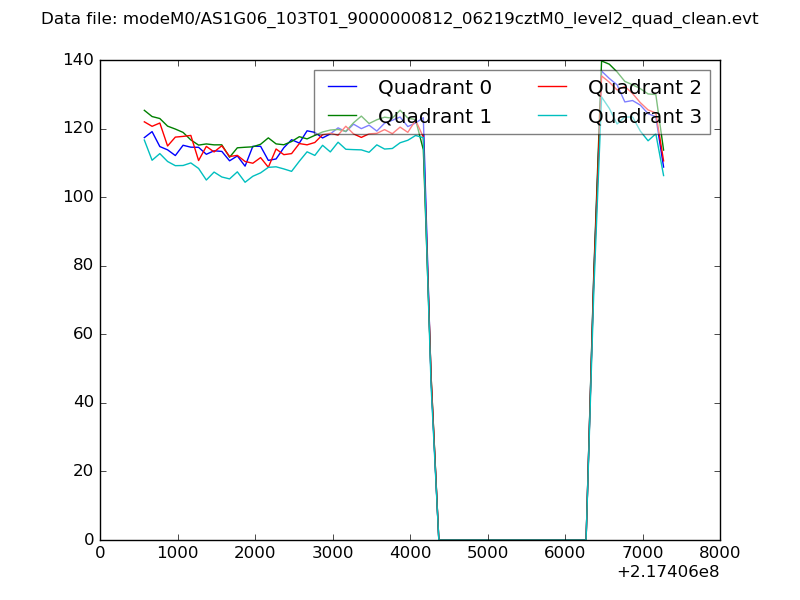 |
|
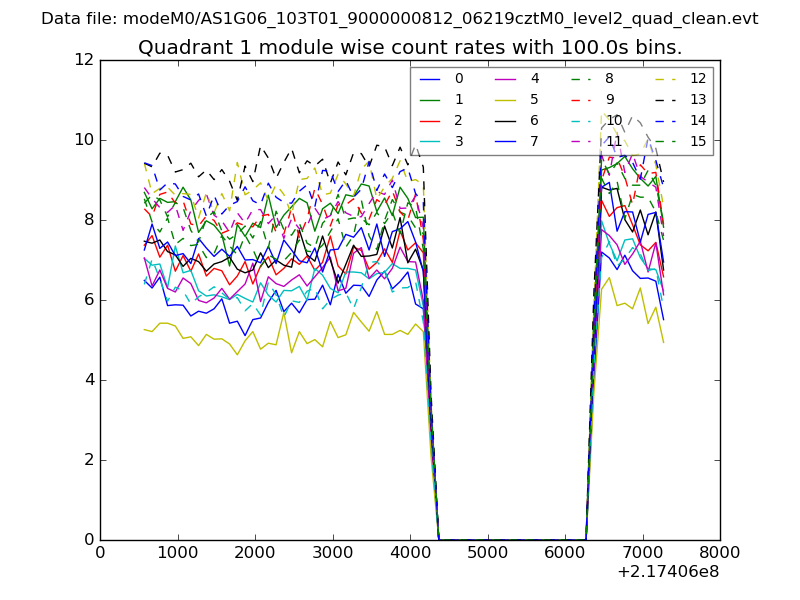
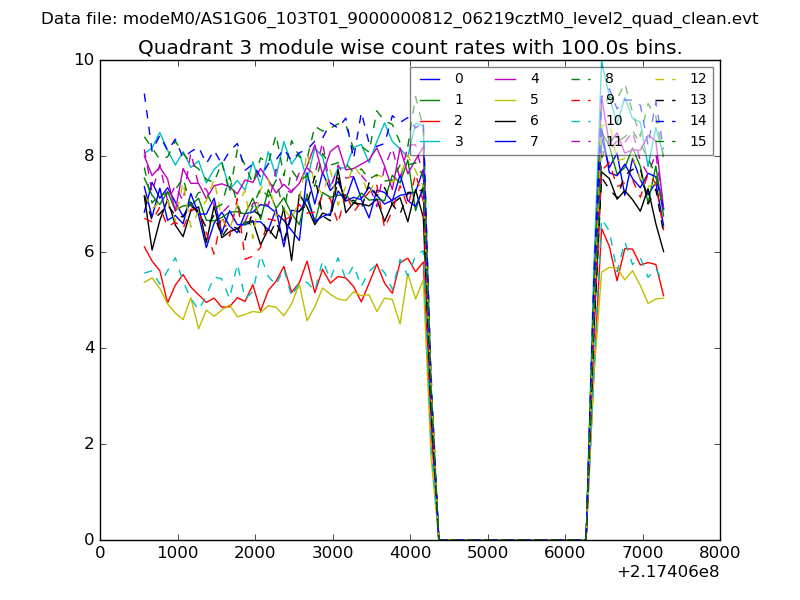
| Module-wise count rates for Quadrant A Data is divided into 100 sec bins |
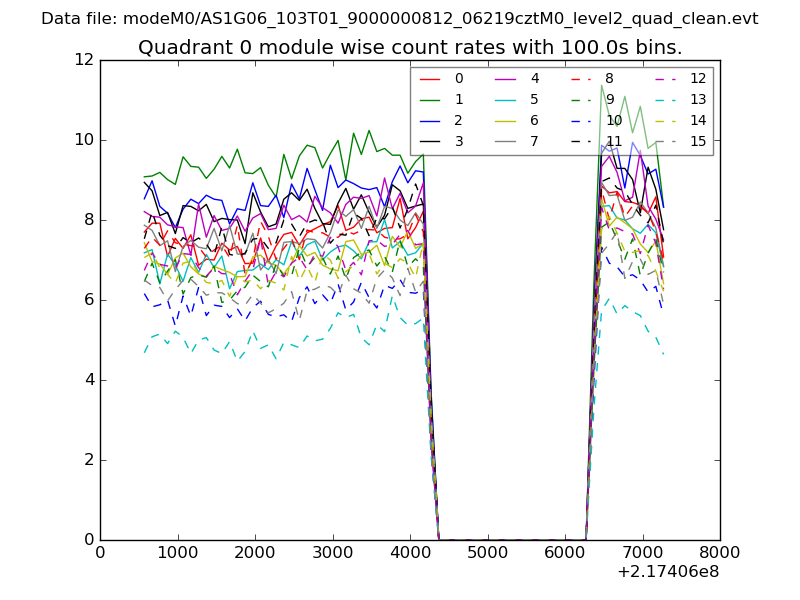 |
 |
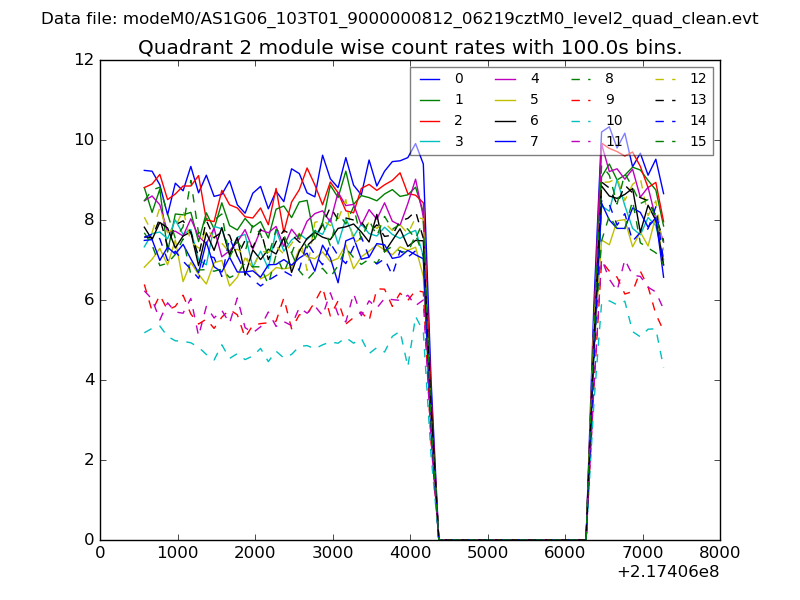
| Module-wise count rates for Quadrant B Data is divided into 100 sec bins |
 |
 |
| Module-wise count rates for Quadrant C Data is divided into 100 sec bins |
 |
 |
| Module-wise count rates for Quadrant D Data is divided into 100 sec bins |
 |
 |
| Parameter | Plot |
|---|---|
| CZT HV Monitor | 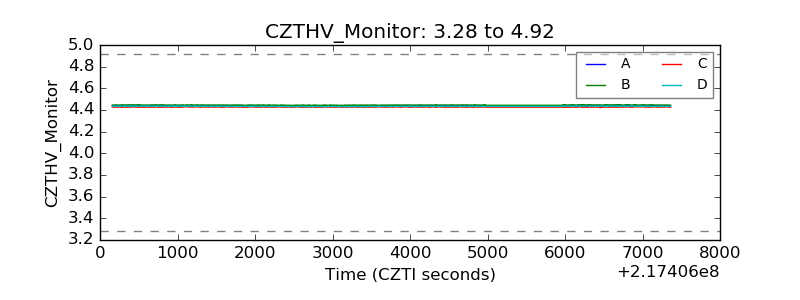 |
| D_VDD | 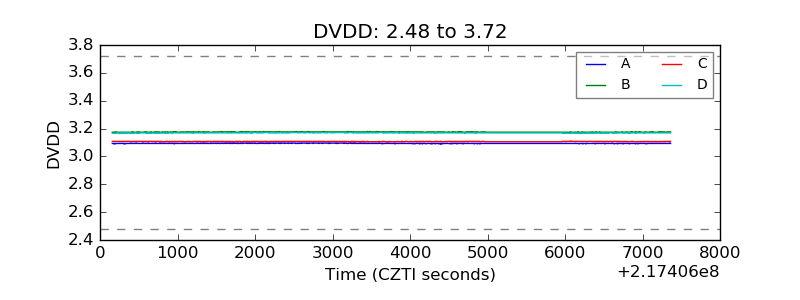 |
| Temperature 1 | 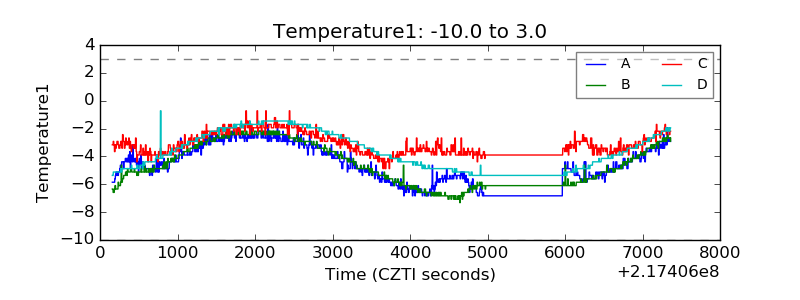 |
| Veto HV Monitor | 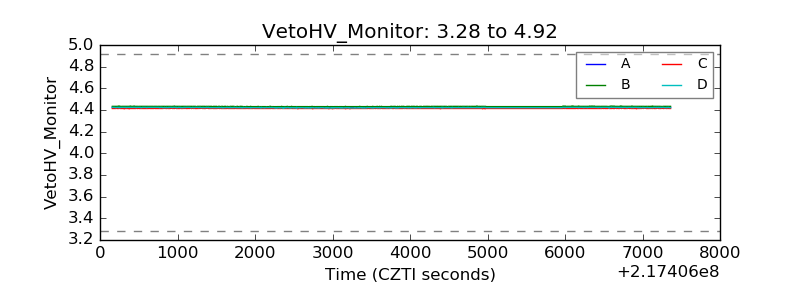 |
| Veto LLD | 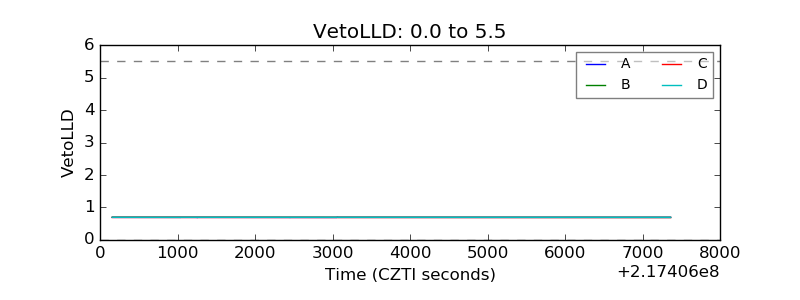 |
| Alpha Counter | 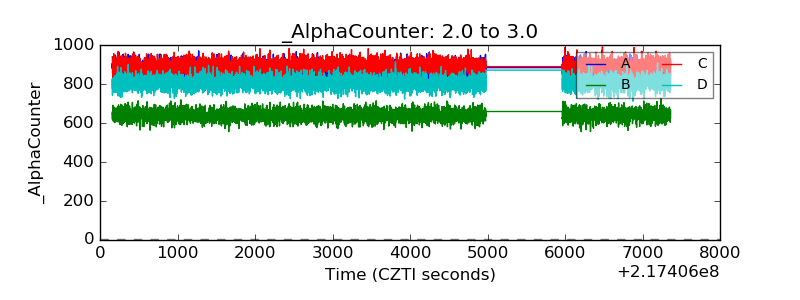 |
| _CPM_Rate | 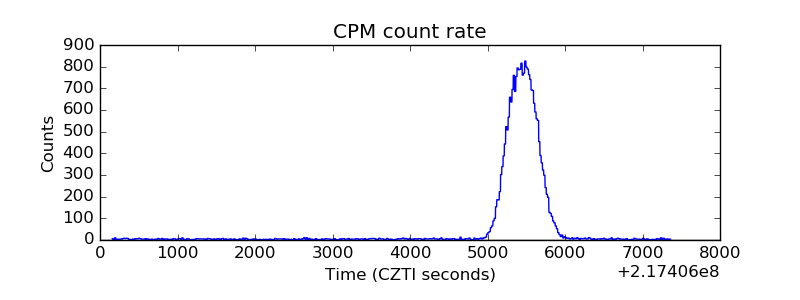 |
| CZT Counter | 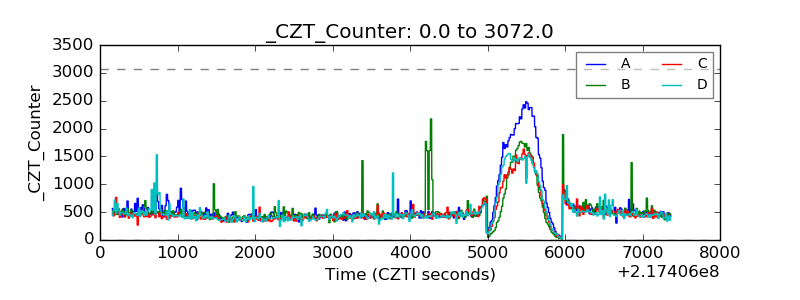 |
| +2.5 Volts monitor | 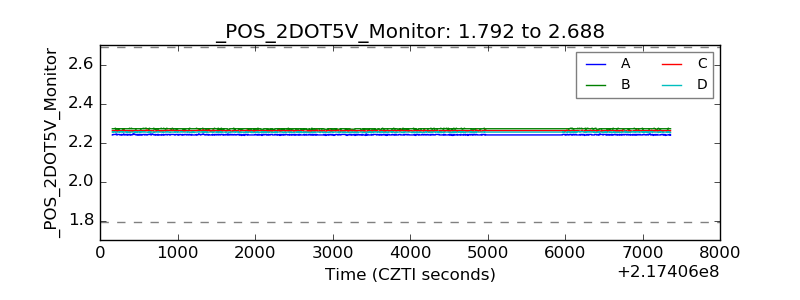 |
| +5 Volts monitor |  |
| _ROLL_ROT | 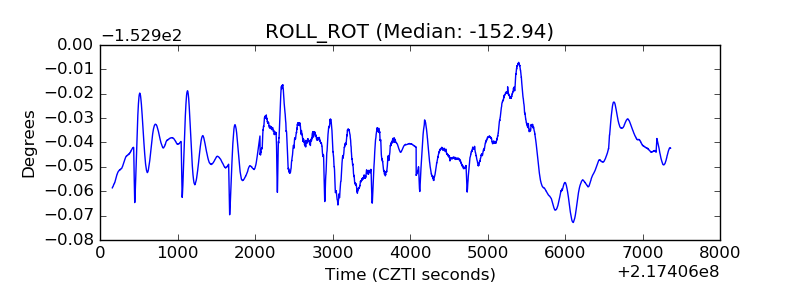 |
| _Roll_DEC | 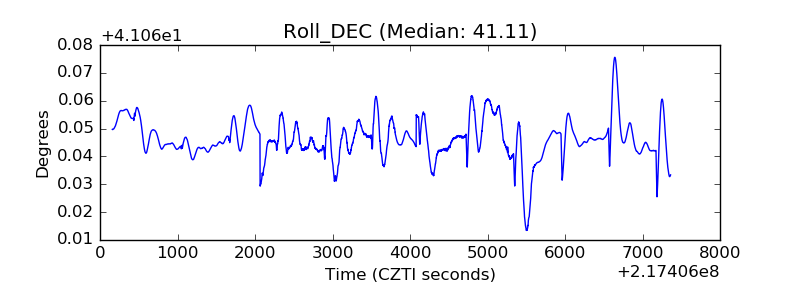 |
| _Roll_RA | 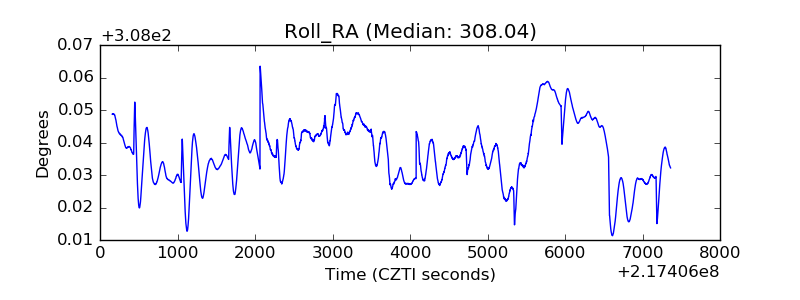 |
| Veto Counter | 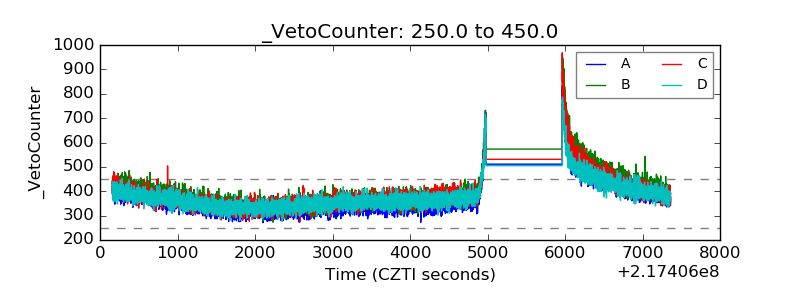 |