| Param | Original file | Final file |
|---|---|---|
| Filename | modeM0/AS1G06_103T01_9000000812_06222cztM0_level2.evt | modeM0/AS1G06_103T01_9000000812_06222cztM0_level2_quad_clean.evt |
| Size (bytes) | 563,025,600 | 130,098,240 |
| Size | 536.9 MB | 124.1 MB |
| Events in quadrant A | 4,155,103 | 838,643 |
| Events in quadrant B | 4,263,776 | 849,678 |
| Events in quadrant C | 3,946,425 | 829,527 |
| Events in quadrant D | 4,072,503 | 796,075 |
| Mode SS | |||
|---|---|---|---|
| Quadrant | BADHDUFLAG | Total packets | Discarded packets |
| A | 0 | 184 | 0 |
| B | 0 | 184 | 0 |
| C | 0 | 184 | 0 |
| D | 0 | 184 | 0 |
| Mode M9 | |||
|---|---|---|---|
| Quadrant | BADHDUFLAG | Total packets | Discarded packets |
| A | 0 | 18 | 0 |
| B | 0 | 18 | 0 |
| C | 0 | 18 | 0 |
| D | 0 | 18 | 0 |
| Mode M0 | |||
|---|---|---|---|
| Quadrant | BADHDUFLAG | Total packets | Discarded packets |
| A | 0 | 18593 | 32 |
| B | 0 | 18846 | 60 |
| C | 0 | 18363 | 48 |
| D | 0 | 18674 | 43 |
| Quadrant | Total seconds | Saturated seconds | Saturation percentage |
|---|---|---|---|
| A | 9036 | 123 | 1.361222% |
| B | 9024 | 139 | 1.540337% |
| C | 9027 | 72 | 0.797607% |
| D | 9031 | 82 | 0.907984% |
Noise dominated data is calculated using 1-second bins in cleaned event files. If a bin has >2000 counts, and if more than 50% of those come from <1% of pixels, then it is considered to be noise-dominated and hence unusable.
| Quadrant | # 1 sec bins | Bins with >0 counts | Bins with >2000 counts | High rate bins dominated by noise | Noise dominated (total time) | Noise dominated (detector-on time) | Marked lightcurve |
|---|---|---|---|---|---|---|---|
| A | 10034 | 9047 | 0 | 0 | 0.00% | 0.00% | 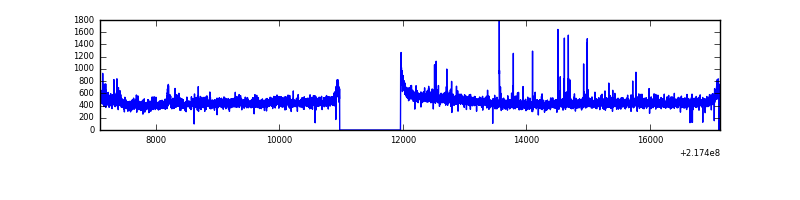 |
| B | 10034 | 9048 | 16 | 16 | 0.16% | 0.18% | 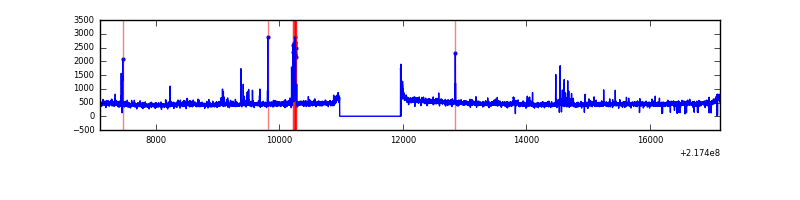 |
| C | 10034 | 9050 | 0 | 0 | 0.00% | 0.00% | 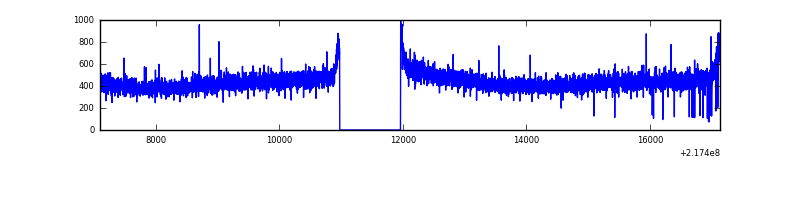 |
| D | 10034 | 9048 | 2 | 2 | 0.02% | 0.02% | 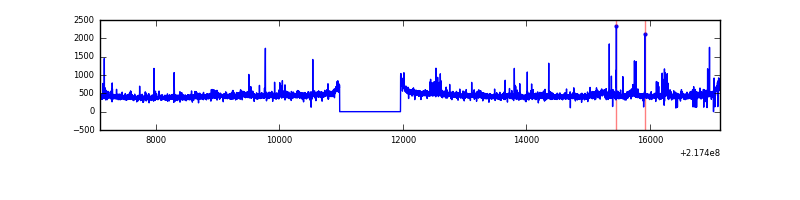 |
Top three noisy pixels from each quadrant. If the there are fewer than three noisy pixels in the level2.evt file, extra rows are filled as -1
| Pixel properties | Quadrant properties | ||||||
|---|---|---|---|---|---|---|---|
| Quadrant | DetID | PixID | Counts | Sigma | Mean | Median | Sigma |
| A | 15 | 236 | 77291 | 360.99 | 1038 | 1014 | 211.3 |
| A | 0 | 31 | 44476 | 205.69 | 1038 | 1014 | 211.3 |
| A | 8 | 15 | 29189 | 133.34 | 1038 | 1014 | 211.3 |
| B | 15 | 35 | 66866 | 332.71 | 1043 | 1018 | 197.9 |
| B | 0 | 219 | 42463 | 209.41 | 1043 | 1018 | 197.9 |
| B | 0 | 214 | 27725 | 134.94 | 1043 | 1018 | 197.9 |
| C | 1 | 16 | 12127 | 48.03 | 1007 | 1015 | 231.4 |
| C | 13 | 61 | 7862 | 29.59 | 1007 | 1015 | 231.4 |
| C | 9 | 54 | 3092 | 8.98 | 1007 | 1015 | 231.4 |
| D | 2 | 63 | 141297 | 569.52 | 1012 | 980 | 246.4 |
| D | 2 | 136 | 30713 | 120.68 | 1012 | 980 | 246.4 |
| D | 14 | 173 | 21599 | 83.69 | 1012 | 980 | 246.4 |
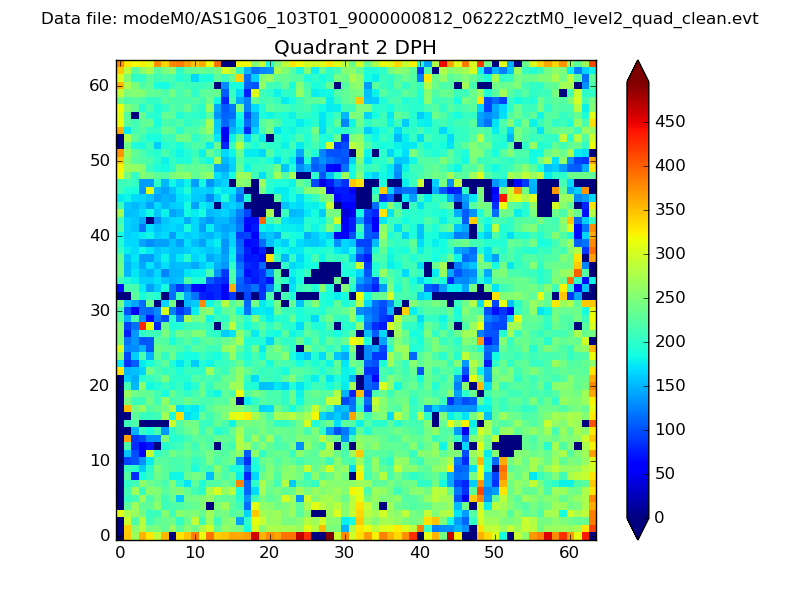
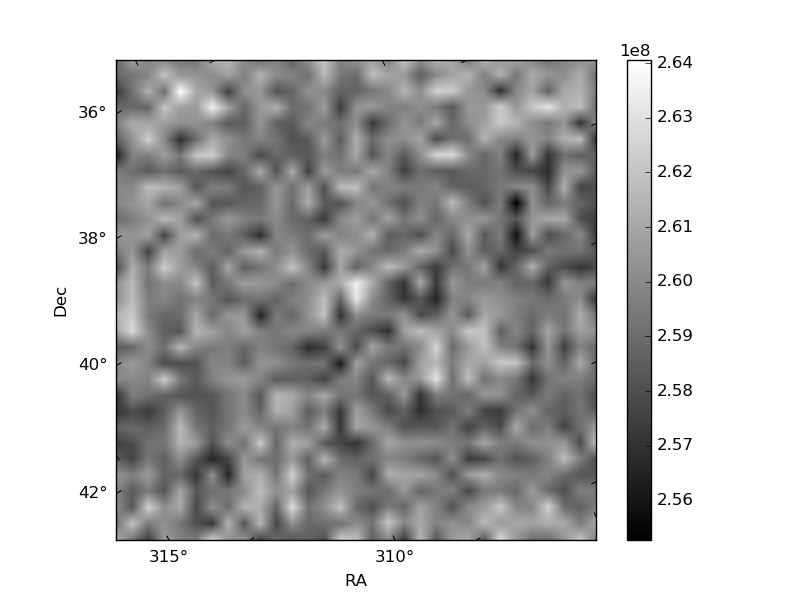
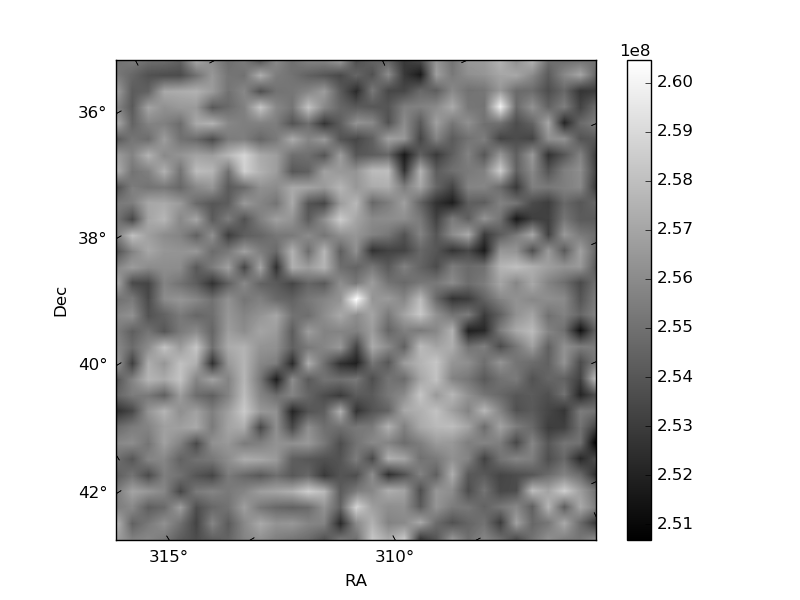
Histogram calculated using DETX and DETY for each event in the final _common_clean file
| Quadrant A | 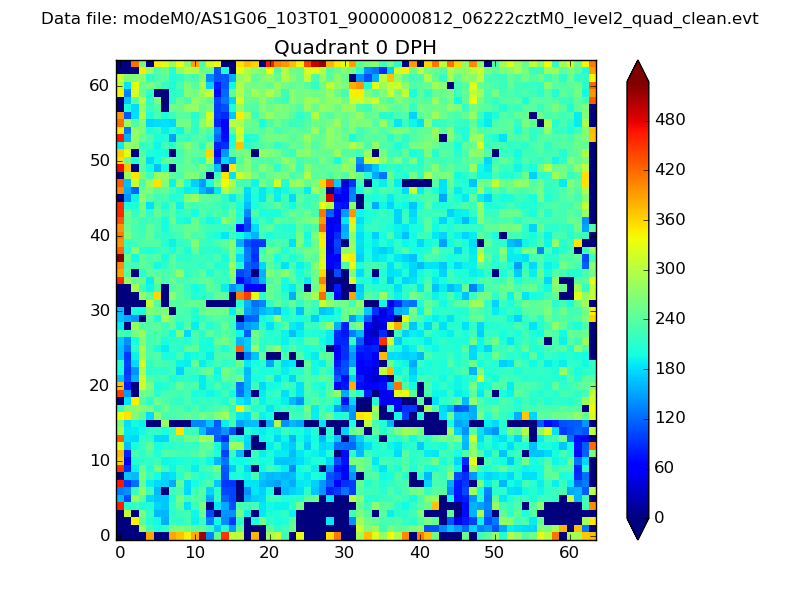 |
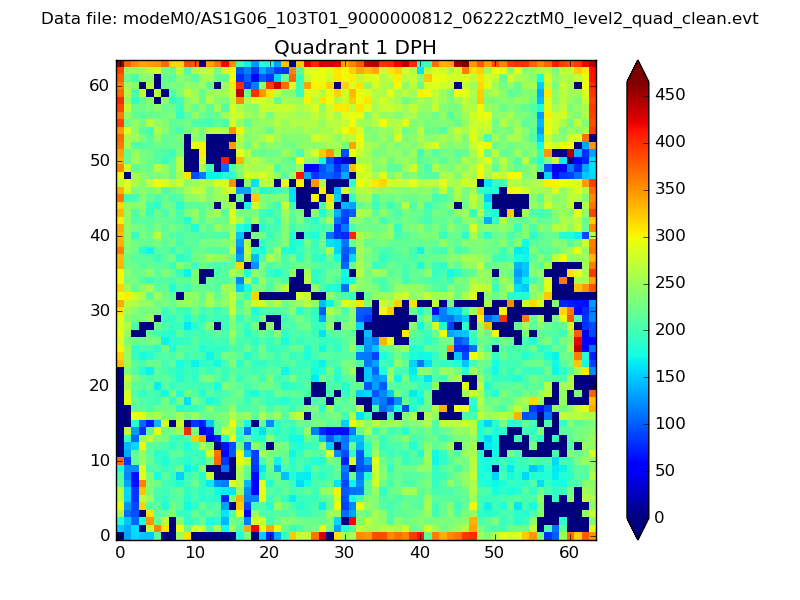 |
Quadrant B |
|---|---|---|---|
| Quadrant D | 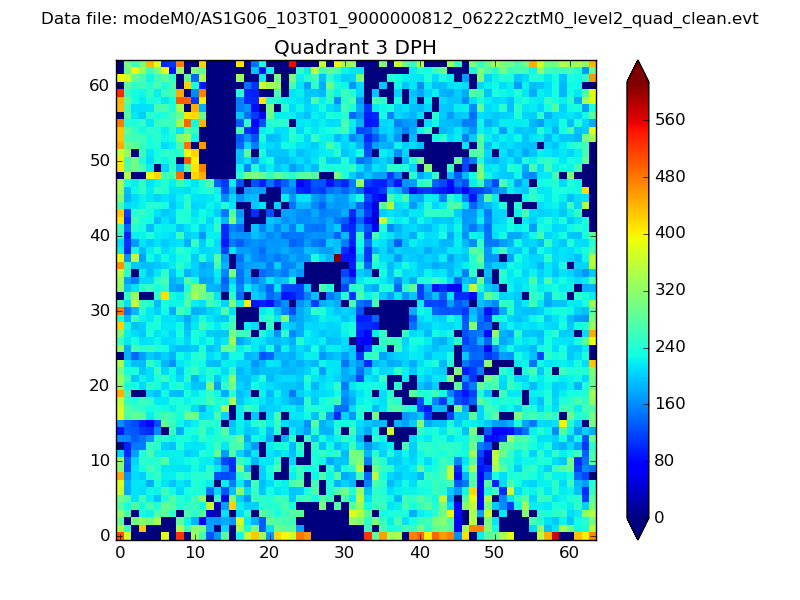 |
 |
Quadrant C |
| Plot type | Count rate plots | Images |
|---|---|---|
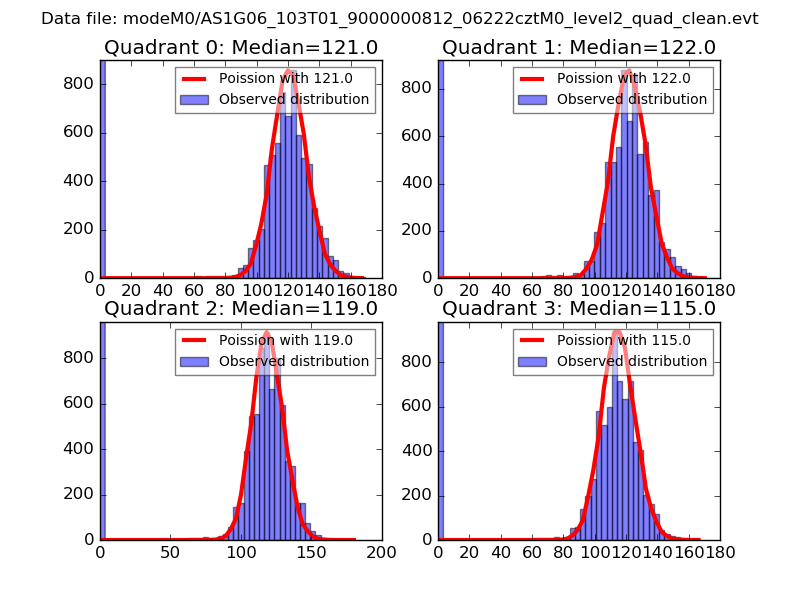
| Comparison with Poisson distribution Blue bars denote a histogram of data divided into 1 sec bins. Red curve is a Poisson curve with rate = median count rate of data. |
 |
 |
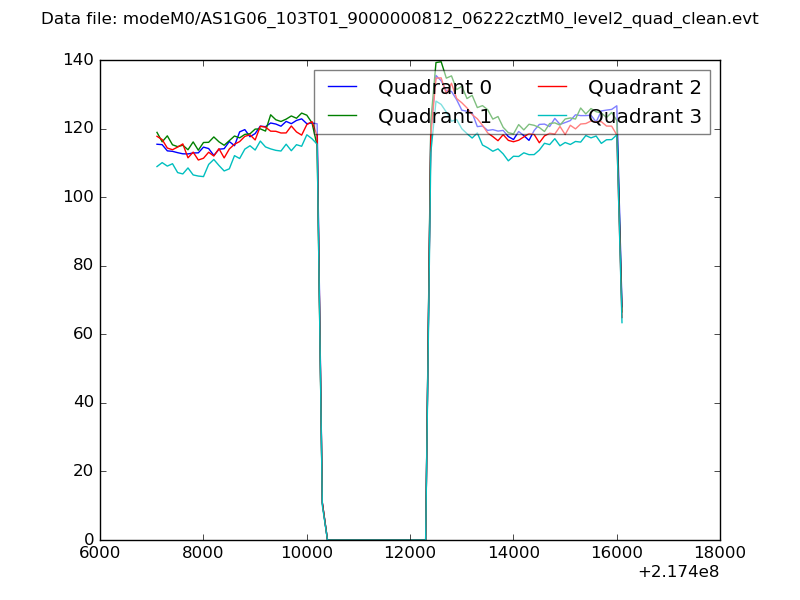
| Quadrant-wise count rates Data is divided into 100 sec bins |
 |
|
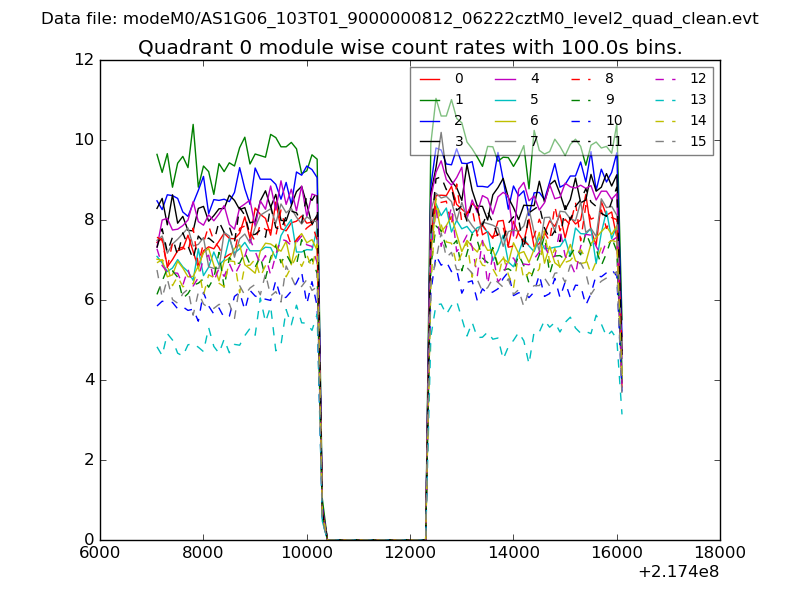
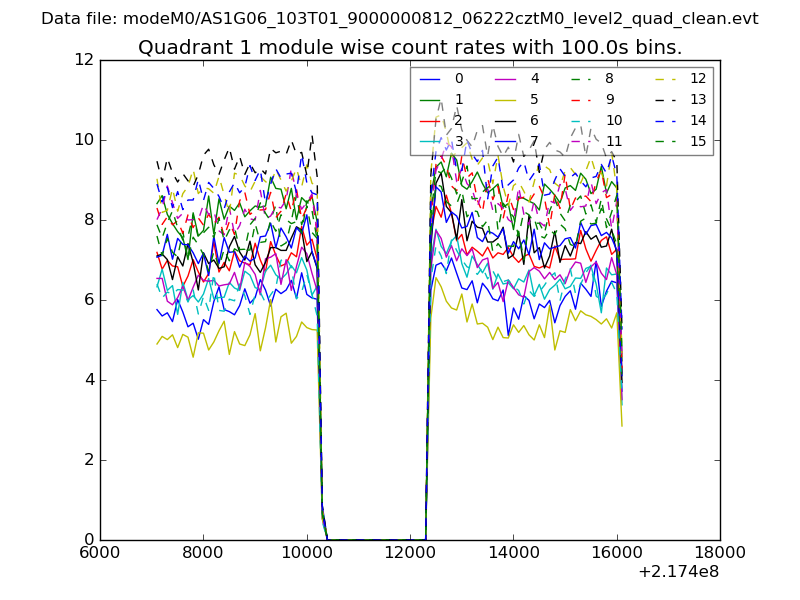
| Module-wise count rates for Quadrant A Data is divided into 100 sec bins |
 |
 |
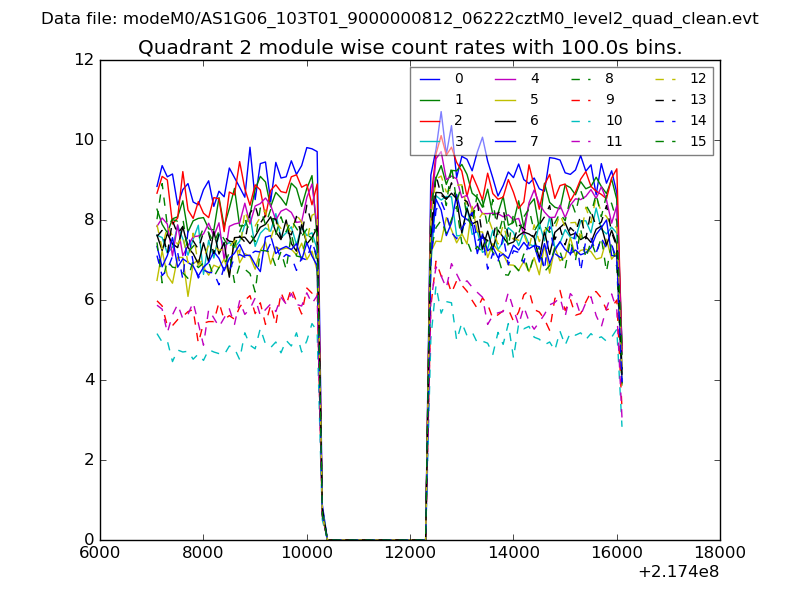
| Module-wise count rates for Quadrant B Data is divided into 100 sec bins |
 |
 |
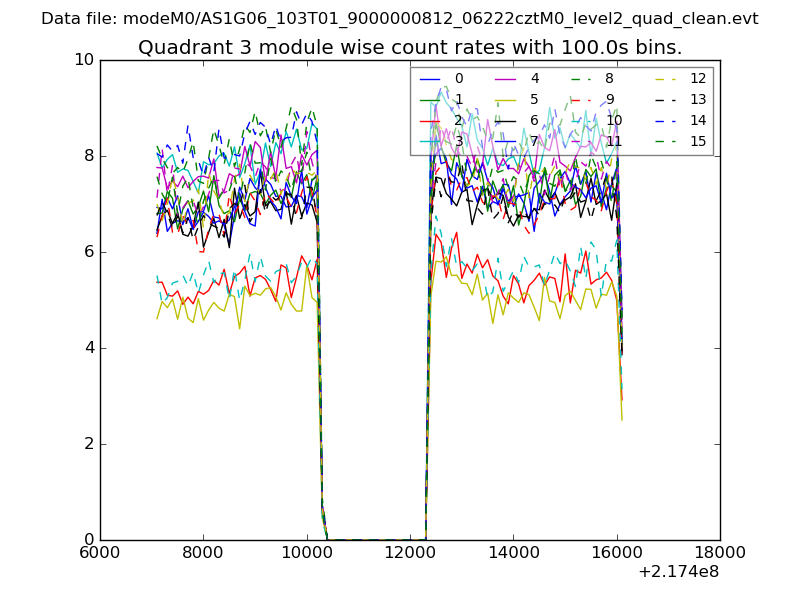
| Module-wise count rates for Quadrant C Data is divided into 100 sec bins |
 |
 |
| Module-wise count rates for Quadrant D Data is divided into 100 sec bins |
 |
 |
| Parameter | Plot |
|---|---|
| CZT HV Monitor | 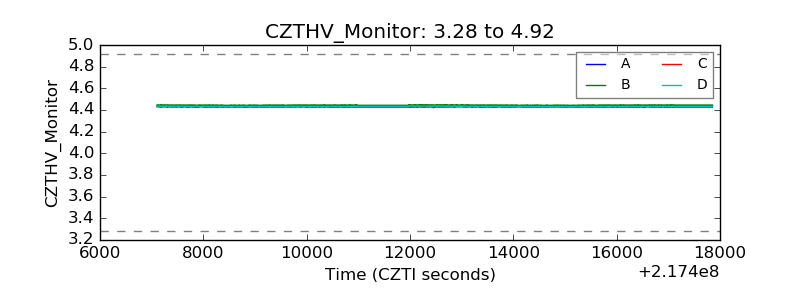 |
| D_VDD | 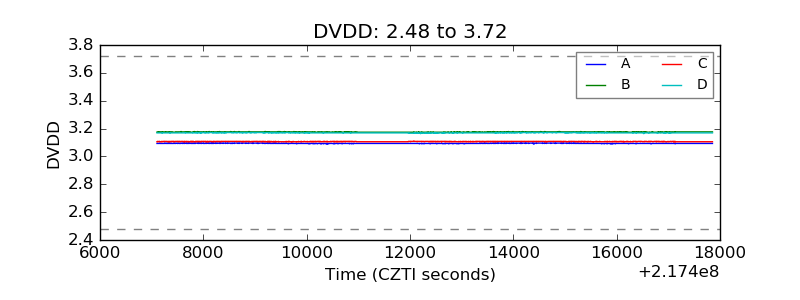 |
| Temperature 1 | 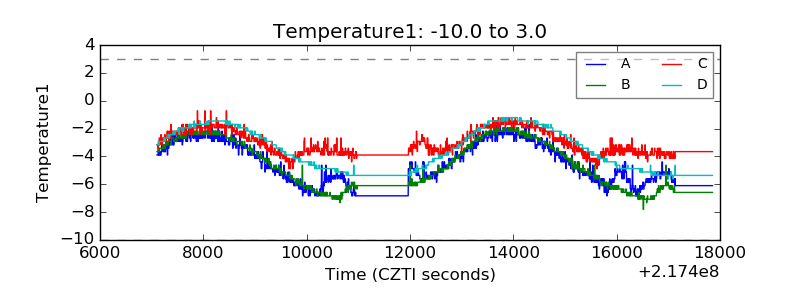 |
| Veto HV Monitor | 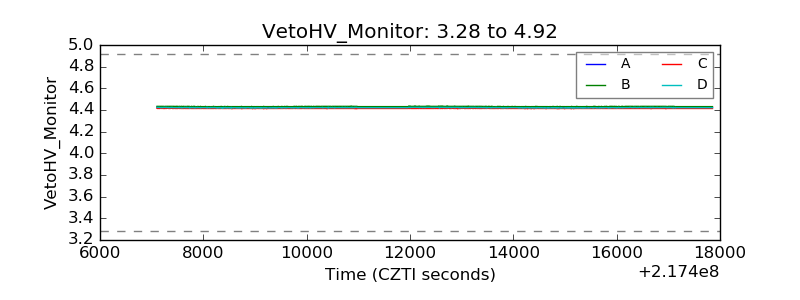 |
| Veto LLD | 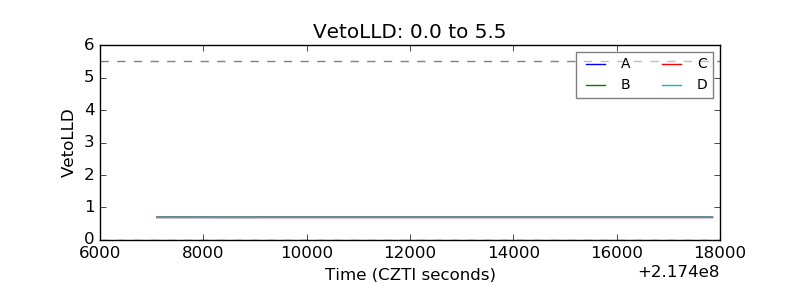 |
| Alpha Counter | 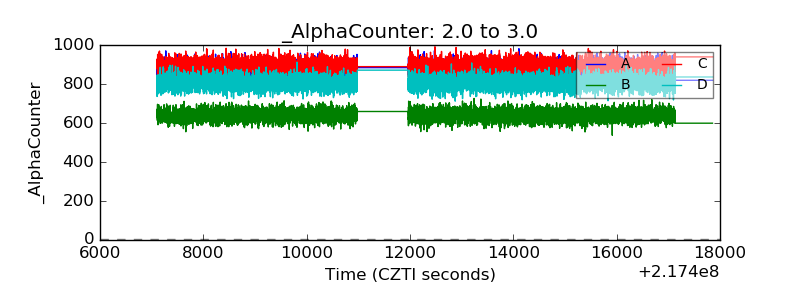 |
| _CPM_Rate | 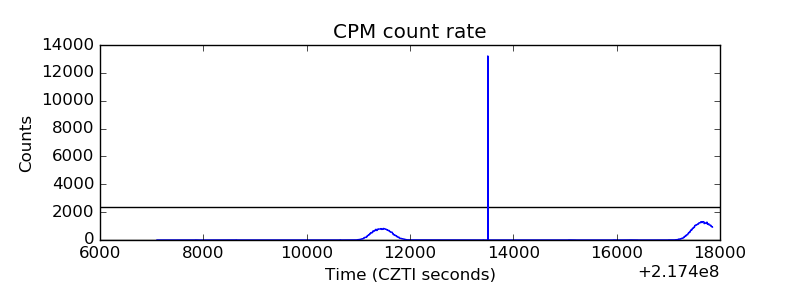 |
| CZT Counter | 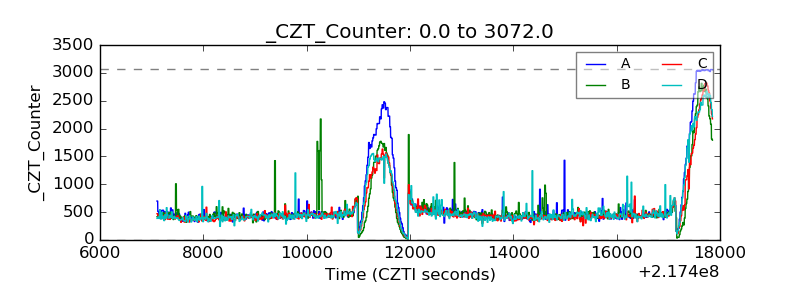 |
| +2.5 Volts monitor |  |
| +5 Volts monitor |  |
| _ROLL_ROT | 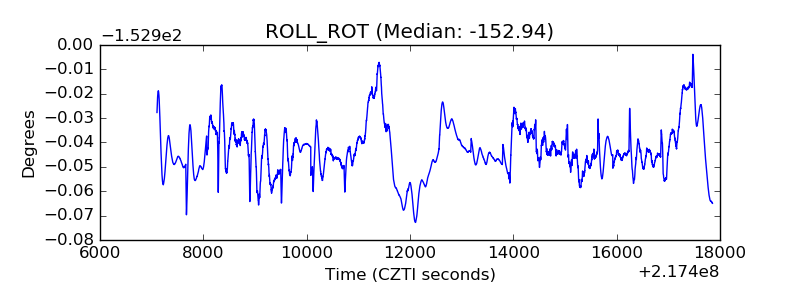 |
| _Roll_DEC | 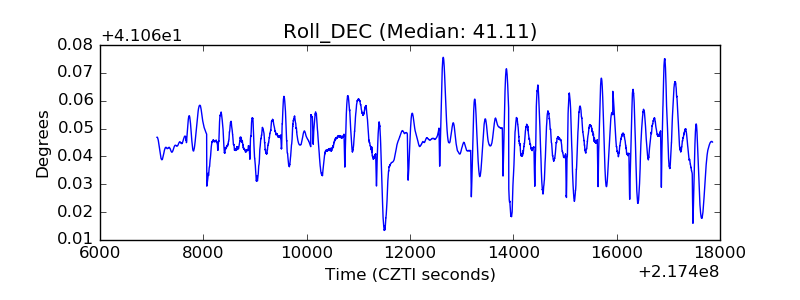 |
| _Roll_RA | 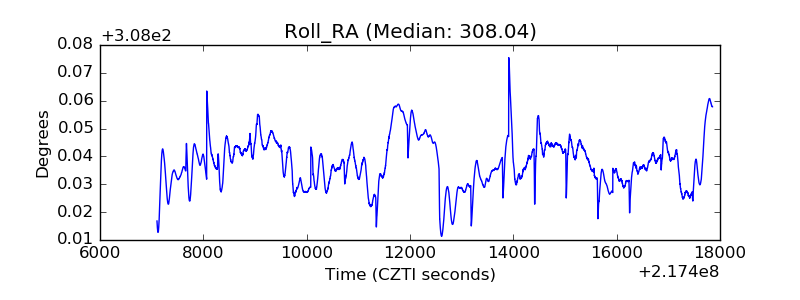 |
| Veto Counter |  |