| Param | Original file | Final file |
|---|---|---|
| Filename | modeM0/AS1G06_168T05_9000000810cztM0_level2.fits | modeM0/AS1G06_168T05_9000000810cztM0_level2_quad_clean.evt |
| Size (bytes) | 122,235,840 | 105,344,640 |
| Size | 116.6 MB | 100.5 MB |
| Events in quadrant A | 723,040 | 585,845 |
| Events in quadrant B | 698,798 | 574,646 |
| Events in quadrant C | 718,244 | 564,827 |
| Events in quadrant D | 619,624 | 521,757 |
| Mode M0 | |||
|---|---|---|---|
| Quadrant | BADHDUFLAG | Total packets | Discarded packets |
| A | 0 | 27650 | 0 |
| B | 0 | 30889 | 0 |
| C | 0 | 27668 | 0 |
| D | 0 | 29887 | 0 |
| Mode M9 | |||
|---|---|---|---|
| Quadrant | BADHDUFLAG | Total packets | Discarded packets |
| A | 0 | 10 | 0 |
| B | 0 | 10 | 0 |
| C | 0 | 10 | 0 |
| D | 0 | 10 | 0 |
| Mode SS | |||
|---|---|---|---|
| Quadrant | BADHDUFLAG | Total packets | Discarded packets |
| A | 0 | 278 | 0 |
| B | 0 | 278 | 0 |
| C | 0 | 278 | 0 |
| D | 0 | 278 | 0 |
| Quadrant | Total seconds | Saturated seconds | Saturation percentage |
|---|---|---|---|
| A | 13638 | 66 | 0.483942% |
| B | 13638 | 277 | 2.031090% |
| C | 13638 | 60 | 0.439947% |
| D | 13638 | 94 | 0.689251% |
Noise dominated data is calculated using 1-second bins in cleaned event files. If a bin has >2000 counts, and if more than 50% of those come from <1% of pixels, then it is considered to be noise-dominated and hence unusable.
| Quadrant | # 1 sec bins | Bins with >0 counts | Bins with >2000 counts | High rate bins dominated by noise | Noise dominated (total time) | Noise dominated (detector-on time) | Marked lightcurve |
|---|---|---|---|---|---|---|---|
| A | 14688 | 13638 | 0 | 0 | 0.00% | 0.00% |  |
| B | 14688 | 13635 | 0 | 0 | 0.00% | 0.00% |  |
| C | 14688 | 13638 | 0 | 0 | 0.00% | 0.00% | 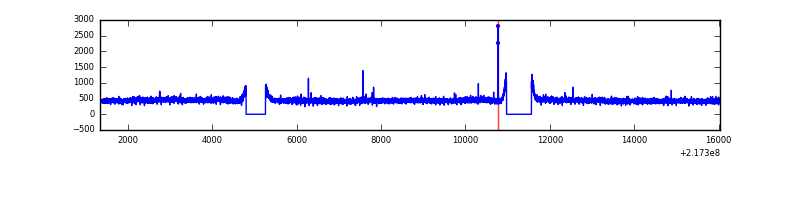 |
| D | 14688 | 13637 | 0 | 0 | 0.00% | 0.00% | 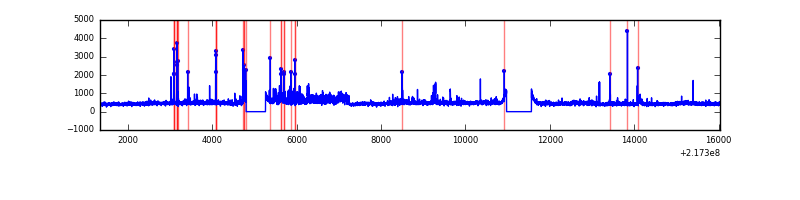 |
Top three noisy pixels from each quadrant. If the there are fewer than three noisy pixels in the level2.evt file, extra rows are filled as -1
| Pixel properties | Quadrant properties | ||||||
|---|---|---|---|---|---|---|---|
| Quadrant | DetID | PixID | Counts | Sigma | Mean | Median | Sigma |
| A | 14 | 188 | 721 | 10.85 | 187 | 174 | 50.4 |
| A | 0 | 29 | 716 | 10.75 | 187 | 174 | 50.4 |
| A | 14 | 204 | 581 | 8.07 | 187 | 174 | 50.4 |
| B | 2 | 9 | 624 | 11.46 | 183 | 173 | 39.4 |
| B | 14 | 254 | 506 | 8.46 | 183 | 173 | 39.4 |
| B | 3 | 17 | 486 | 7.95 | 183 | 173 | 39.4 |
| C | 12 | 241 | 546 | 7.14 | 189 | 175 | 52.0 |
| C | 1 | 80 | 510 | 6.45 | 189 | 175 | 52.0 |
| C | 3 | 158 | 509 | 6.43 | 189 | 175 | 52.0 |
| D | 3 | 14 | 462 | 6.1 | 176 | 160 | 49.5 |
| D | 3 | 30 | 453 | 5.92 | 176 | 160 | 49.5 |
| D | 6 | 231 | 435 | 5.56 | 176 | 160 | 49.5 |
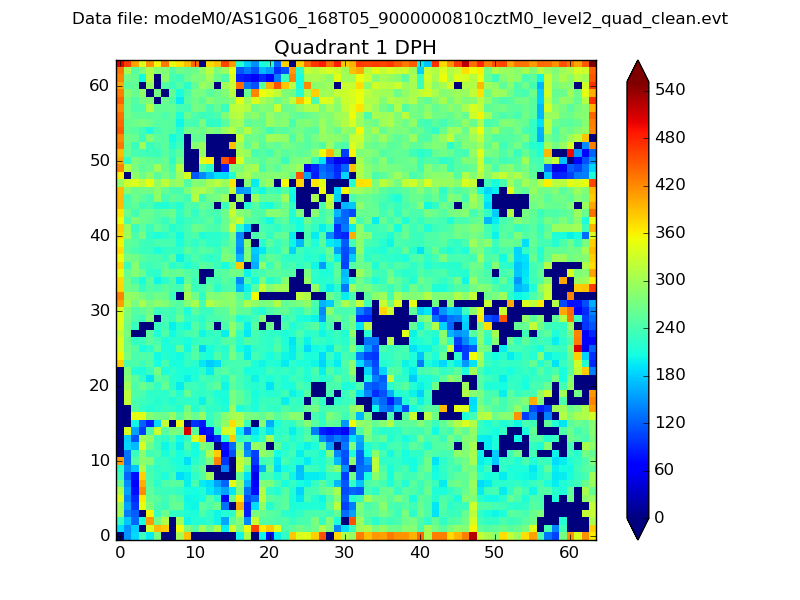
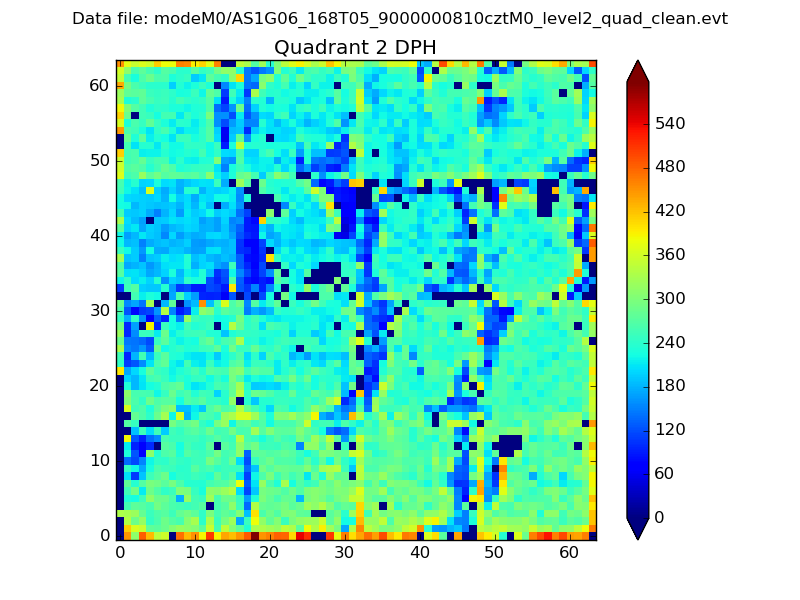
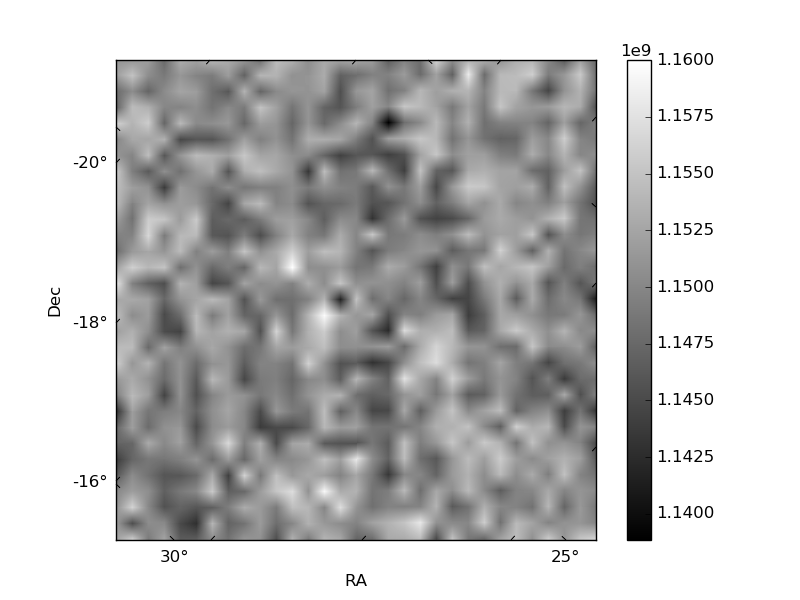
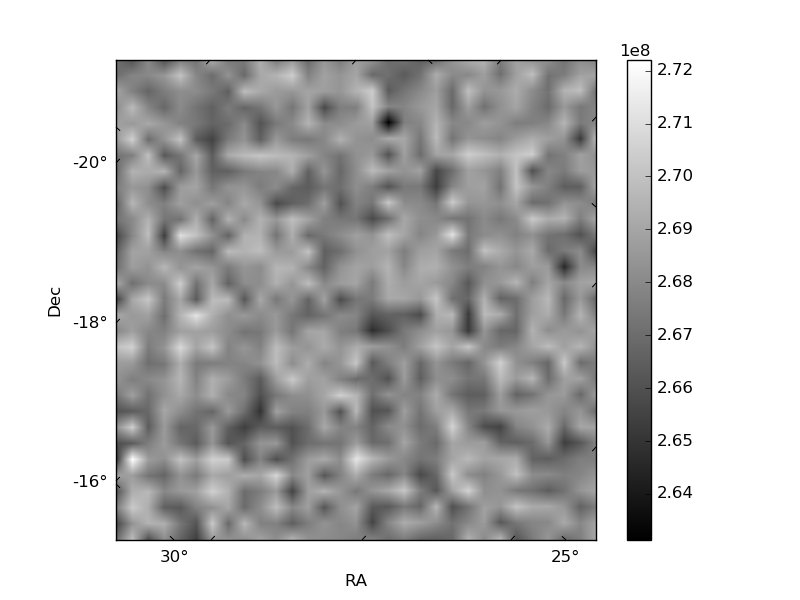
Histogram calculated using DETX and DETY for each event in the final _common_clean file
| Quadrant A |  |
 |
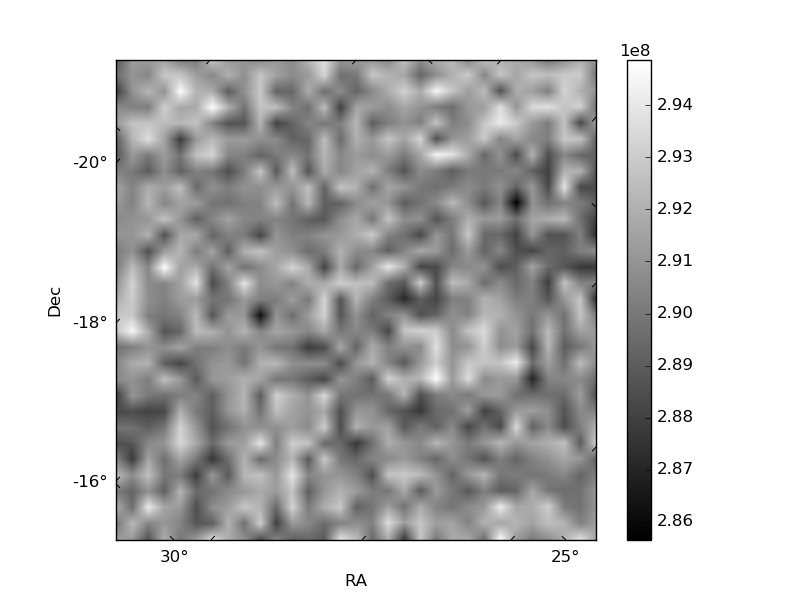
Quadrant B |
|---|---|---|---|
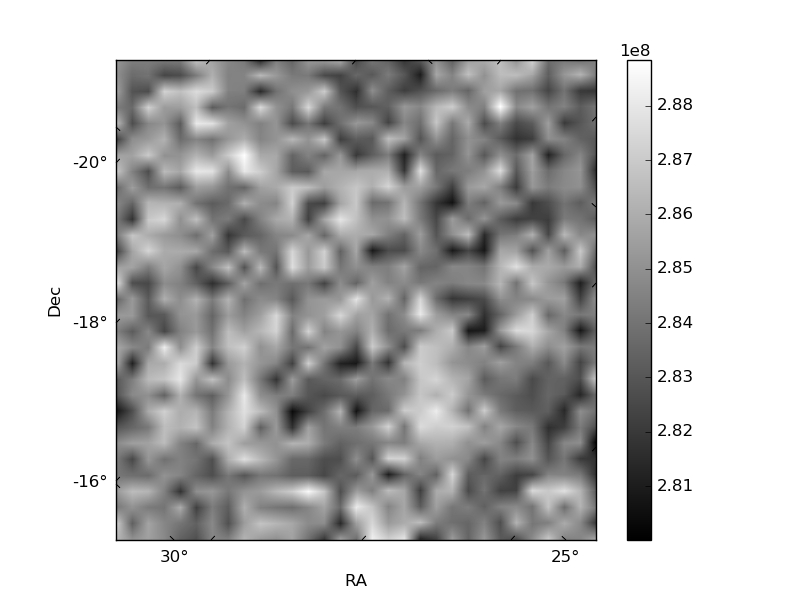
| Quadrant D |  |
 |
Quadrant C |
| Plot type | Count rate plots | Images |
|---|---|---|
| Comparison with Poisson distribution Blue bars denote a histogram of data divided into 1 sec bins. Red curve is a Poisson curve with rate = median count rate of data. |
 |
 |
| Quadrant-wise count rates Data is divided into 100 sec bins |
 |
|
| Module-wise count rates for Quadrant A Data is divided into 100 sec bins |
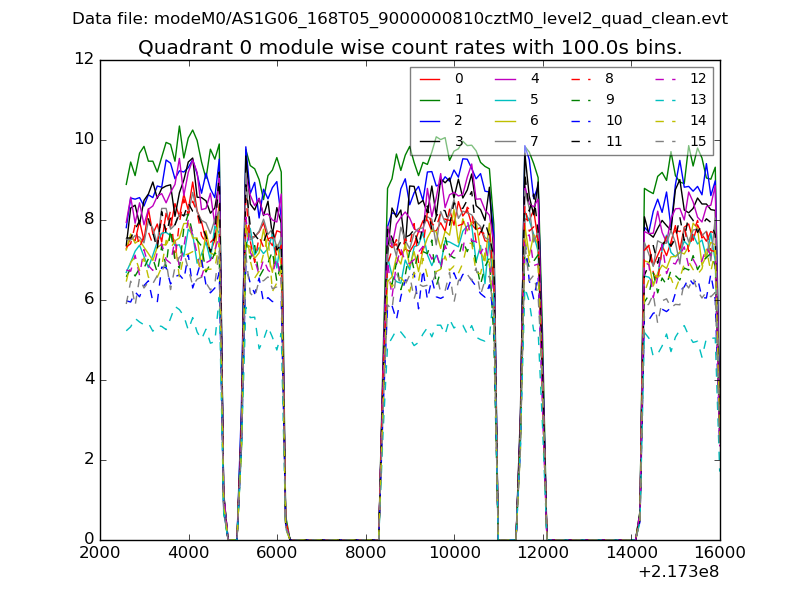 |
 |
| Module-wise count rates for Quadrant B Data is divided into 100 sec bins |
 |
 |
| Module-wise count rates for Quadrant C Data is divided into 100 sec bins |
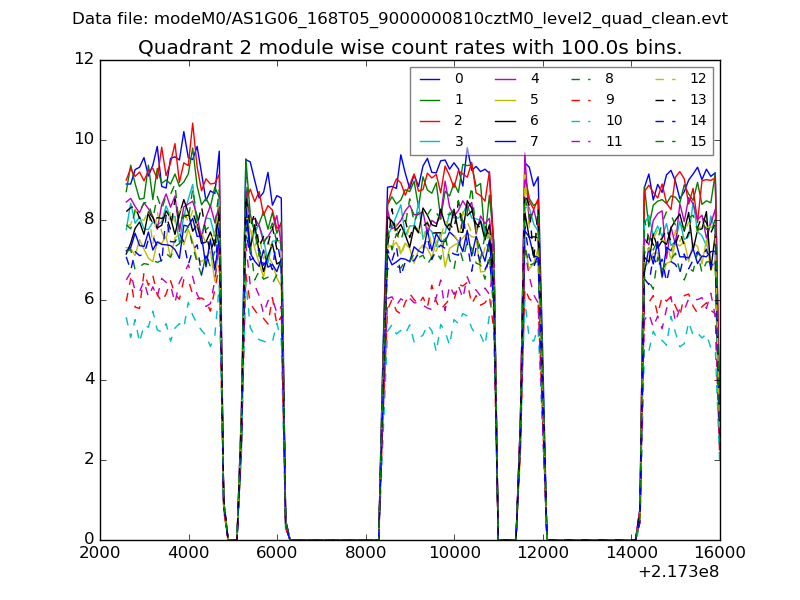 |
 |
| Module-wise count rates for Quadrant D Data is divided into 100 sec bins |
 |
 |
| Parameter | Plot |
|---|---|
| CZT HV Monitor |  |
| D_VDD | 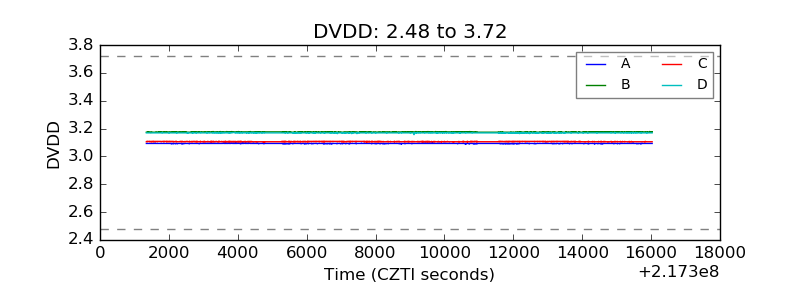 |
| Temperature 1 |  |
| Veto HV Monitor |  |
| Veto LLD |  |
| Alpha Counter | 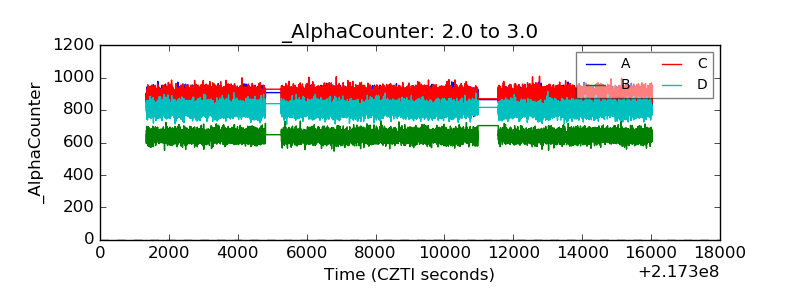 |
| _CPM_Rate |  |
| CZT Counter | 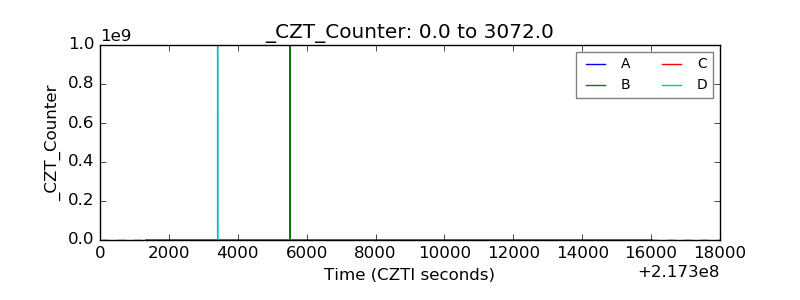 |
| +2.5 Volts monitor |  |
| +5 Volts monitor | 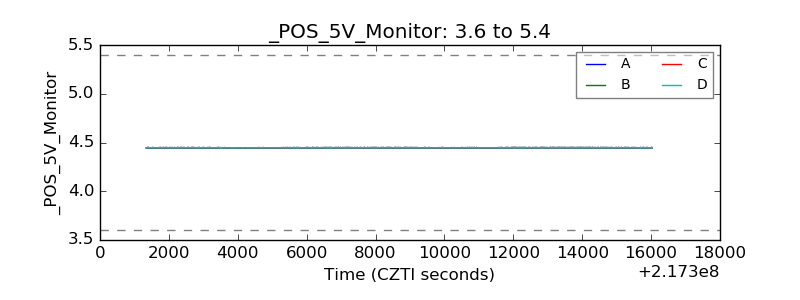 |
| _ROLL_ROT | 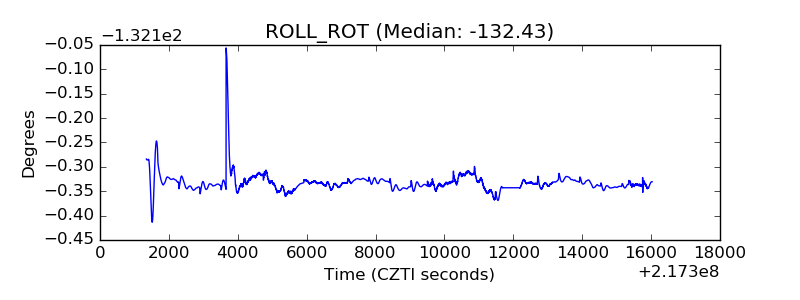 |
| _Roll_DEC |  |
| _Roll_RA |  |
| Veto Counter |  |