| Param | Original file | Final file |
|---|---|---|
| Filename | modeM0/AS1A02_046T01_9000000814cztM0_level2.fits | modeM0/AS1A02_046T01_9000000814cztM0_level2_quad_clean.evt |
| Size (bytes) | 243,881,280 | 289,333,440 |
| Size | 232.6 MB | 275.9 MB |
| Events in quadrant A | 1,465,951 | 1,817,232 |
| Events in quadrant B | 1,425,388 | 1,807,560 |
| Events in quadrant C | 1,470,301 | 1,753,369 |
| Events in quadrant D | 1,270,342 | 1,631,128 |
| Mode M9 | |||
|---|---|---|---|
| Quadrant | BADHDUFLAG | Total packets | Discarded packets |
| A | 0 | 53 | 0 |
| B | 0 | 49 | 0 |
| C | 0 | 51 | 0 |
| D | 0 | 50 | 0 |
| Mode M0 | |||
|---|---|---|---|
| Quadrant | BADHDUFLAG | Total packets | Discarded packets |
| A | 0 | 60061 | 0 |
| B | 0 | 54257 | 0 |
| C | 0 | 52009 | 0 |
| D | 0 | 56575 | 0 |
| Mode SS | |||
|---|---|---|---|
| Quadrant | BADHDUFLAG | Total packets | Discarded packets |
| A | 0 | 524 | 0 |
| B | 0 | 528 | 0 |
| C | 0 | 526 | 0 |
| D | 0 | 528 | 0 |
| Quadrant | Total seconds | Saturated seconds | Saturation percentage |
|---|---|---|---|
| A | 25453 | 512 | 2.011551% |
| B | 25461 | 396 | 1.555320% |
| C | 25459 | 254 | 0.997683% |
| D | 25462 | 343 | 1.347105% |
Noise dominated data is calculated using 1-second bins in cleaned event files. If a bin has >2000 counts, and if more than 50% of those come from <1% of pixels, then it is considered to be noise-dominated and hence unusable.
| Quadrant | # 1 sec bins | Bins with >0 counts | Bins with >2000 counts | High rate bins dominated by noise | Noise dominated (total time) | Noise dominated (detector-on time) | Marked lightcurve |
|---|---|---|---|---|---|---|---|
| A | 32677 | 25878 | 0 | 0 | 0.00% | 0.00% |  |
| B | 32677 | 25883 | 0 | 0 | 0.00% | 0.00% |  |
| C | 32677 | 25903 | 0 | 0 | 0.00% | 0.00% |  |
| D | 32677 | 25886 | 0 | 0 | 0.00% | 0.00% |  |
Top three noisy pixels from each quadrant. If the there are fewer than three noisy pixels in the level2.evt file, extra rows are filled as -1
| Pixel properties | Quadrant properties | ||||||
|---|---|---|---|---|---|---|---|
| Quadrant | DetID | PixID | Counts | Sigma | Mean | Median | Sigma |
| A | 0 | 29 | 1442 | 11.27 | 381 | 359 | 96.1 |
| A | 7 | 110 | 1294 | 9.73 | 381 | 359 | 96.1 |
| A | 9 | 19 | 1106 | 7.77 | 381 | 359 | 96.1 |
| B | 2 | 9 | 1190 | 10.93 | 376 | 361 | 75.9 |
| B | 5 | 128 | 983 | 8.2 | 376 | 361 | 75.9 |
| B | 12 | 226 | 966 | 7.98 | 376 | 361 | 75.9 |
| C | 1 | 81 | 1125 | 7.42 | 388 | 362 | 102.9 |
| C | 1 | 80 | 1110 | 7.27 | 388 | 362 | 102.9 |
| C | 1 | 65 | 1040 | 6.59 | 388 | 362 | 102.9 |
| D | 3 | 14 | 1015 | 7.06 | 362 | 331 | 96.9 |
| D | 11 | 82 | 1008 | 6.99 | 362 | 331 | 96.9 |
| D | 6 | 231 | 943 | 6.31 | 362 | 331 | 96.9 |
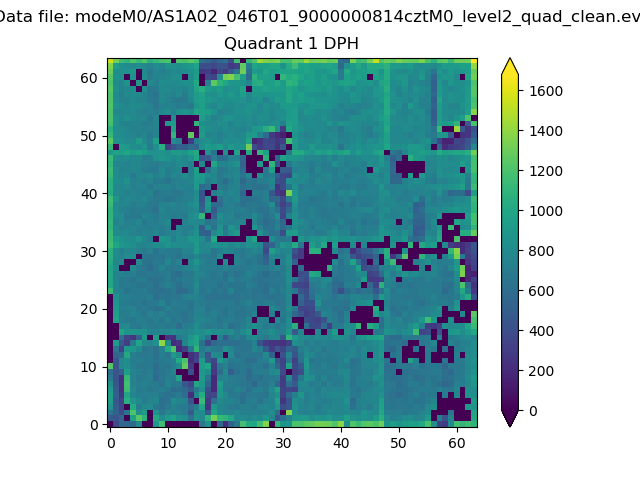
Histogram calculated using DETX and DETY for each event in the final _common_clean file
| Quadrant A |  |
 |
Quadrant B |
|---|---|---|---|
| Quadrant D | 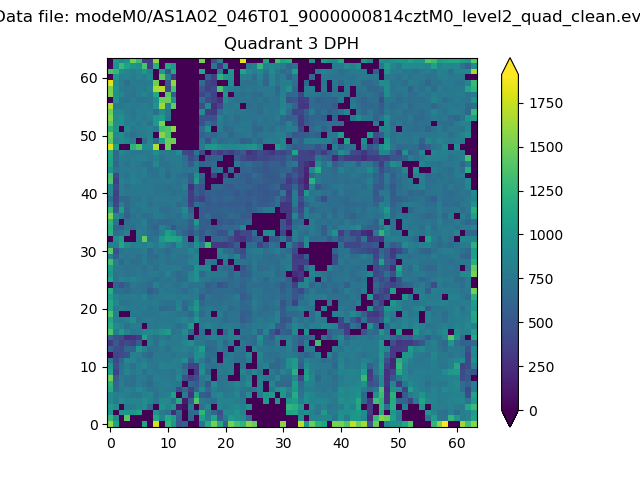 |
 |
Quadrant C |
| Plot type | Count rate plots | Images |
|---|---|---|
| Comparison with Poisson distribution Blue bars denote a histogram of data divided into 1 sec bins. Red curve is a Poisson curve with rate = median count rate of data. |
 |
 |
| Quadrant-wise count rates Data is divided into 100 sec bins |
 |
|
| Module-wise count rates for Quadrant A Data is divided into 100 sec bins |
 |
 |
| Module-wise count rates for Quadrant B Data is divided into 100 sec bins |
 |
 |
| Module-wise count rates for Quadrant C Data is divided into 100 sec bins |
 |
 |
| Module-wise count rates for Quadrant D Data is divided into 100 sec bins |
 |
 |
| Parameter | Plot |
|---|---|
| CZT HV Monitor |  |
| D_VDD |  |
| Temperature 1 |  |
| Veto HV Monitor |  |
| Veto LLD | 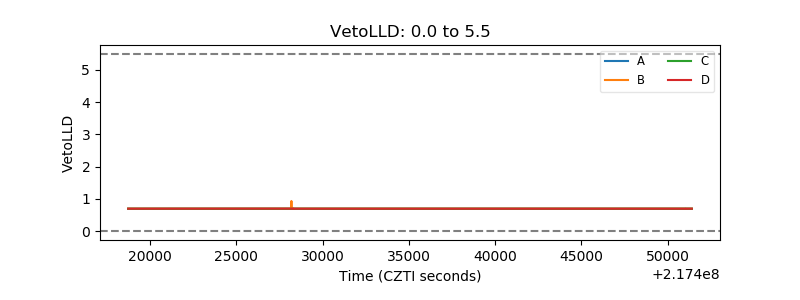 |
| Alpha Counter |  |
| _CPM_Rate |  |
| CZT Counter |  |
| +2.5 Volts monitor |  |
| +5 Volts monitor |  |
| _ROLL_ROT |  |
| _Roll_DEC |  |
| _Roll_RA |  |
| Veto Counter |  |