| Param | Original file | Final file |
|---|---|---|
| Filename | modeM0/AS1A02_046T01_9000000814_06221cztM0_level2.evt | modeM0/AS1A02_046T01_9000000814_06221cztM0_level2_quad_clean.evt |
| Size (bytes) | 59,558,400 | 15,177,600 |
| Size | 56.8 MB | 14.5 MB |
| Events in quadrant A | 458,584 | 98,953 |
| Events in quadrant B | 440,503 | 102,296 |
| Events in quadrant C | 406,045 | 95,766 |
| Events in quadrant D | 434,570 | 92,420 |
| Mode M0 | |||
|---|---|---|---|
| Quadrant | BADHDUFLAG | Total packets | Discarded packets |
| A | 0 | 1888 | 9 |
| B | 0 | 1825 | 2 |
| C | 0 | 1800 | 4 |
| D | 0 | 1867 | 8 |
| Mode SS | |||
|---|---|---|---|
| Quadrant | BADHDUFLAG | Total packets | Discarded packets |
| A | 0 | 18 | 0 |
| B | 0 | 18 | 0 |
| C | 0 | 18 | 2 |
| D | 0 | 18 | 0 |
| Quadrant | Total seconds | Saturated seconds | Saturation percentage |
|---|---|---|---|
| A | 894 | 1 | 0.111857% |
| B | 897 | 0 | 0.000000% |
| C | 896 | 0 | 0.000000% |
| D | 894 | 3 | 0.335570% |
Noise dominated data is calculated using 1-second bins in cleaned event files. If a bin has >2000 counts, and if more than 50% of those come from <1% of pixels, then it is considered to be noise-dominated and hence unusable.
| Quadrant | # 1 sec bins | Bins with >0 counts | Bins with >2000 counts | High rate bins dominated by noise | Noise dominated (total time) | Noise dominated (detector-on time) | Marked lightcurve |
|---|---|---|---|---|---|---|---|
| A | 898 | 898 | 0 | 0 | 0.00% | 0.00% | 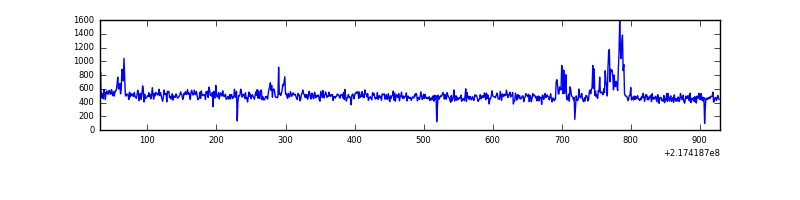 |
| B | 898 | 898 | 0 | 0 | 0.00% | 0.00% | 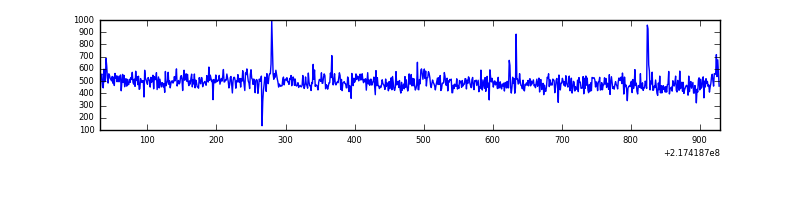 |
| C | 898 | 898 | 0 | 0 | 0.00% | 0.00% | 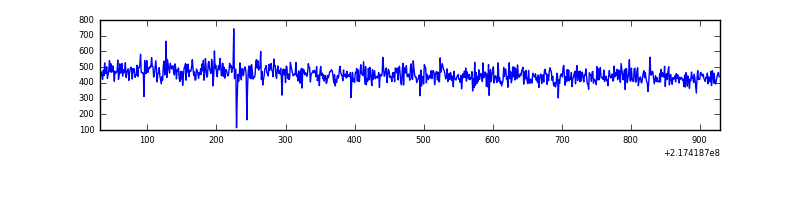 |
| D | 898 | 898 | 1 | 1 | 0.11% | 0.11% | 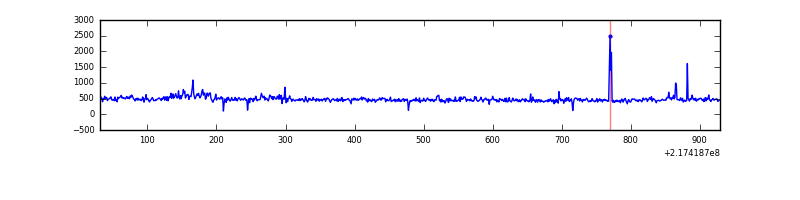 |
Top three noisy pixels from each quadrant. If the there are fewer than three noisy pixels in the level2.evt file, extra rows are filled as -1
| Pixel properties | Quadrant properties | ||||||
|---|---|---|---|---|---|---|---|
| Quadrant | DetID | PixID | Counts | Sigma | Mean | Median | Sigma |
| A | 8 | 15 | 25862 | 1042.95 | 111 | 109 | 24.7 |
| A | 12 | 194 | 1132 | 41.43 | 111 | 109 | 24.7 |
| A | 0 | 226 | 1069 | 38.88 | 111 | 109 | 24.7 |
| B | 4 | 81 | 4455 | 183.72 | 110 | 108 | 23.7 |
| B | 0 | 219 | 4176 | 171.93 | 110 | 108 | 23.7 |
| B | 15 | 204 | 3377 | 138.16 | 110 | 108 | 23.7 |
| C | 1 | 16 | 875 | 30.44 | 103 | 103 | 25.4 |
| C | 13 | 61 | 820 | 28.27 | 103 | 103 | 25.4 |
| C | 8 | 222 | 316 | 8.4 | 103 | 103 | 25.4 |
| D | 2 | 63 | 21204 | 766.98 | 105 | 101 | 27.5 |
| D | 2 | 206 | 7895 | 283.27 | 105 | 101 | 27.5 |
| D | 5 | 97 | 5346 | 190.63 | 105 | 101 | 27.5 |
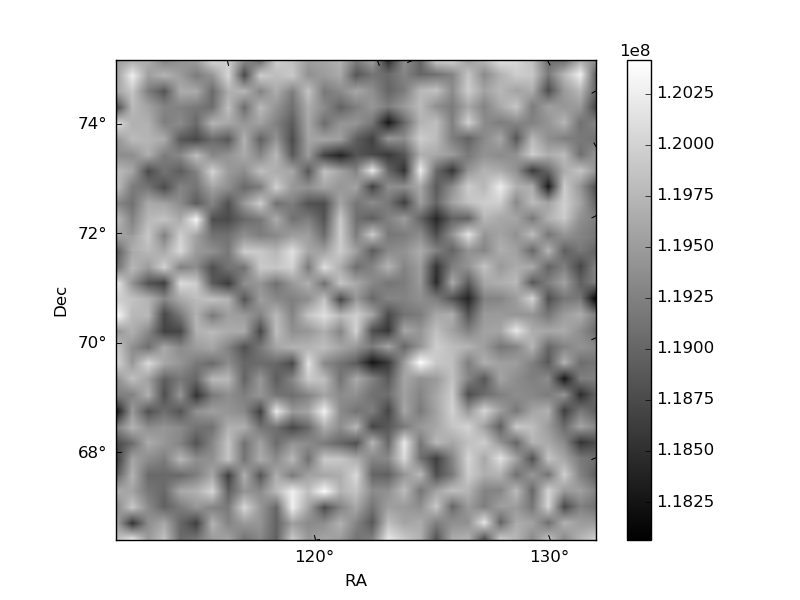
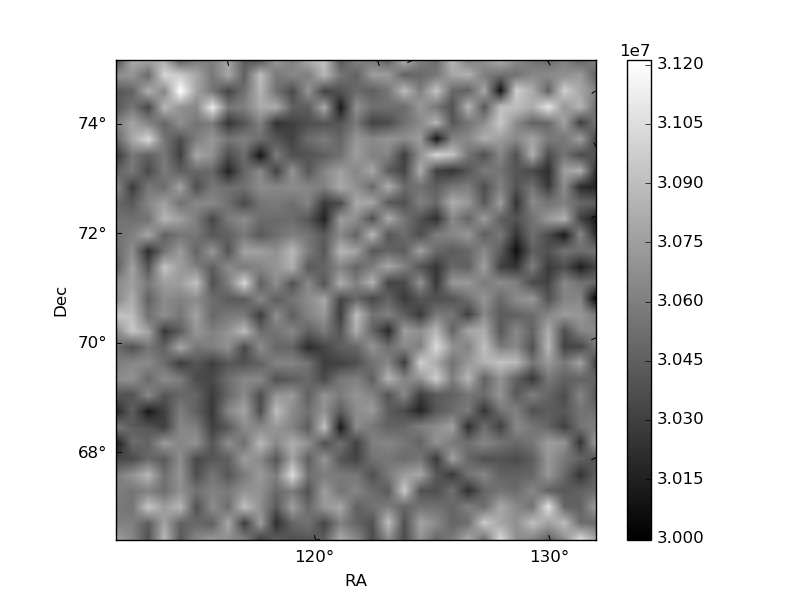
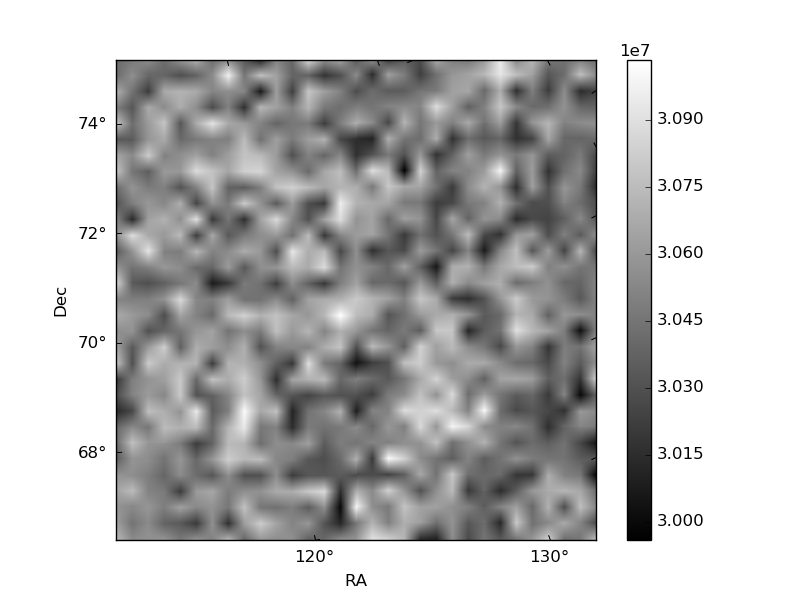
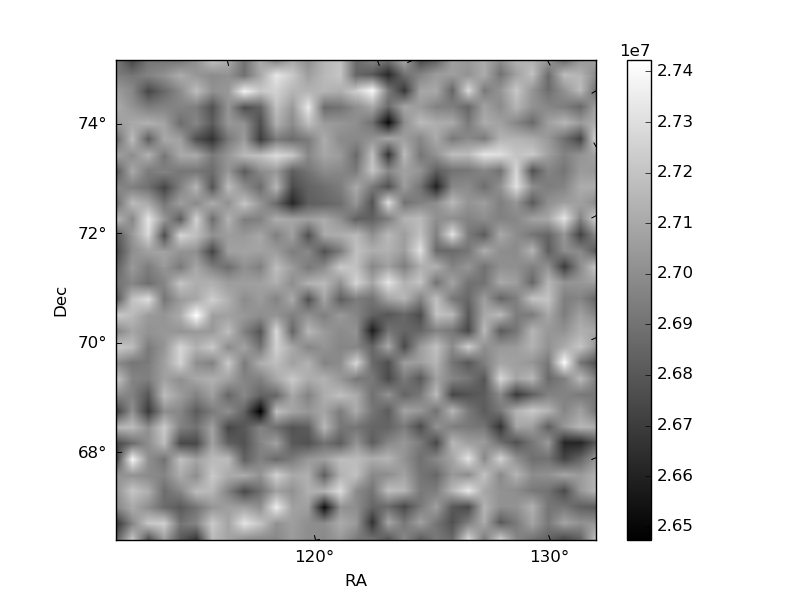
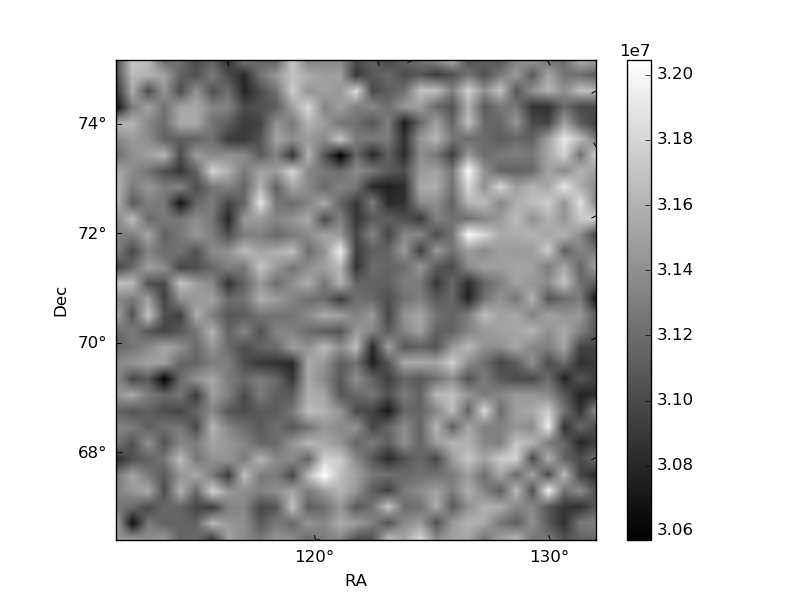
Histogram calculated using DETX and DETY for each event in the final _common_clean file
| Quadrant A | 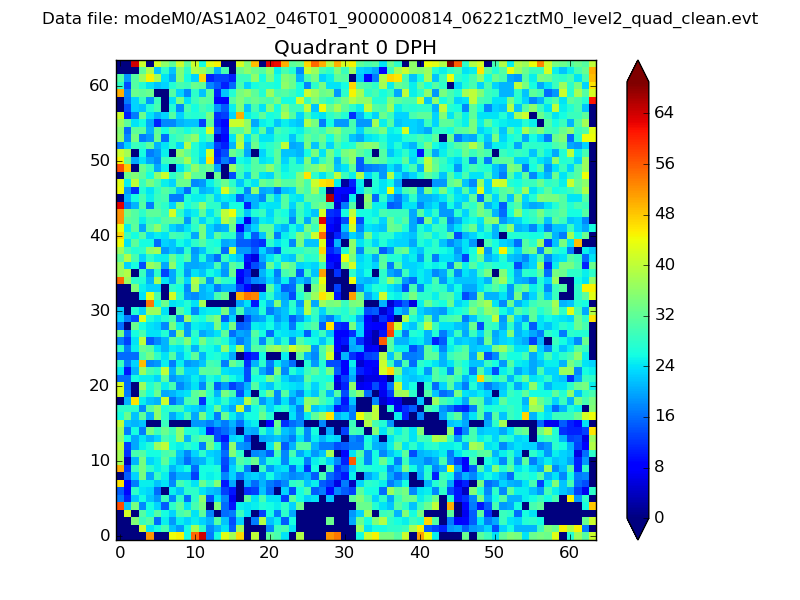 |
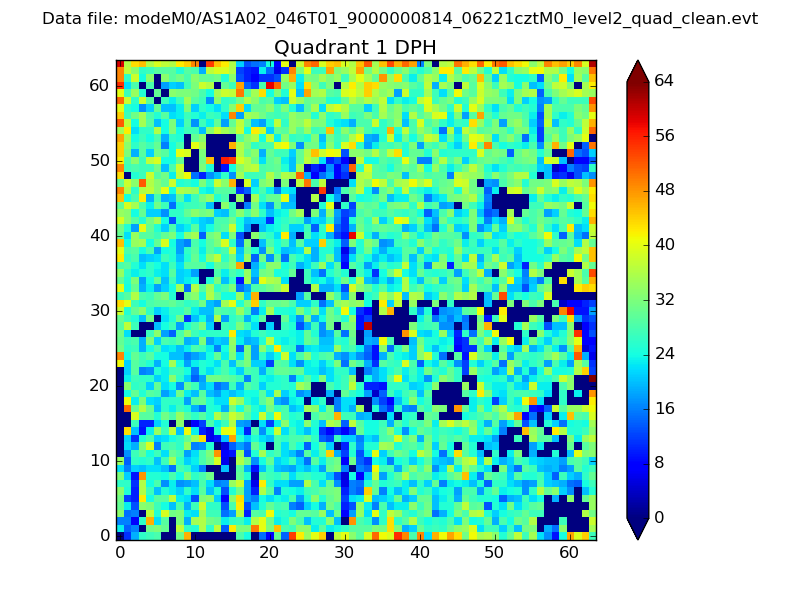 |
Quadrant B |
|---|---|---|---|
| Quadrant D | 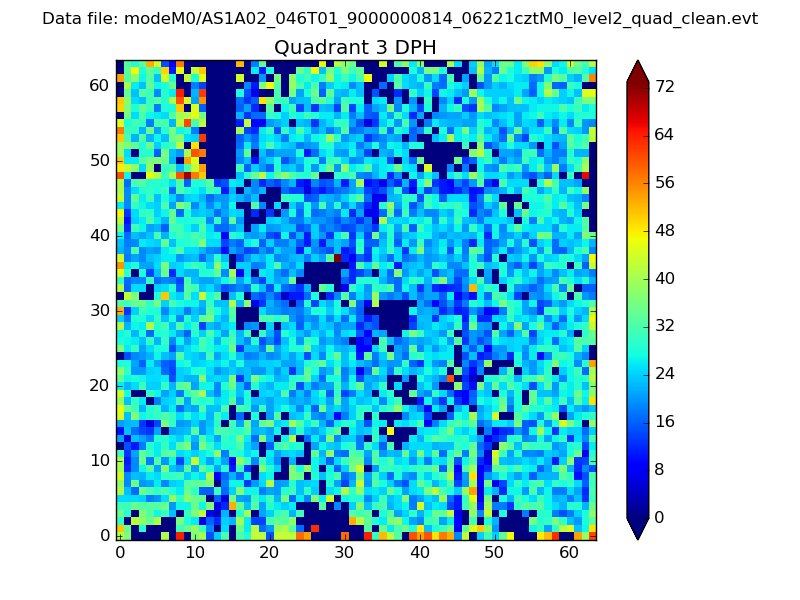 |
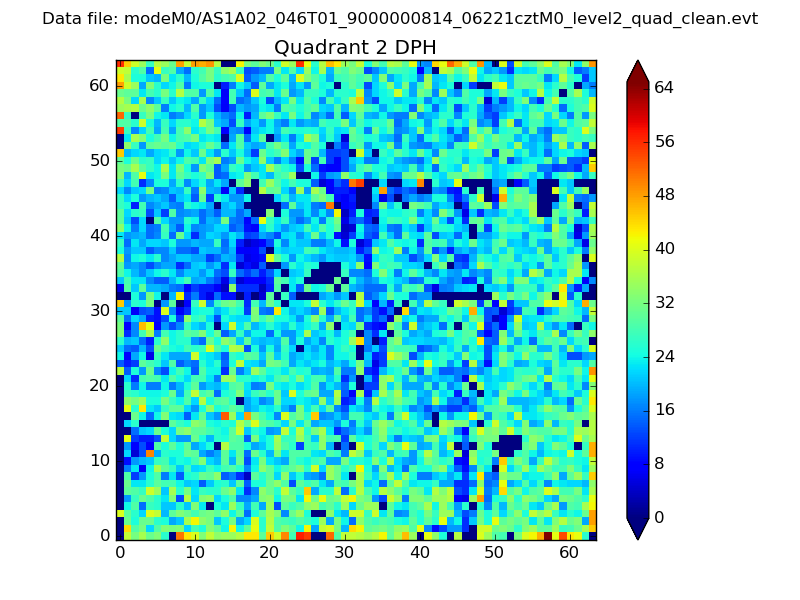 |
Quadrant C |
| Plot type | Count rate plots | Images |
|---|---|---|
| Comparison with Poisson distribution Blue bars denote a histogram of data divided into 1 sec bins. Red curve is a Poisson curve with rate = median count rate of data. |
 |
 |
| Quadrant-wise count rates Data is divided into 100 sec bins |
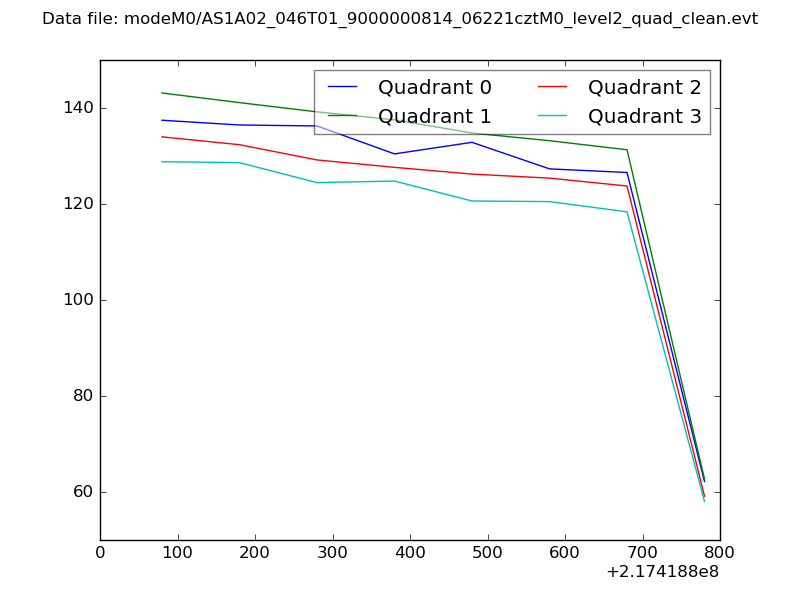 |
|
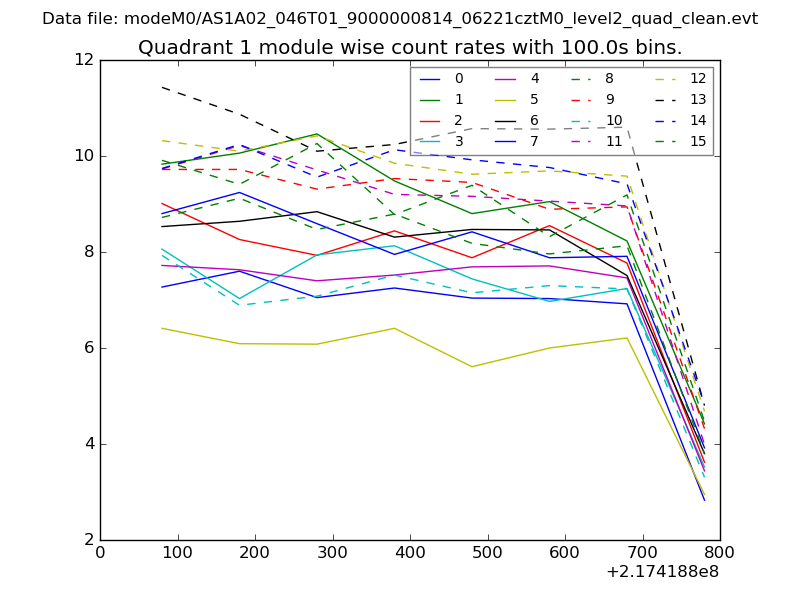
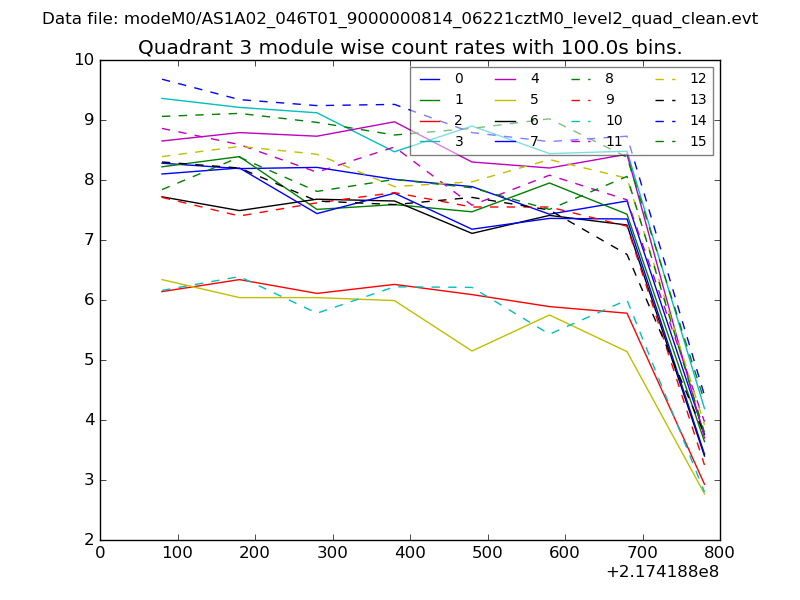
| Module-wise count rates for Quadrant A Data is divided into 100 sec bins |
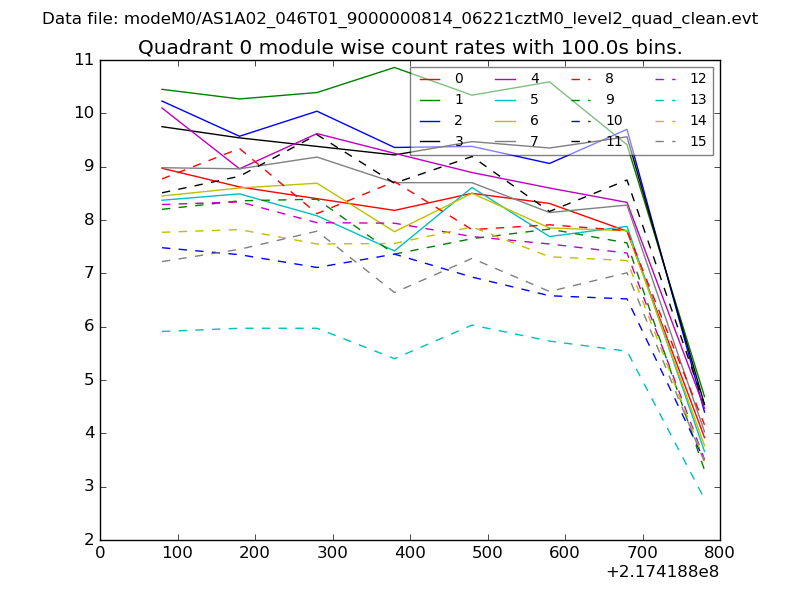 |
 |
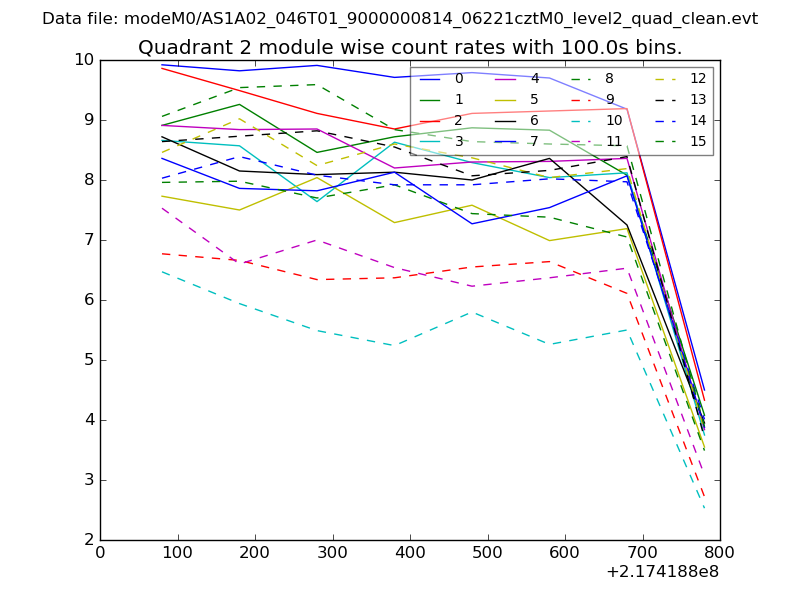
| Module-wise count rates for Quadrant B Data is divided into 100 sec bins |
 |
 |
| Module-wise count rates for Quadrant C Data is divided into 100 sec bins |
 |
 |
| Module-wise count rates for Quadrant D Data is divided into 100 sec bins |
 |
 |
| Parameter | Plot |
|---|---|
| CZT HV Monitor | 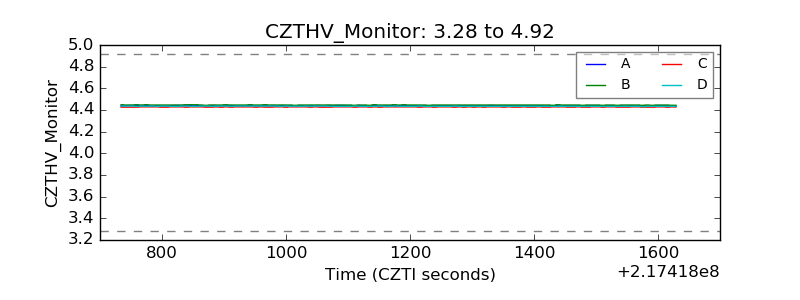 |
| D_VDD | 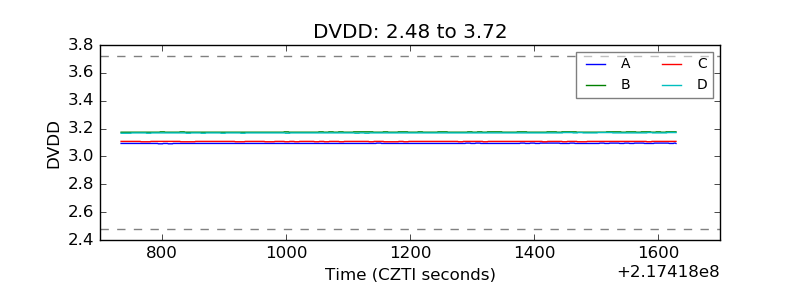 |
| Temperature 1 | 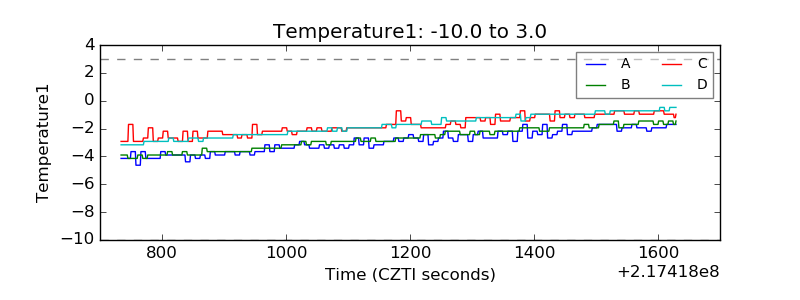 |
| Veto HV Monitor | 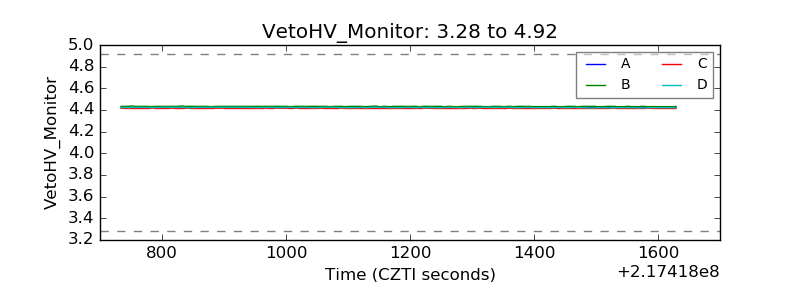 |
| Veto LLD | 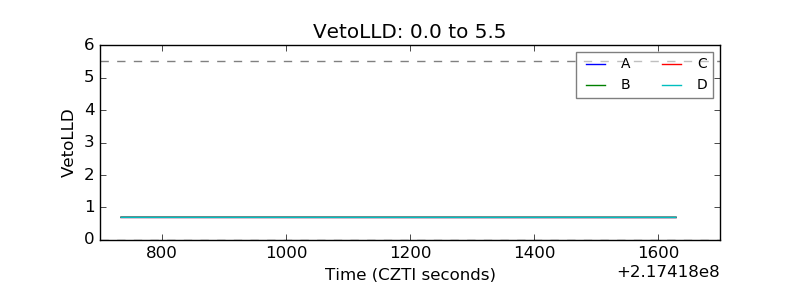 |
| Alpha Counter | 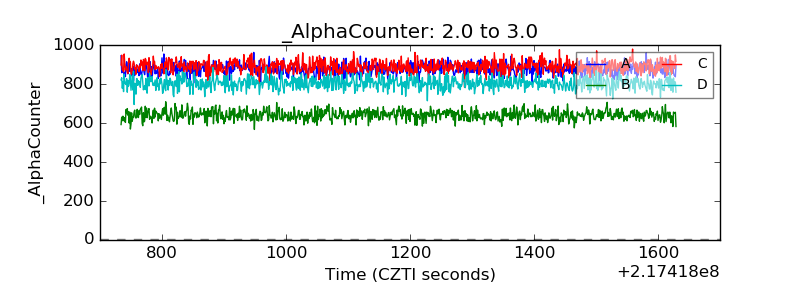 |
| _CPM_Rate | 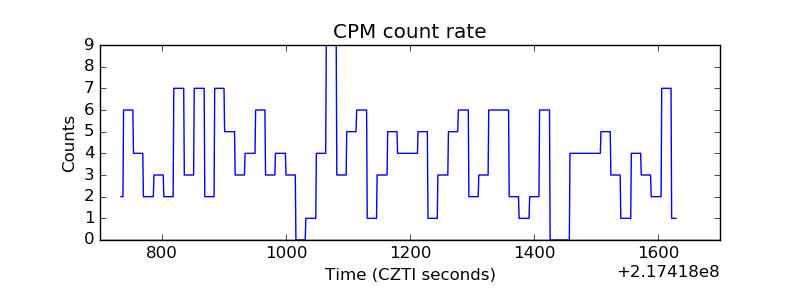 |
| CZT Counter | 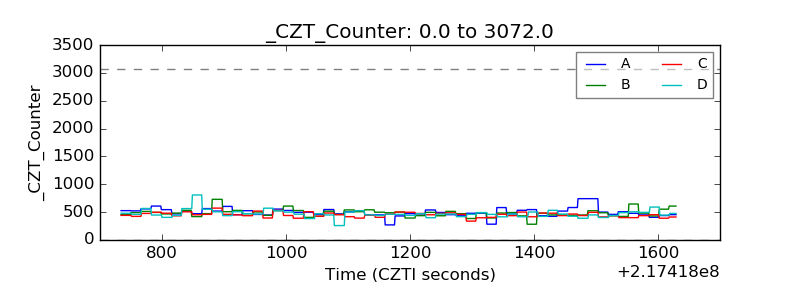 |
| +2.5 Volts monitor | 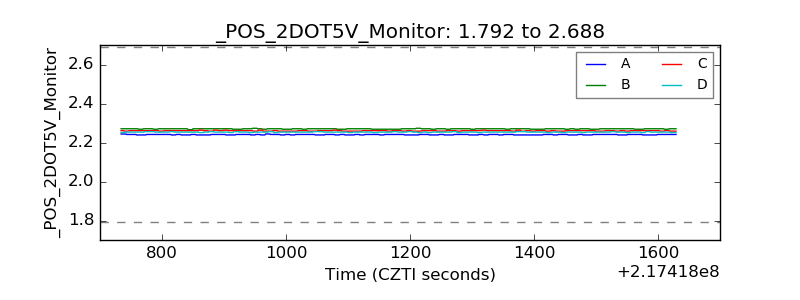 |
| +5 Volts monitor | 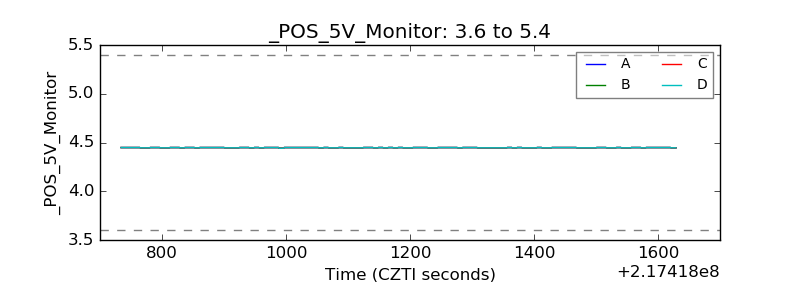 |
| _ROLL_ROT | 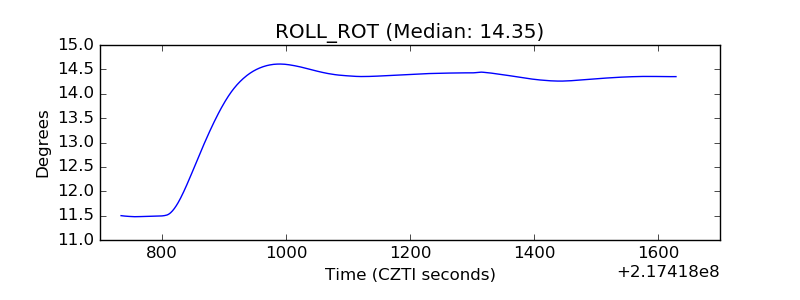 |
| _Roll_DEC | 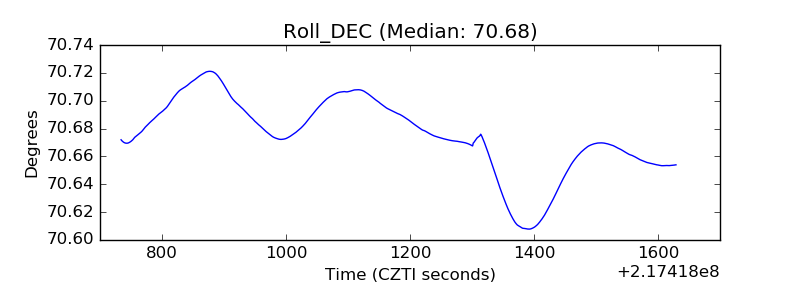 |
| _Roll_RA | 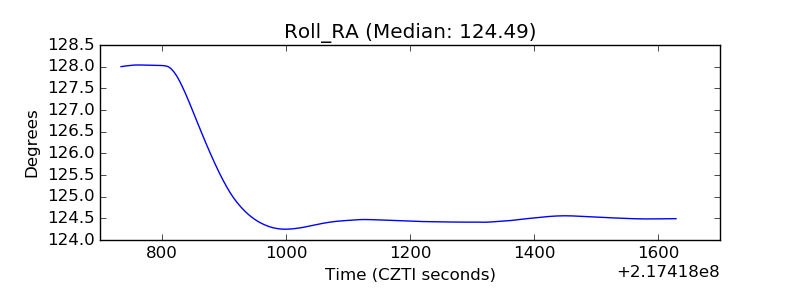 |
| Veto Counter | 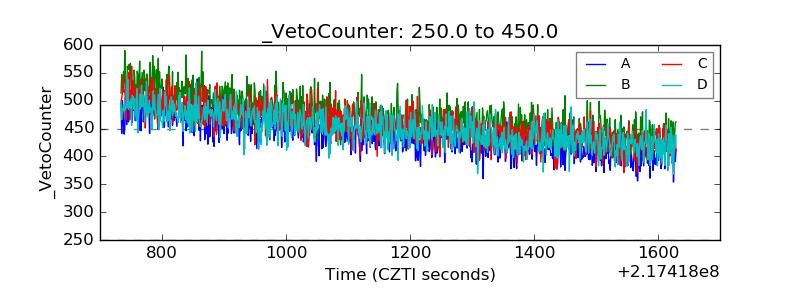 |