| Param | Original file | Final file |
|---|---|---|
| Filename | modeM0/AS1A02_046T01_9000000814_06223cztM0_level2.evt | modeM0/AS1A02_046T01_9000000814_06223cztM0_level2_quad_clean.evt |
| Size (bytes) | 420,808,320 | 125,737,920 |
| Size | 401.3 MB | 119.9 MB |
| Events in quadrant A | 3,208,368 | 851,116 |
| Events in quadrant B | 3,151,101 | 862,511 |
| Events in quadrant C | 2,942,619 | 841,550 |
| Events in quadrant D | 3,013,824 | 813,958 |
| Mode M9 | |||
|---|---|---|---|
| Quadrant | BADHDUFLAG | Total packets | Discarded packets |
| A | 0 | 12 | 0 |
| B | 0 | 12 | 0 |
| C | 0 | 12 | 0 |
| D | 0 | 12 | 0 |
| Mode M0 | |||
|---|---|---|---|
| Quadrant | BADHDUFLAG | Total packets | Discarded packets |
| A | 0 | 13513 | 2 |
| B | 0 | 13327 | 1 |
| C | 0 | 12867 | 1 |
| D | 0 | 13059 | 1 |
| Mode SS | |||
|---|---|---|---|
| Quadrant | BADHDUFLAG | Total packets | Discarded packets |
| A | 0 | 130 | 0 |
| B | 0 | 130 | 0 |
| C | 0 | 130 | 0 |
| D | 0 | 130 | 0 |
| Quadrant | Total seconds | Saturated seconds | Saturation percentage |
|---|---|---|---|
| A | 6287 | 122 | 1.940512% |
| B | 6287 | 100 | 1.590584% |
| C | 6287 | 77 | 1.224749% |
| D | 6287 | 84 | 1.336090% |
Noise dominated data is calculated using 1-second bins in cleaned event files. If a bin has >2000 counts, and if more than 50% of those come from <1% of pixels, then it is considered to be noise-dominated and hence unusable.
| Quadrant | # 1 sec bins | Bins with >0 counts | Bins with >2000 counts | High rate bins dominated by noise | Noise dominated (total time) | Noise dominated (detector-on time) | Marked lightcurve |
|---|---|---|---|---|---|---|---|
| A | 7562 | 6287 | 22 | 22 | 0.29% | 0.35% | 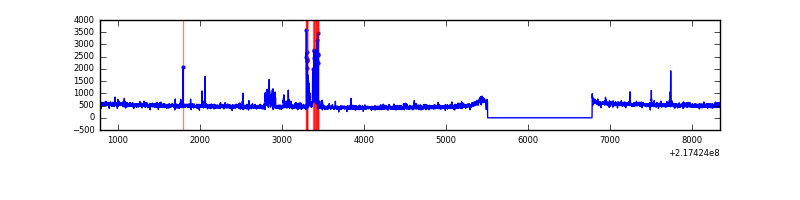 |
| B | 7562 | 6287 | 6 | 6 | 0.08% | 0.10% | 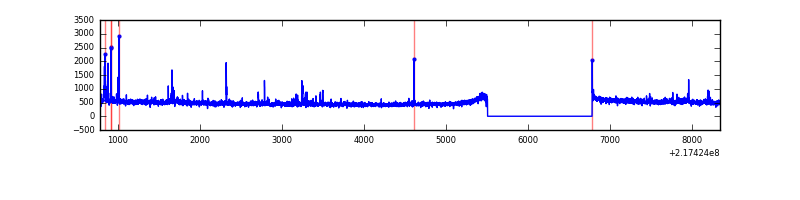 |
| C | 7562 | 6287 | 0 | 0 | 0.00% | 0.00% | 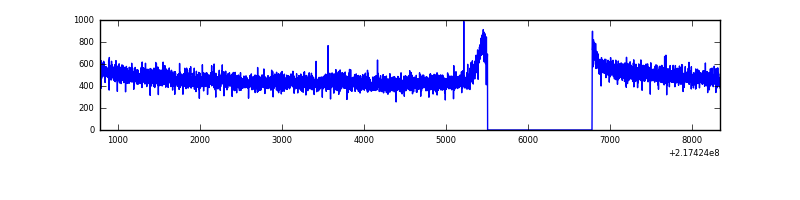 |
| D | 7562 | 6287 | 4 | 4 | 0.05% | 0.06% | 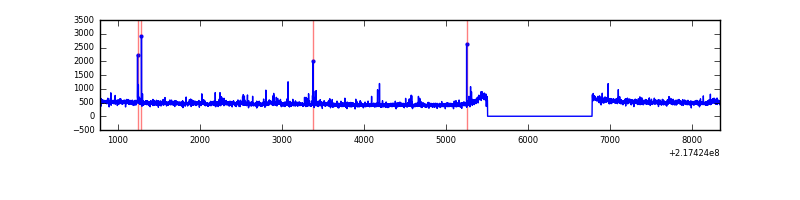 |
Top three noisy pixels from each quadrant. If the there are fewer than three noisy pixels in the level2.evt file, extra rows are filled as -1
| Pixel properties | Quadrant properties | ||||||
|---|---|---|---|---|---|---|---|
| Quadrant | DetID | PixID | Counts | Sigma | Mean | Median | Sigma |
| A | 8 | 15 | 122499 | 782.12 | 775 | 759 | 155.7 |
| A | 0 | 31 | 75919 | 482.86 | 775 | 759 | 155.7 |
| A | 15 | 239 | 9034 | 53.16 | 775 | 759 | 155.7 |
| B | 0 | 219 | 65373 | 446.96 | 775 | 757 | 144.6 |
| B | 15 | 204 | 38151 | 258.66 | 775 | 757 | 144.6 |
| B | 0 | 214 | 19393 | 128.91 | 775 | 757 | 144.6 |
| C | 13 | 61 | 5919 | 30.34 | 751 | 755 | 170.2 |
| C | 1 | 16 | 5433 | 27.49 | 751 | 755 | 170.2 |
| C | 14 | 67 | 3854 | 18.21 | 751 | 755 | 170.2 |
| D | 2 | 63 | 37179 | 199.0 | 758 | 733 | 183.1 |
| D | 2 | 136 | 36743 | 196.62 | 758 | 733 | 183.1 |
| D | 2 | 14 | 22047 | 116.37 | 758 | 733 | 183.1 |
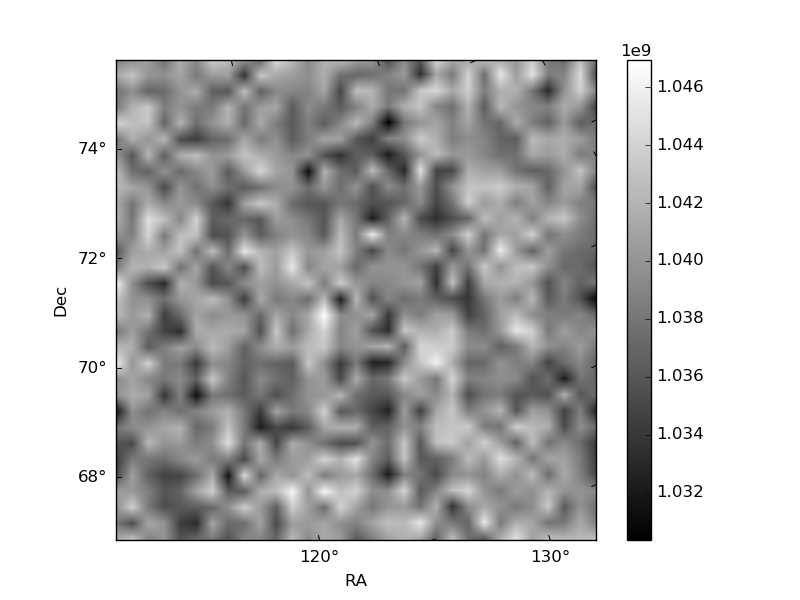
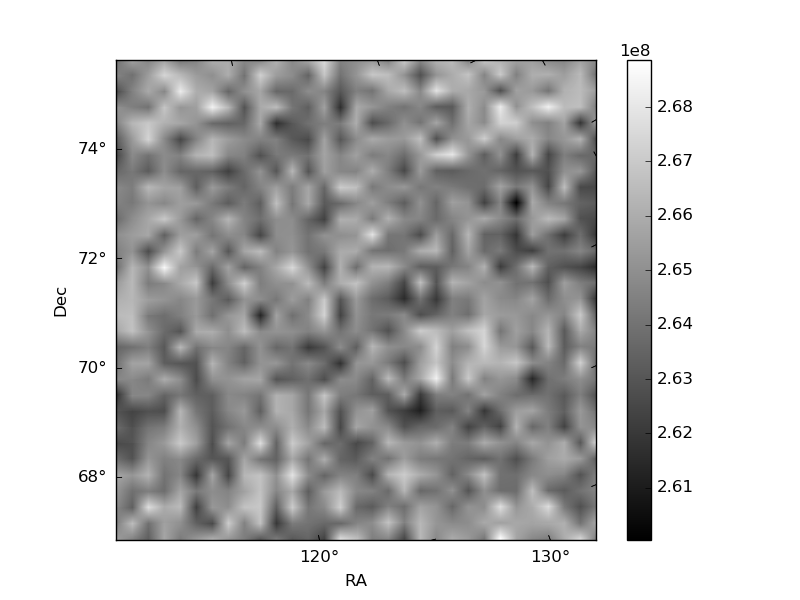
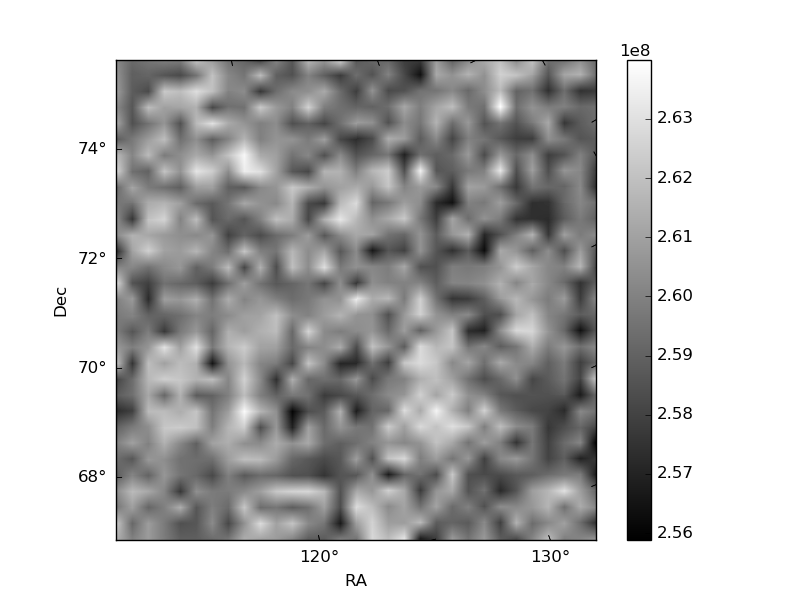
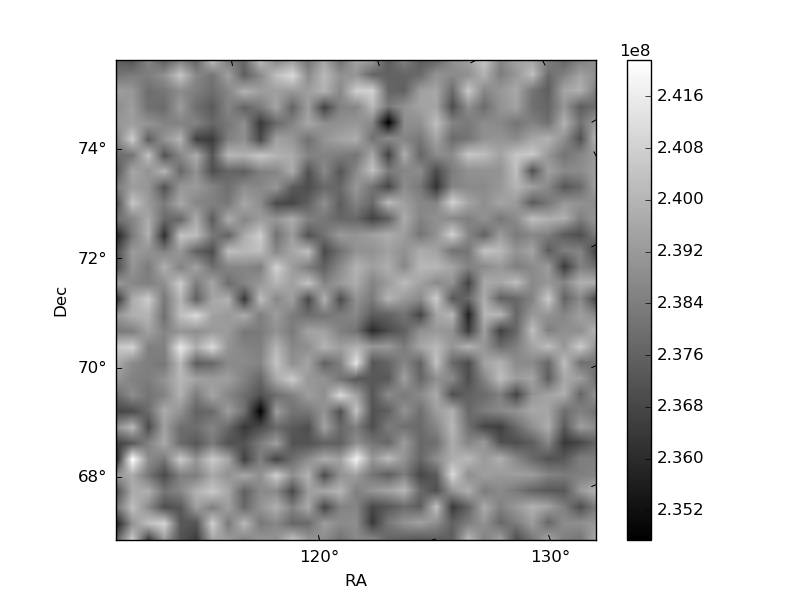
Histogram calculated using DETX and DETY for each event in the final _common_clean file
| Quadrant A | 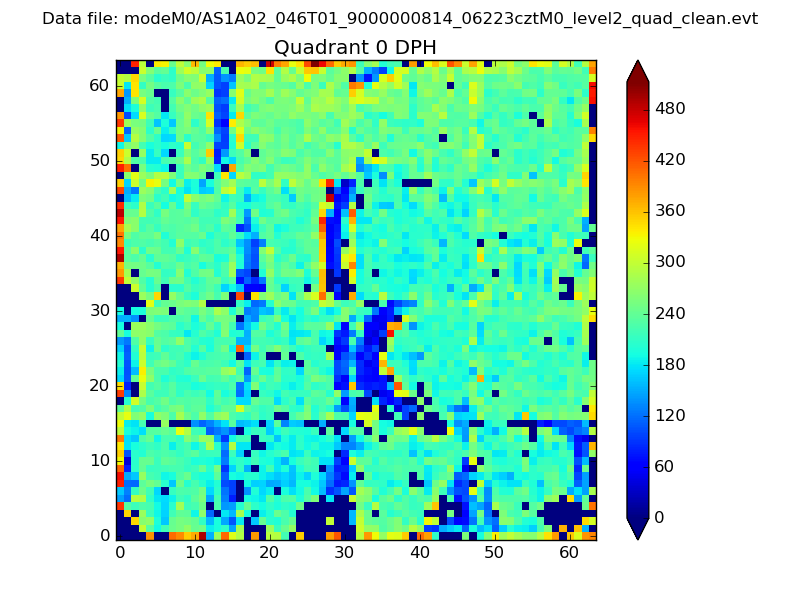 |
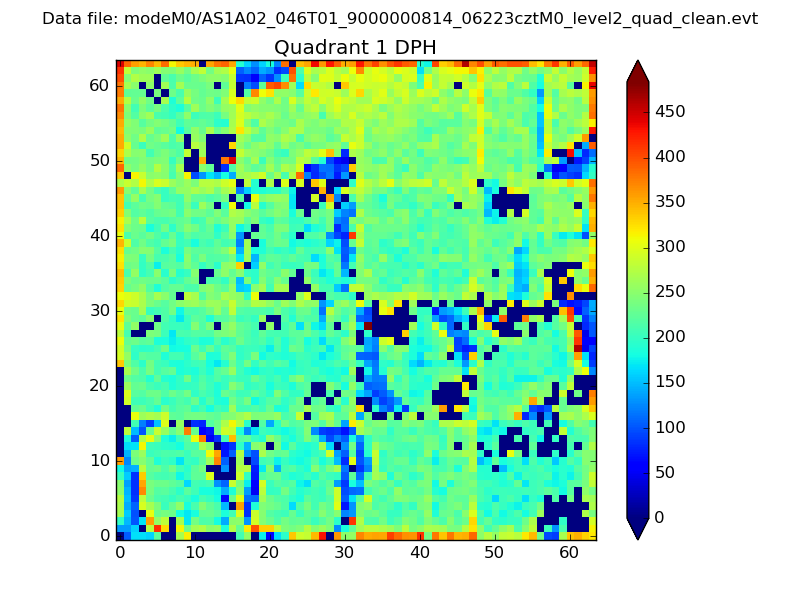 |
Quadrant B |
|---|---|---|---|
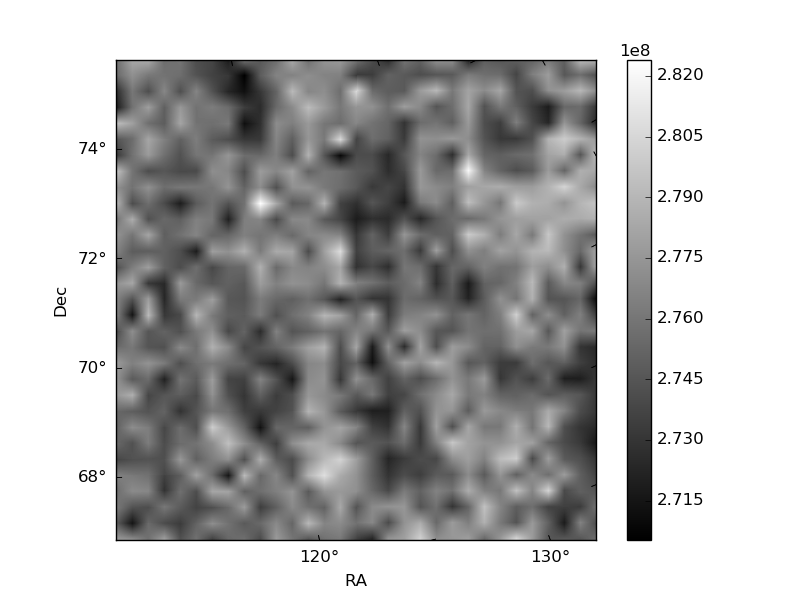
| Quadrant D | 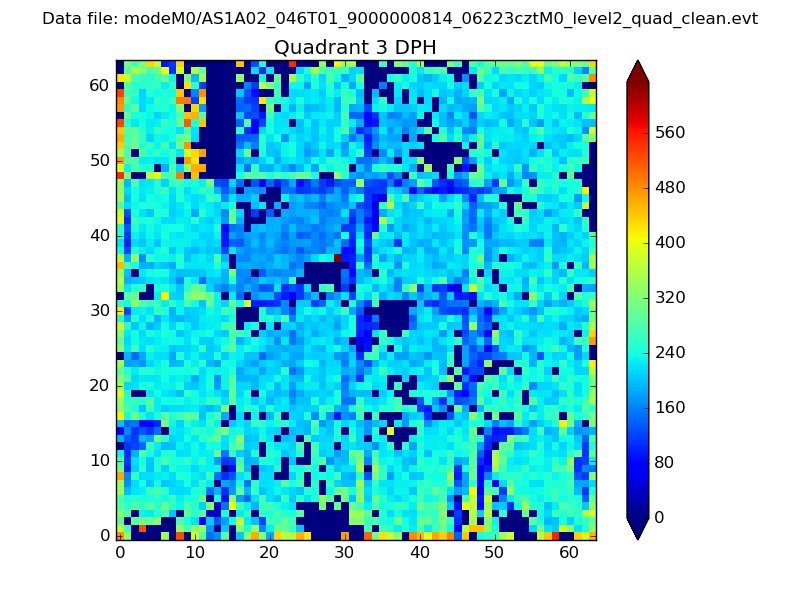 |
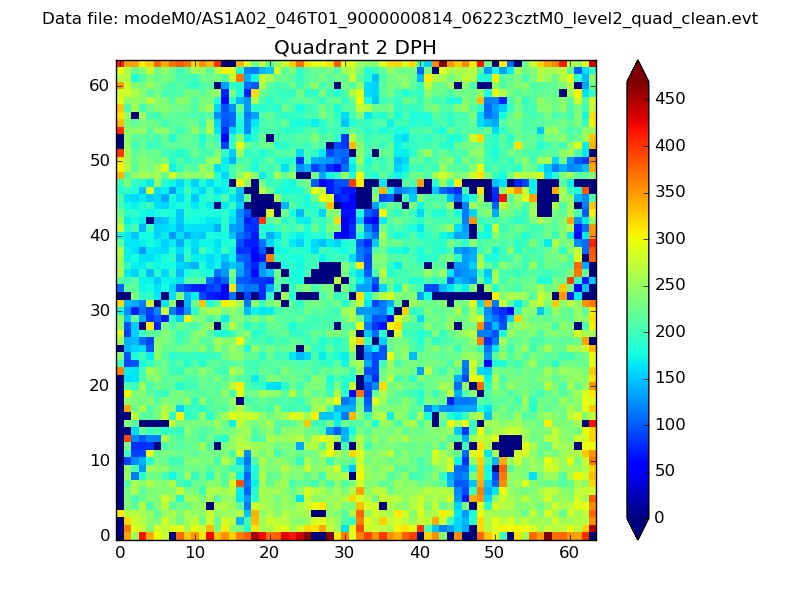 |
Quadrant C |
| Plot type | Count rate plots | Images |
|---|---|---|
| Comparison with Poisson distribution Blue bars denote a histogram of data divided into 1 sec bins. Red curve is a Poisson curve with rate = median count rate of data. |
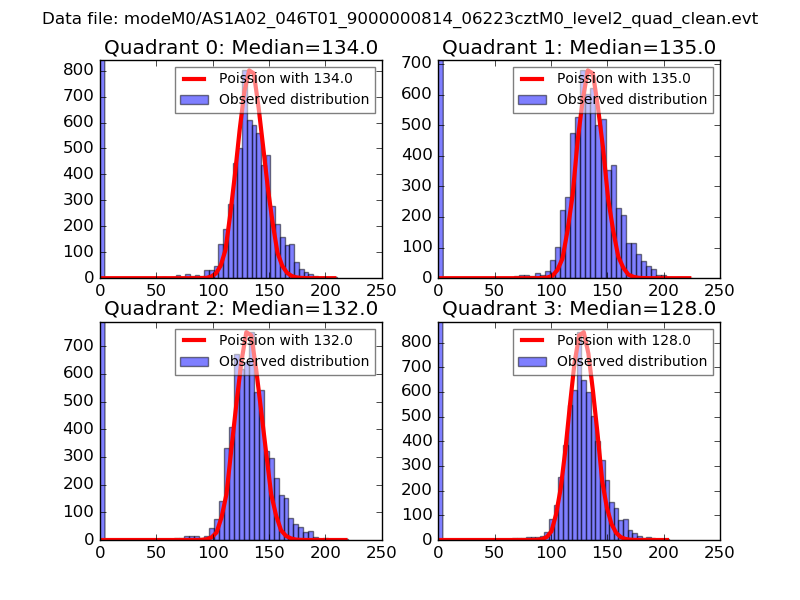 |
 |
| Quadrant-wise count rates Data is divided into 100 sec bins |
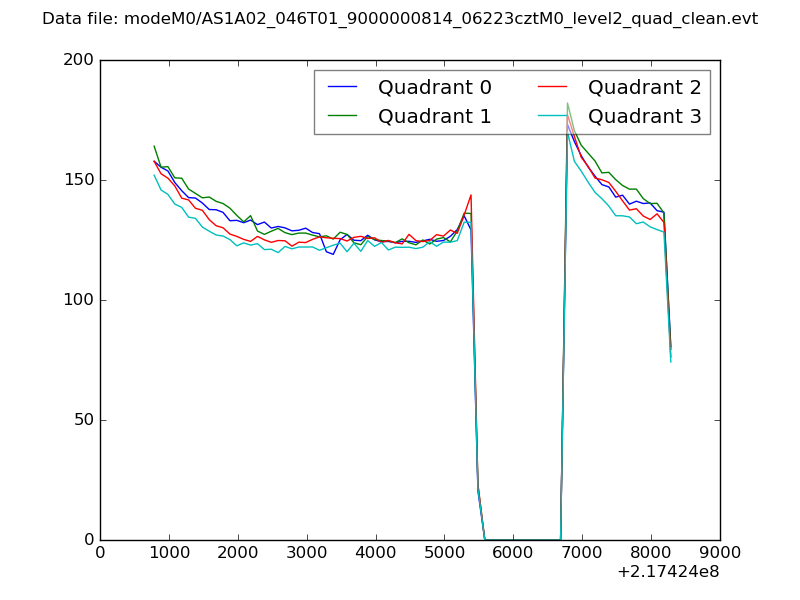 |
|
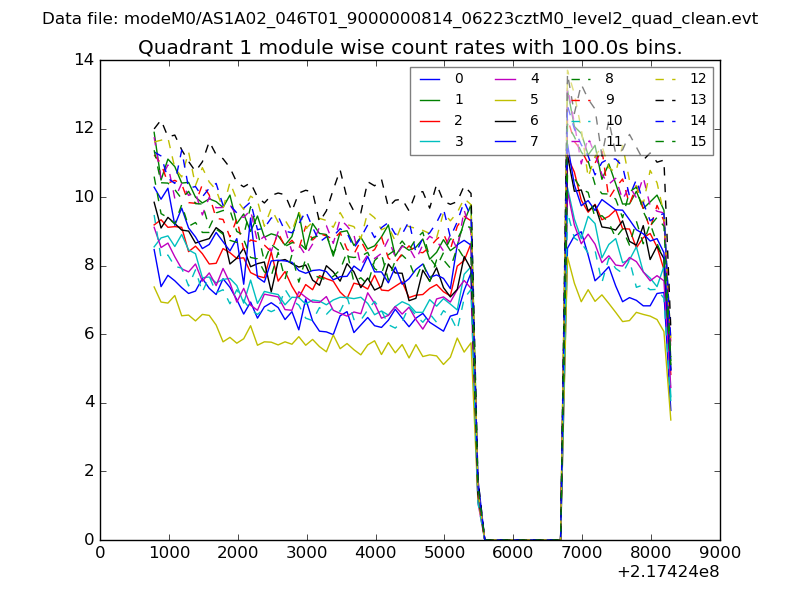
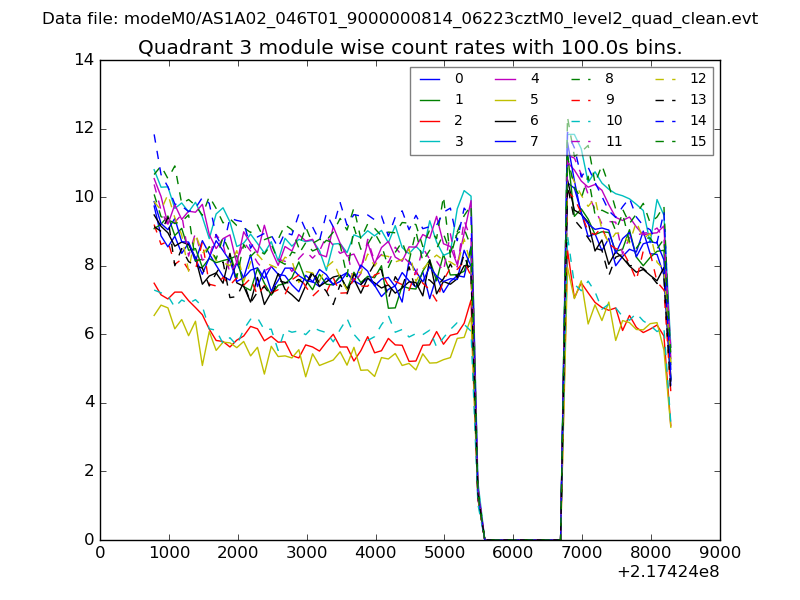
| Module-wise count rates for Quadrant A Data is divided into 100 sec bins |
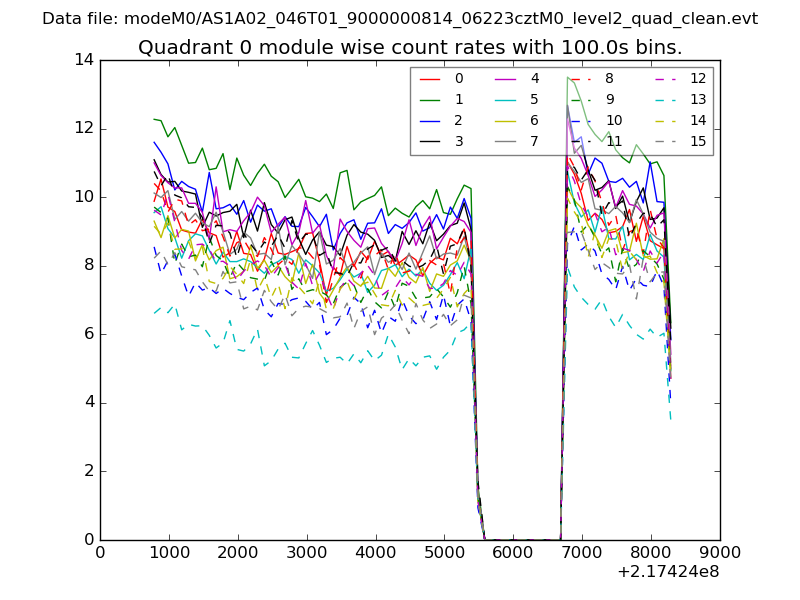 |
 |
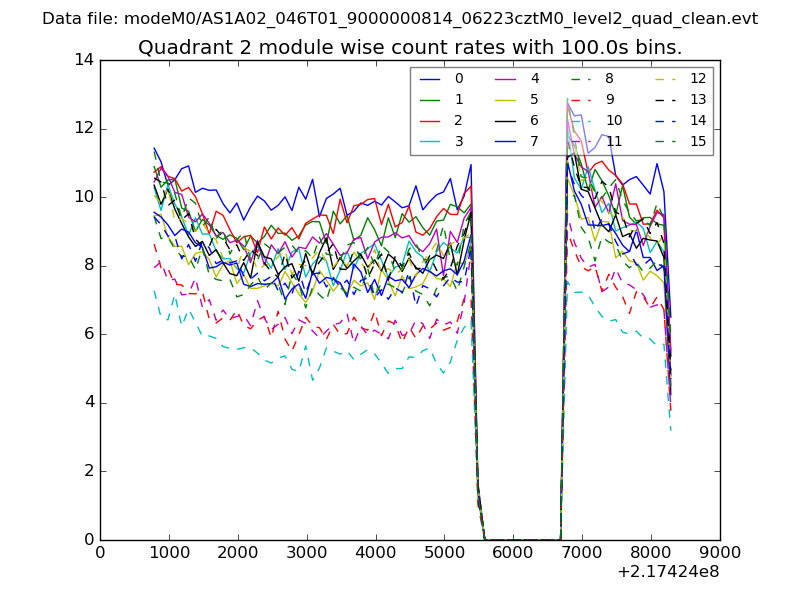
| Module-wise count rates for Quadrant B Data is divided into 100 sec bins |
 |
 |
| Module-wise count rates for Quadrant C Data is divided into 100 sec bins |
 |
 |
| Module-wise count rates for Quadrant D Data is divided into 100 sec bins |
 |
 |
| Parameter | Plot |
|---|---|
| CZT HV Monitor | 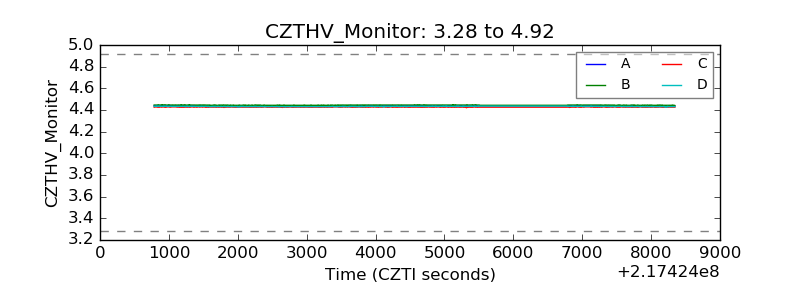 |
| D_VDD | 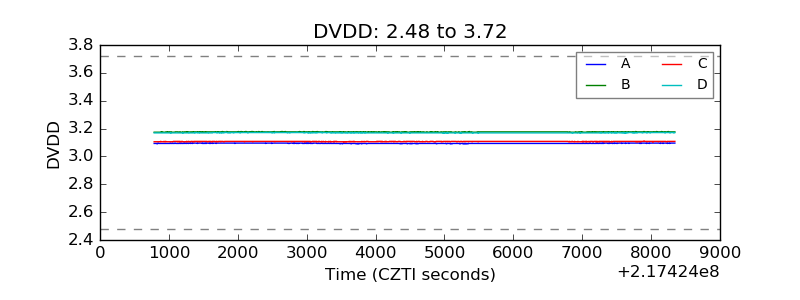 |
| Temperature 1 | 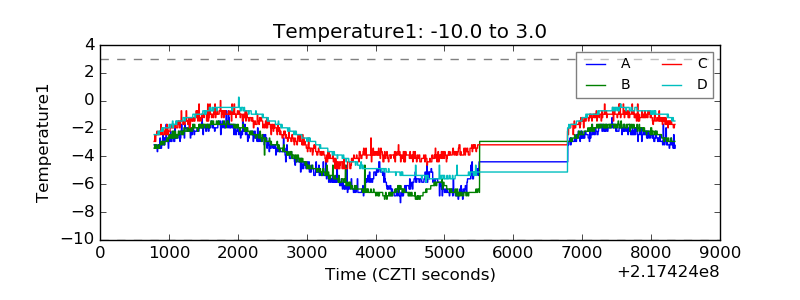 |
| Veto HV Monitor | 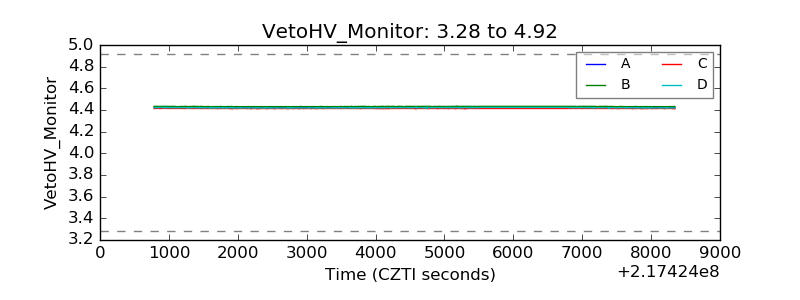 |
| Veto LLD | 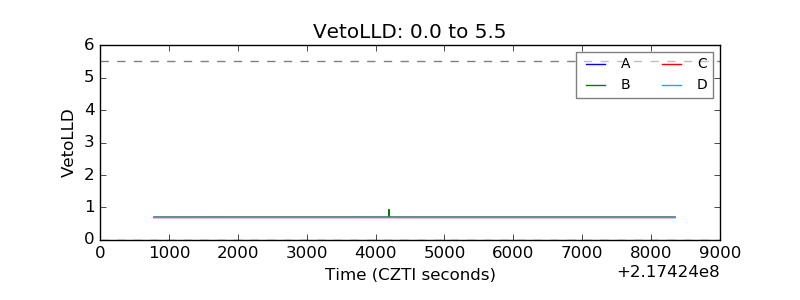 |
| Alpha Counter | 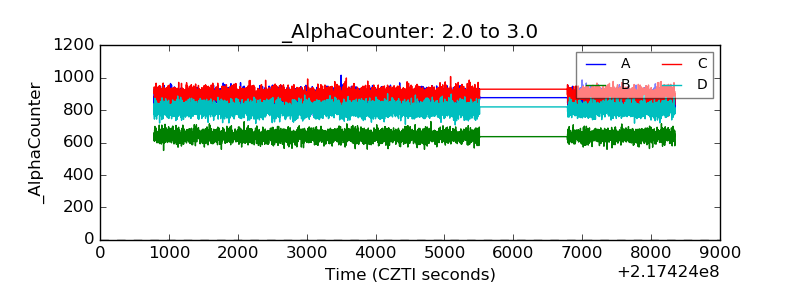 |
| _CPM_Rate | 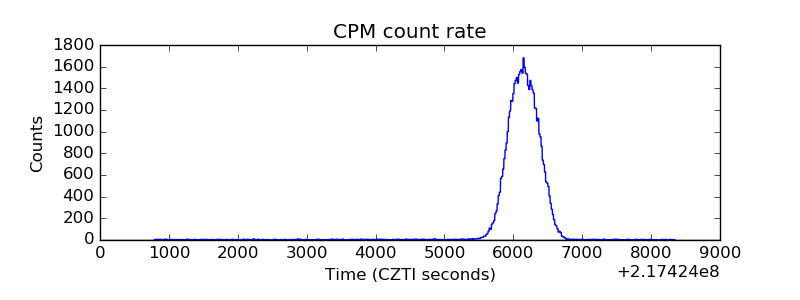 |
| CZT Counter | 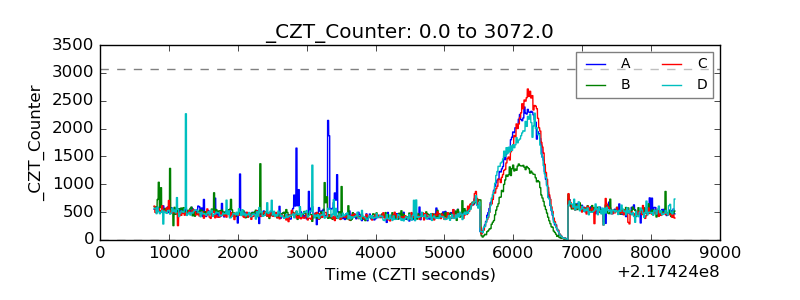 |
| +2.5 Volts monitor | 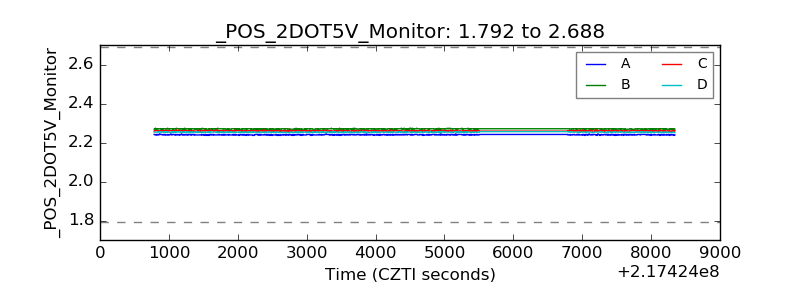 |
| +5 Volts monitor |  |
| _ROLL_ROT | 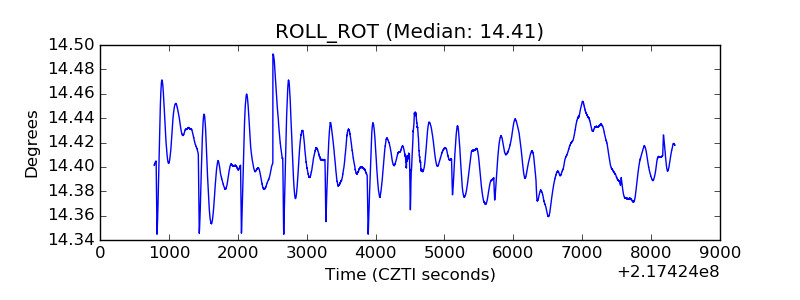 |
| _Roll_DEC | 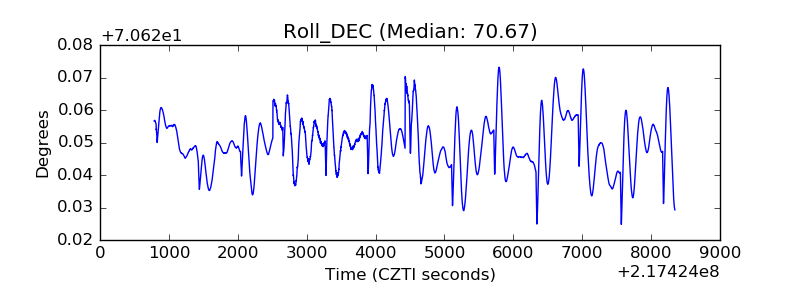 |
| _Roll_RA | 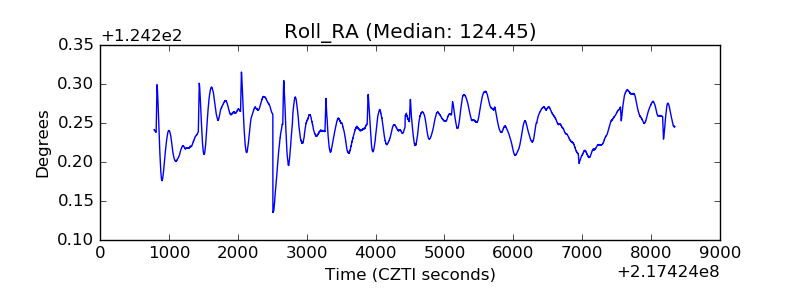 |
| Veto Counter | 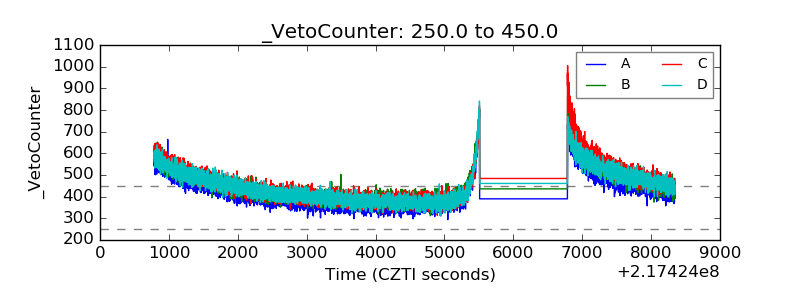 |