| Param | Original file | Final file |
|---|---|---|
| Filename | modeM0/AS1A02_046T01_9000000814_06224cztM0_level2.evt | modeM0/AS1A02_046T01_9000000814_06224cztM0_level2_quad_clean.evt |
| Size (bytes) | 428,351,040 | 118,595,520 |
| Size | 408.5 MB | 113.1 MB |
| Events in quadrant A | 3,477,603 | 797,686 |
| Events in quadrant B | 2,998,364 | 808,432 |
| Events in quadrant C | 2,806,250 | 799,646 |
| Events in quadrant D | 3,282,654 | 767,157 |
| Mode M9 | |||
|---|---|---|---|
| Quadrant | BADHDUFLAG | Total packets | Discarded packets |
| A | 0 | 13 | 0 |
| B | 0 | 13 | 0 |
| C | 0 | 13 | 0 |
| D | 0 | 13 | 0 |
| Mode M0 | |||
|---|---|---|---|
| Quadrant | BADHDUFLAG | Total packets | Discarded packets |
| A | 0 | 14335 | 2 |
| B | 0 | 12800 | 1 |
| C | 0 | 12312 | 1 |
| D | 0 | 13502 | 1 |
| Mode SS | |||
|---|---|---|---|
| Quadrant | BADHDUFLAG | Total packets | Discarded packets |
| A | 0 | 120 | 0 |
| B | 0 | 120 | 0 |
| C | 0 | 120 | 0 |
| D | 0 | 120 | 0 |
| Quadrant | Total seconds | Saturated seconds | Saturation percentage |
|---|---|---|---|
| A | 6006 | 141 | 2.347652% |
| B | 6006 | 117 | 1.948052% |
| C | 6006 | 86 | 1.431901% |
| D | 6006 | 101 | 1.681652% |
Noise dominated data is calculated using 1-second bins in cleaned event files. If a bin has >2000 counts, and if more than 50% of those come from <1% of pixels, then it is considered to be noise-dominated and hence unusable.
| Quadrant | # 1 sec bins | Bins with >0 counts | Bins with >2000 counts | High rate bins dominated by noise | Noise dominated (total time) | Noise dominated (detector-on time) | Marked lightcurve |
|---|---|---|---|---|---|---|---|
| A | 7291 | 6006 | 3 | 3 | 0.04% | 0.05% | 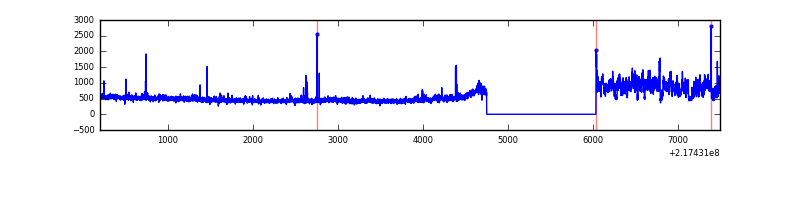 |
| B | 7291 | 6006 | 13 | 13 | 0.18% | 0.22% | 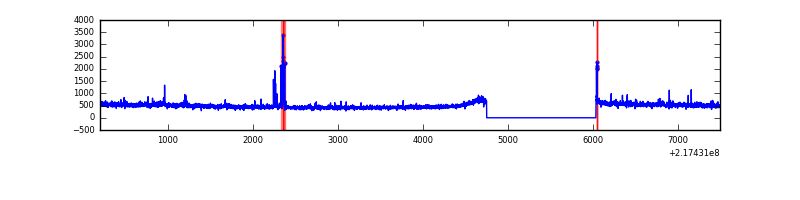 |
| C | 7291 | 6006 | 0 | 0 | 0.00% | 0.00% | 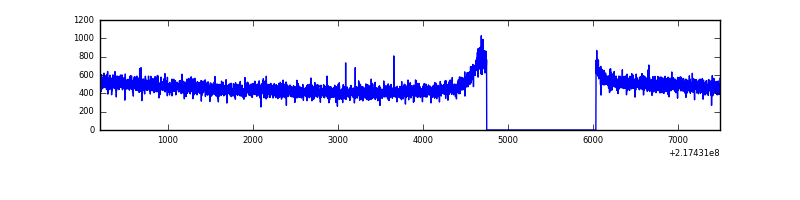 |
| D | 7291 | 6006 | 11 | 11 | 0.15% | 0.18% | 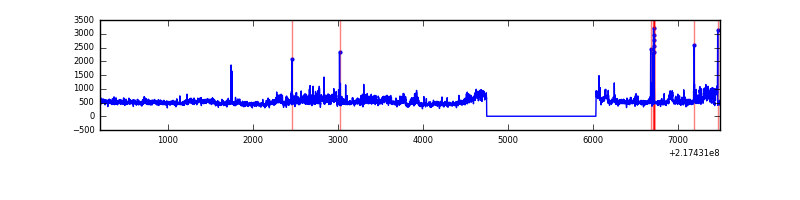 |
Top three noisy pixels from each quadrant. If the there are fewer than three noisy pixels in the level2.evt file, extra rows are filled as -1
| Pixel properties | Quadrant properties | ||||||
|---|---|---|---|---|---|---|---|
| Quadrant | DetID | PixID | Counts | Sigma | Mean | Median | Sigma |
| A | 13 | 34 | 579688 | 3937.82 | 730 | 714 | 147.0 |
| A | 8 | 15 | 41031 | 274.21 | 730 | 714 | 147.0 |
| A | 0 | 31 | 15635 | 101.48 | 730 | 714 | 147.0 |
| B | 15 | 204 | 43391 | 313.36 | 733 | 716 | 136.2 |
| B | 15 | 54 | 32070 | 230.23 | 733 | 716 | 136.2 |
| B | 0 | 219 | 29242 | 209.46 | 733 | 716 | 136.2 |
| C | 13 | 61 | 5791 | 30.88 | 718 | 723 | 164.1 |
| C | 8 | 222 | 2595 | 11.41 | 718 | 723 | 164.1 |
| C | 1 | 16 | 2129 | 8.57 | 718 | 723 | 164.1 |
| D | 2 | 63 | 400643 | 2312.44 | 718 | 696 | 173.0 |
| D | 5 | 97 | 52974 | 302.26 | 718 | 696 | 173.0 |
| D | 5 | 239 | 45886 | 261.28 | 718 | 696 | 173.0 |
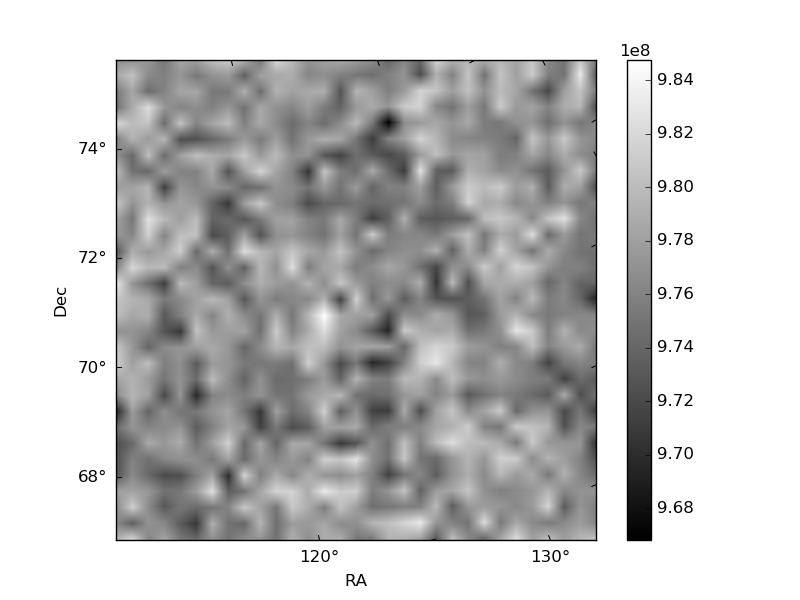
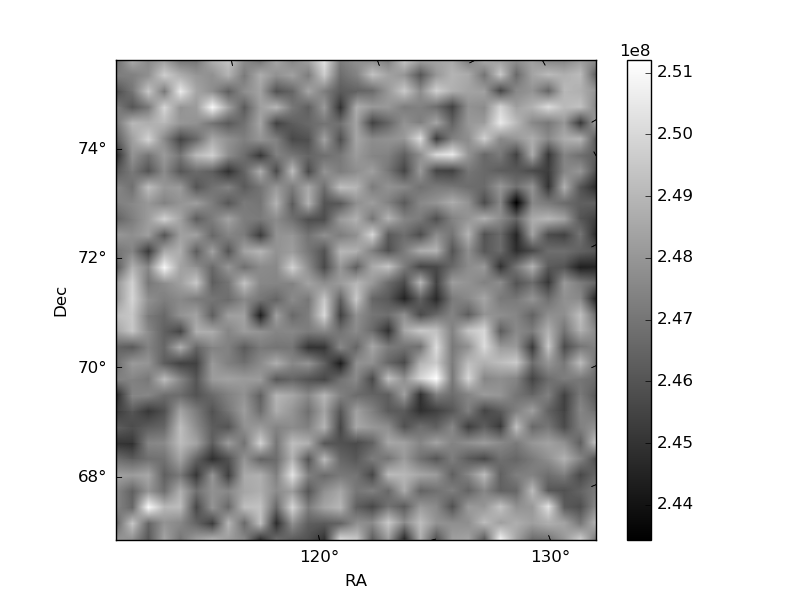
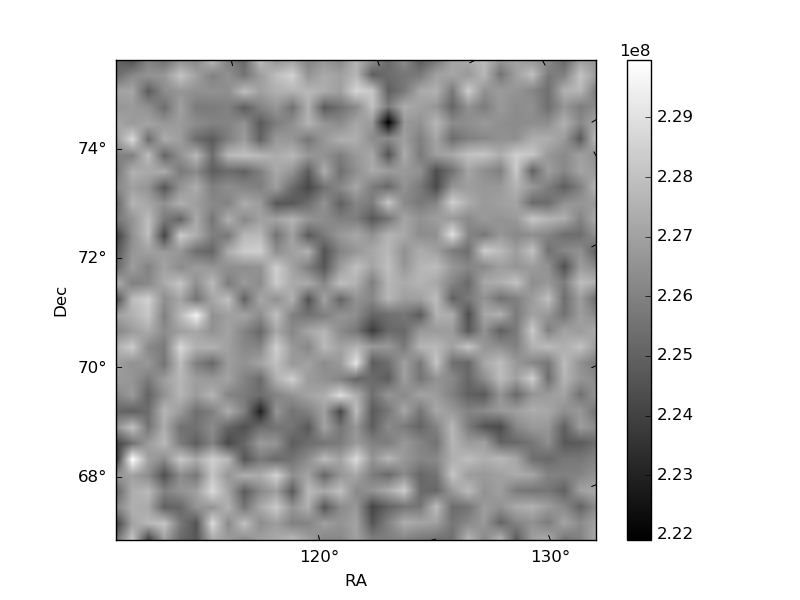
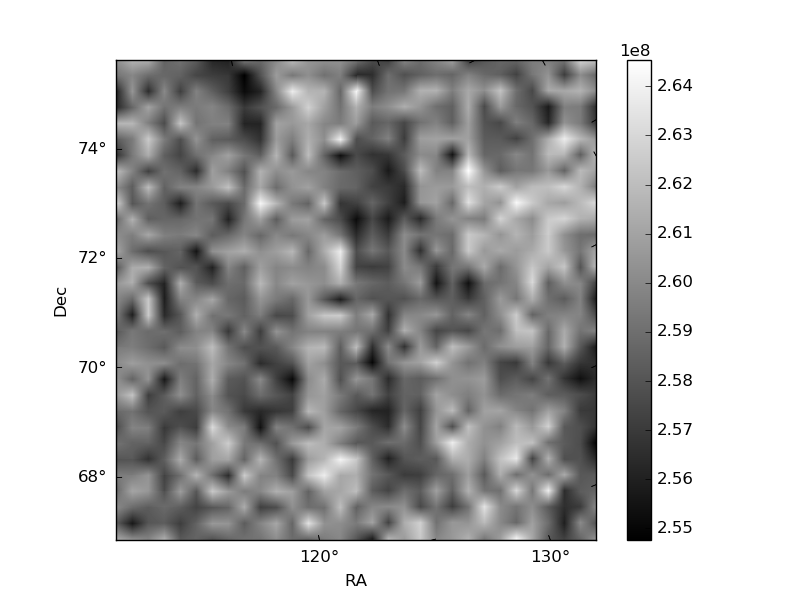
Histogram calculated using DETX and DETY for each event in the final _common_clean file
| Quadrant A | 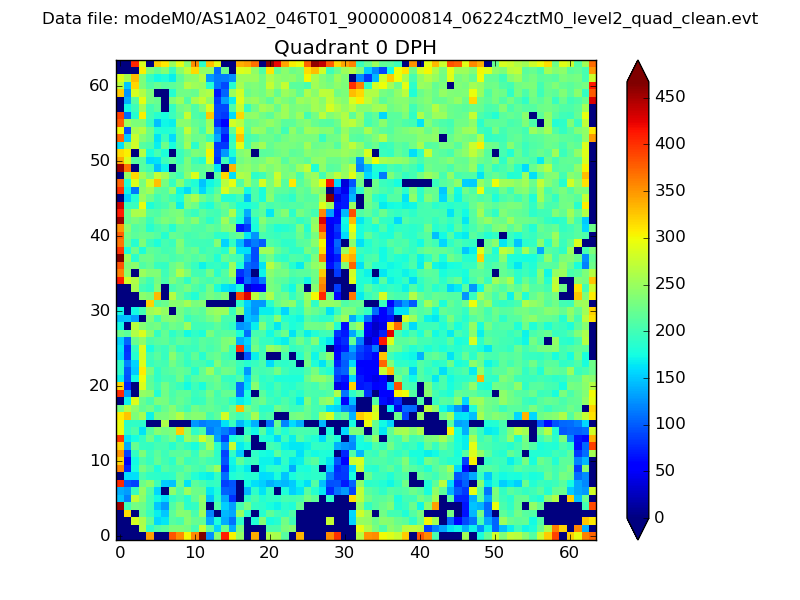 |
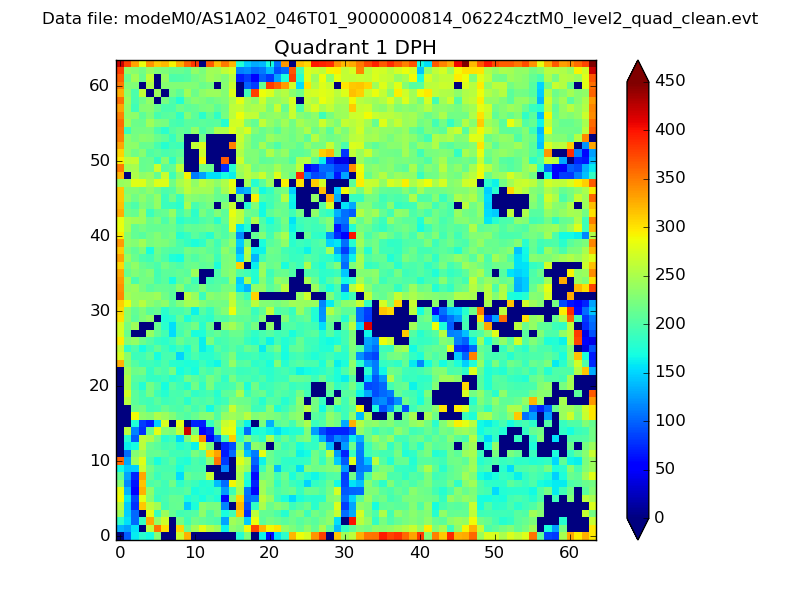 |
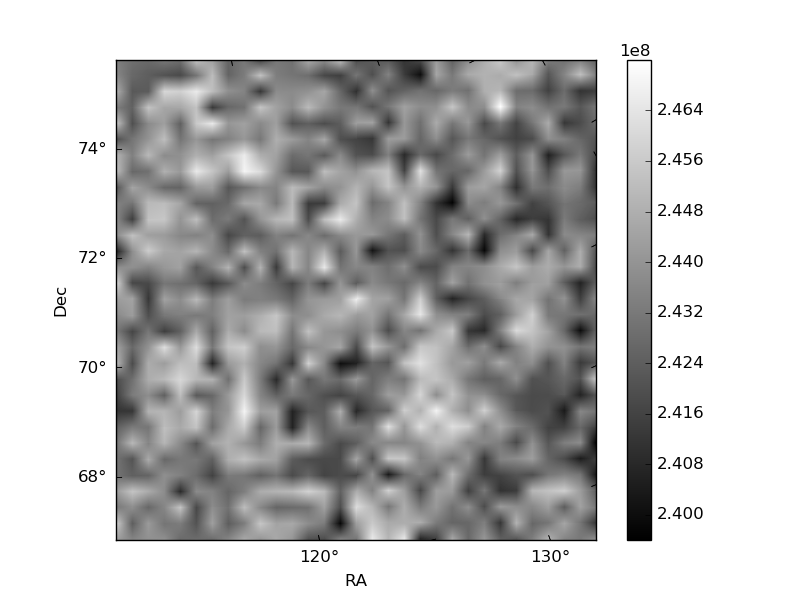
Quadrant B |
|---|---|---|---|
| Quadrant D | 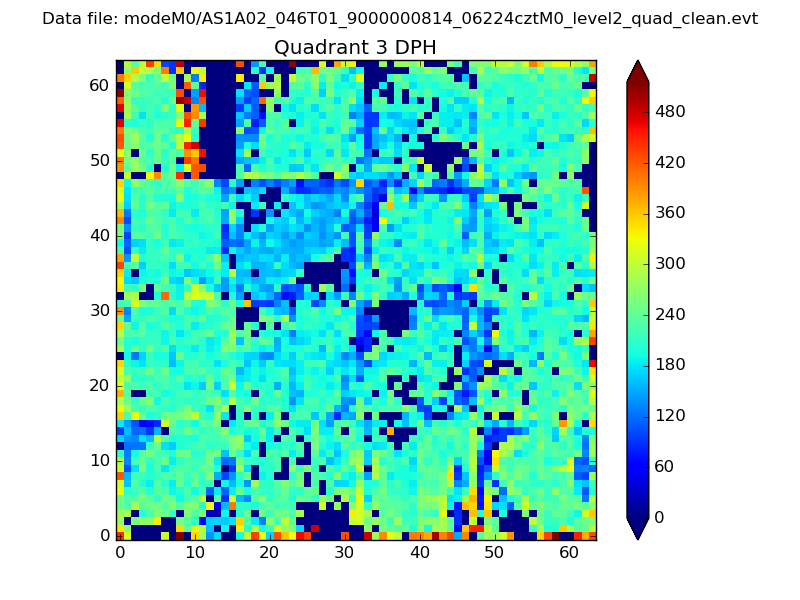 |
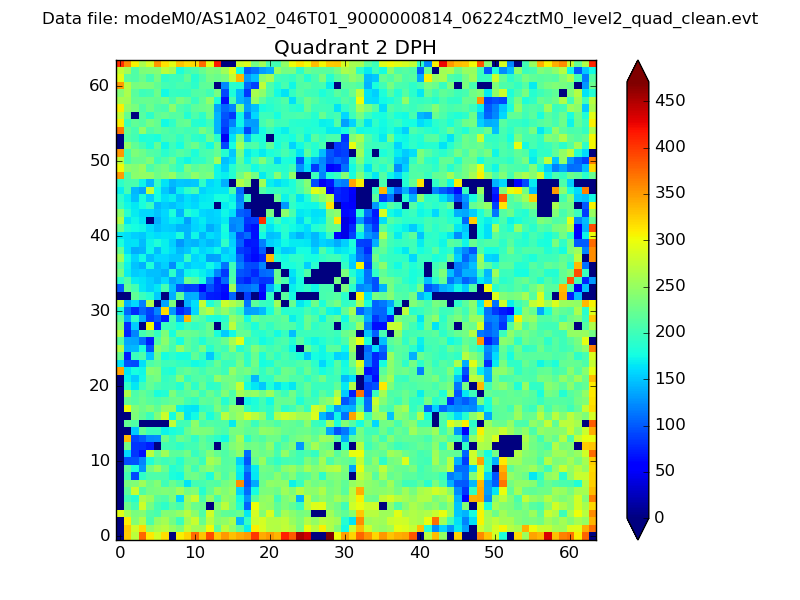 |
Quadrant C |
| Plot type | Count rate plots | Images |
|---|---|---|
| Comparison with Poisson distribution Blue bars denote a histogram of data divided into 1 sec bins. Red curve is a Poisson curve with rate = median count rate of data. |
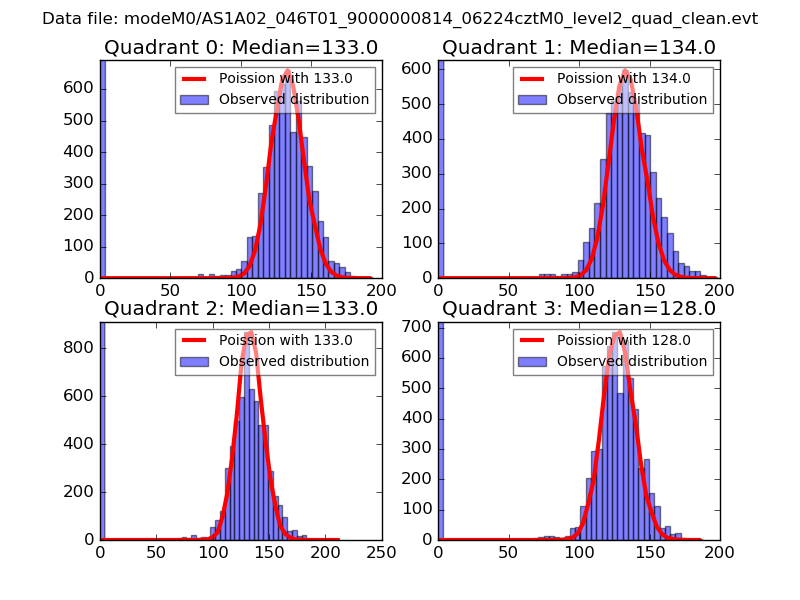 |
 |
| Quadrant-wise count rates Data is divided into 100 sec bins |
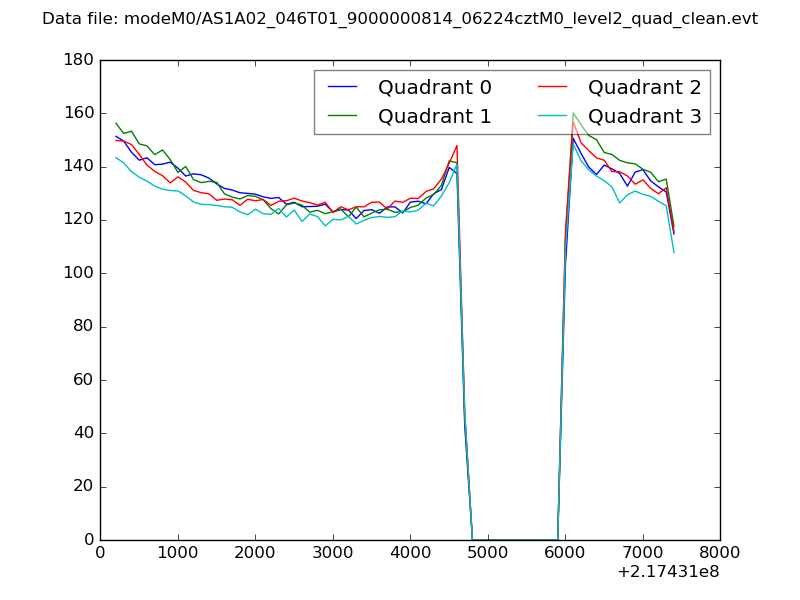 |
|
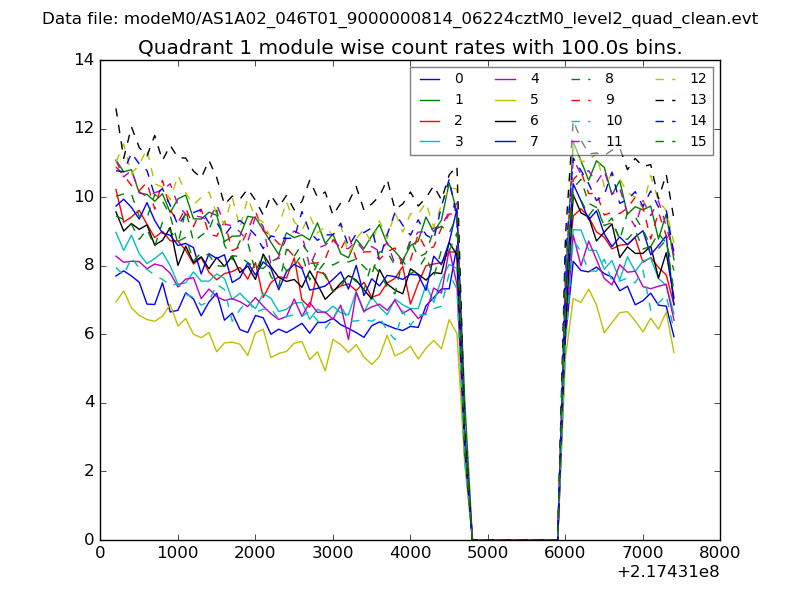
| Module-wise count rates for Quadrant A Data is divided into 100 sec bins |
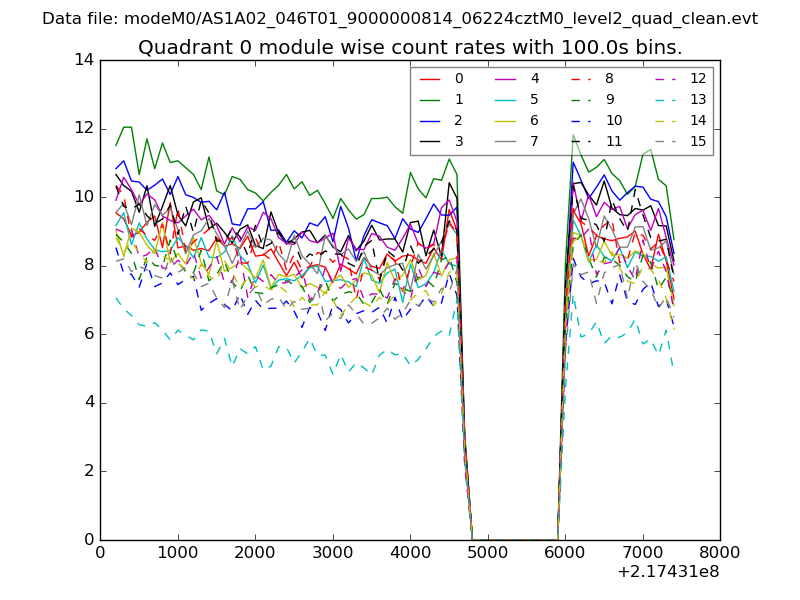 |
 |
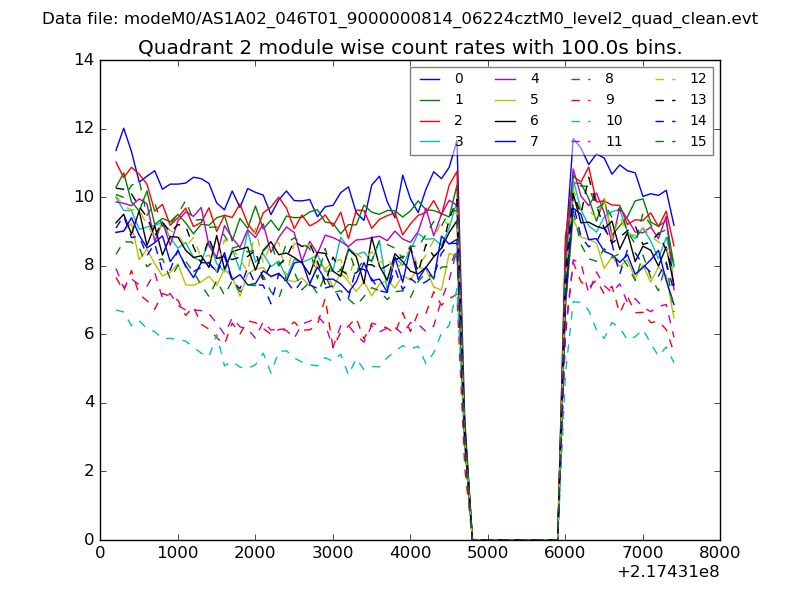
| Module-wise count rates for Quadrant B Data is divided into 100 sec bins |
 |
 |
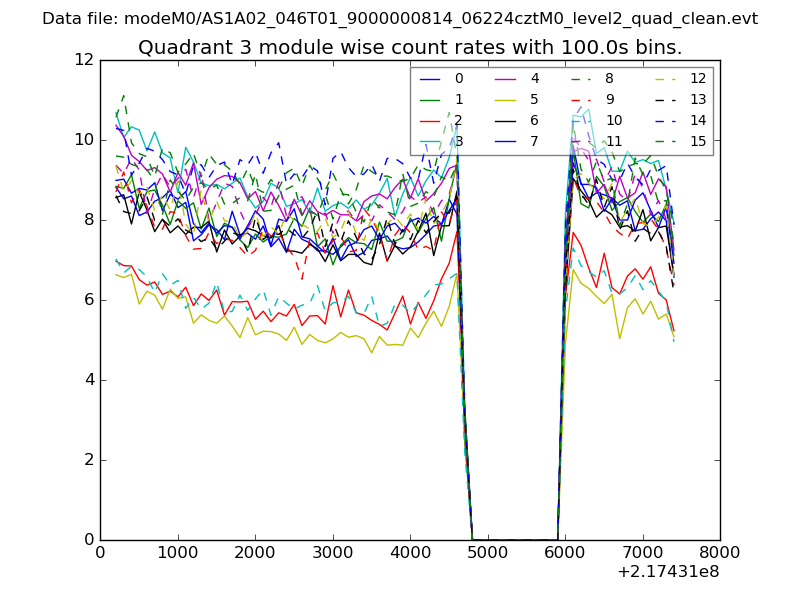
| Module-wise count rates for Quadrant C Data is divided into 100 sec bins |
 |
 |
| Module-wise count rates for Quadrant D Data is divided into 100 sec bins |
 |
 |
| Parameter | Plot |
|---|---|
| CZT HV Monitor | 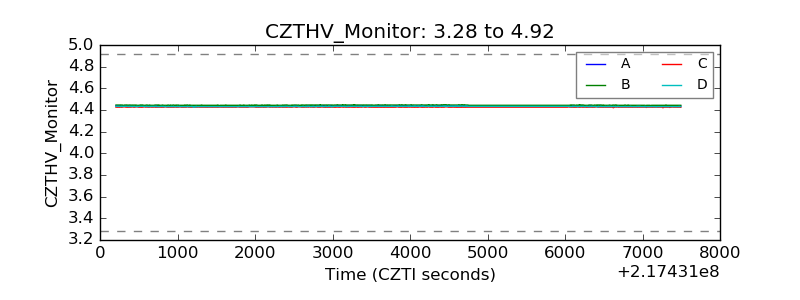 |
| D_VDD | 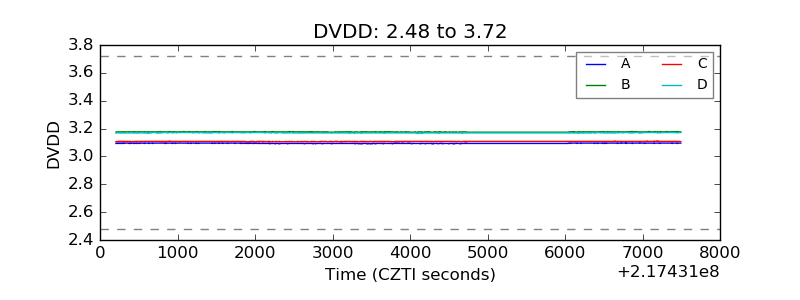 |
| Temperature 1 | 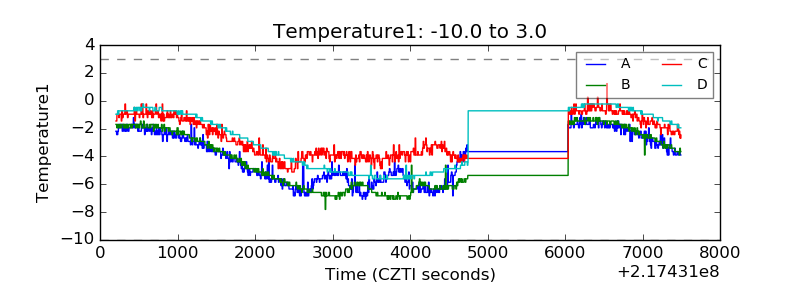 |
| Veto HV Monitor | 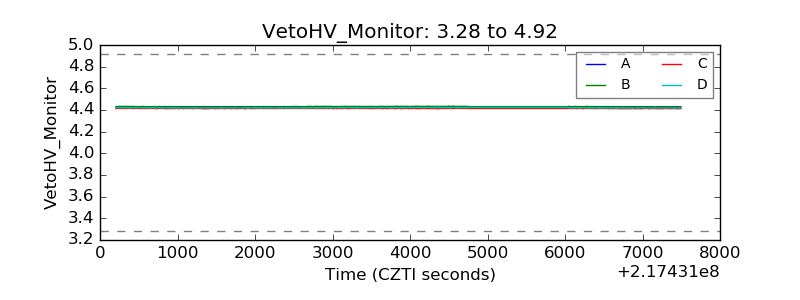 |
| Veto LLD | 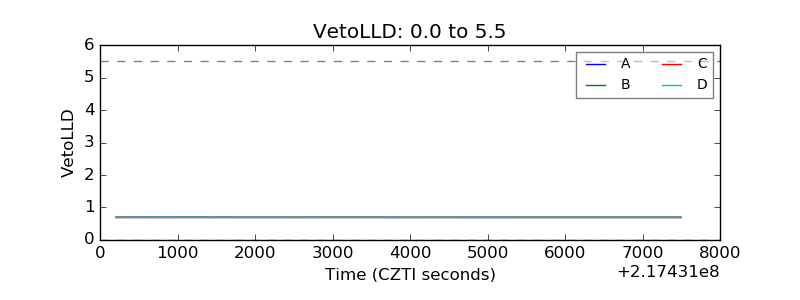 |
| Alpha Counter | 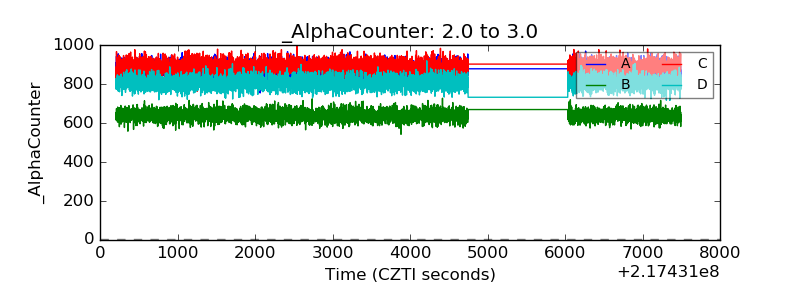 |
| _CPM_Rate | 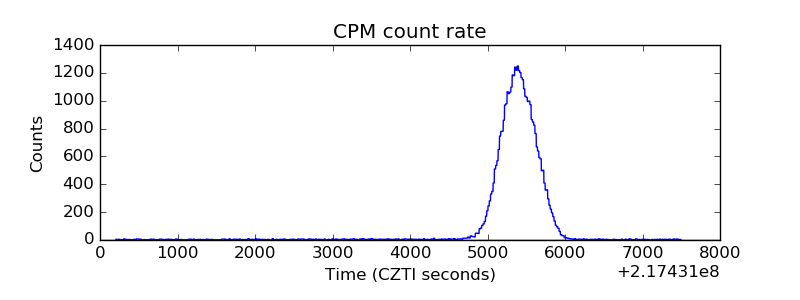 |
| CZT Counter | 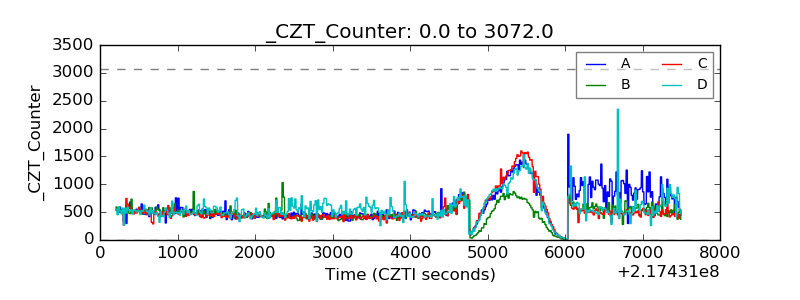 |
| +2.5 Volts monitor |  |
| +5 Volts monitor | 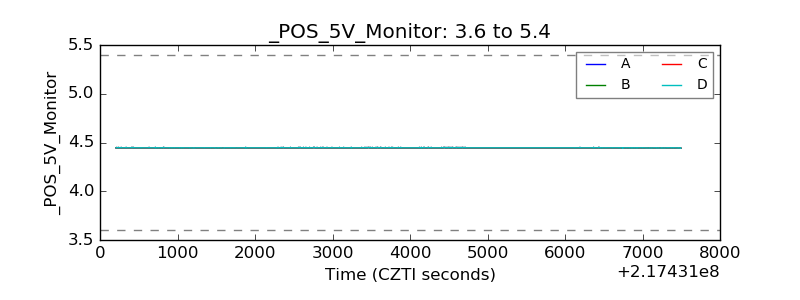 |
| _ROLL_ROT | 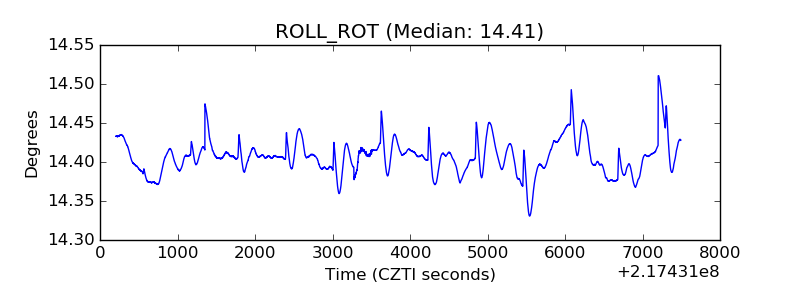 |
| _Roll_DEC | 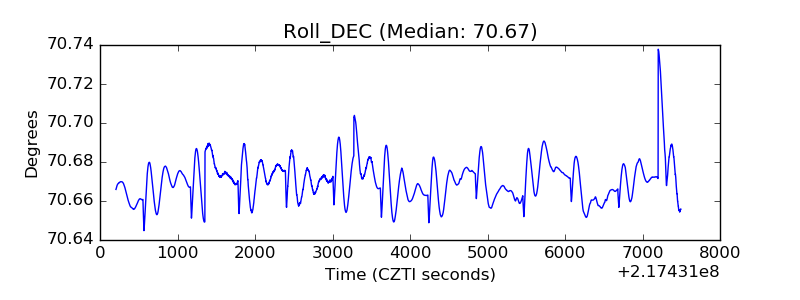 |
| _Roll_RA | 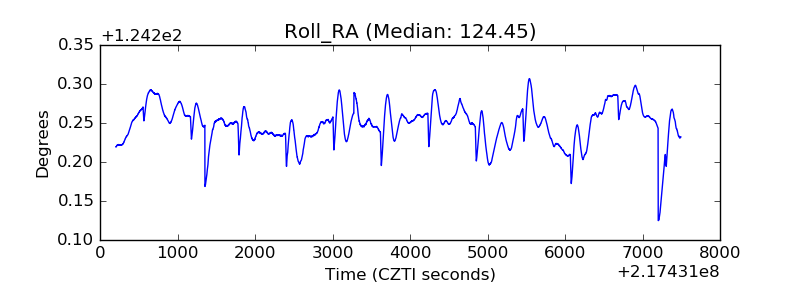 |
| Veto Counter | 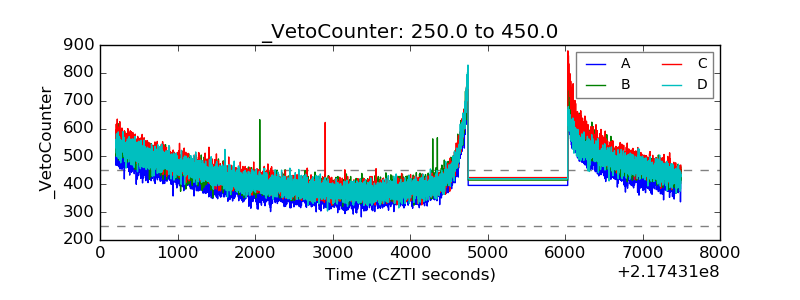 |