| Param | Original file | Final file |
|---|---|---|
| Filename | modeM0/AS1A02_046T01_9000000814_06225cztM0_level2.evt | modeM0/AS1A02_046T01_9000000814_06225cztM0_level2_quad_clean.evt |
| Size (bytes) | 473,604,480 | 121,783,680 |
| Size | 451.7 MB | 116.1 MB |
| Events in quadrant A | 4,536,897 | 807,945 |
| Events in quadrant B | 3,209,373 | 829,652 |
| Events in quadrant C | 2,921,665 | 821,742 |
| Events in quadrant D | 3,246,509 | 788,651 |
| Mode M9 | |||
|---|---|---|---|
| Quadrant | BADHDUFLAG | Total packets | Discarded packets |
| A | 0 | 14 | 0 |
| B | 0 | 14 | 0 |
| C | 0 | 14 | 0 |
| D | 0 | 15 | 0 |
| Mode M0 | |||
|---|---|---|---|
| Quadrant | BADHDUFLAG | Total packets | Discarded packets |
| A | 0 | 17837 | 3 |
| B | 0 | 13823 | 2 |
| C | 0 | 12978 | 2 |
| D | 0 | 13983 | 2 |
| Mode SS | |||
|---|---|---|---|
| Quadrant | BADHDUFLAG | Total packets | Discarded packets |
| A | 0 | 128 | 0 |
| B | 0 | 128 | 0 |
| C | 0 | 128 | 0 |
| D | 0 | 128 | 0 |
| Quadrant | Total seconds | Saturated seconds | Saturation percentage |
|---|---|---|---|
| A | 6315 | 163 | 2.581156% |
| B | 6315 | 115 | 1.821061% |
| C | 6315 | 67 | 1.060966% |
| D | 6315 | 89 | 1.409343% |
Noise dominated data is calculated using 1-second bins in cleaned event files. If a bin has >2000 counts, and if more than 50% of those come from <1% of pixels, then it is considered to be noise-dominated and hence unusable.
| Quadrant | # 1 sec bins | Bins with >0 counts | Bins with >2000 counts | High rate bins dominated by noise | Noise dominated (total time) | Noise dominated (detector-on time) | Marked lightcurve |
|---|---|---|---|---|---|---|---|
| A | 7530 | 6315 | 11 | 11 | 0.15% | 0.17% | 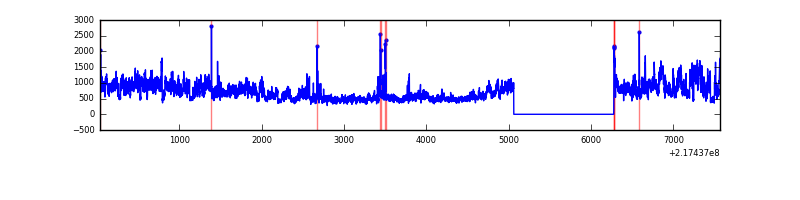 |
| B | 7530 | 6315 | 19 | 19 | 0.25% | 0.30% | 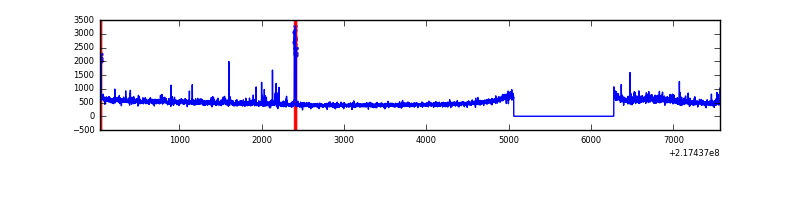 |
| C | 7530 | 6315 | 0 | 0 | 0.00% | 0.00% | 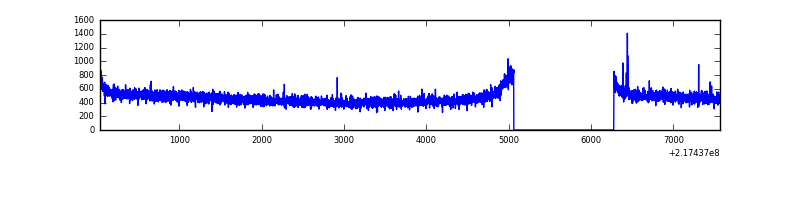 |
| D | 7530 | 6316 | 18 | 18 | 0.24% | 0.28% | 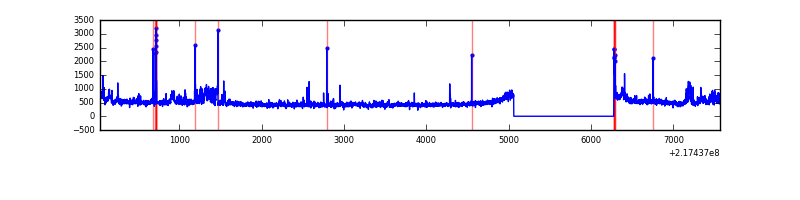 |
Top three noisy pixels from each quadrant. If the there are fewer than three noisy pixels in the level2.evt file, extra rows are filled as -1
| Pixel properties | Quadrant properties | ||||||
|---|---|---|---|---|---|---|---|
| Quadrant | DetID | PixID | Counts | Sigma | Mean | Median | Sigma |
| A | 13 | 34 | 1516050 | 10009.43 | 752 | 737 | 151.4 |
| A | 0 | 31 | 59821 | 390.28 | 752 | 737 | 151.4 |
| A | 8 | 15 | 49065 | 319.23 | 752 | 737 | 151.4 |
| B | 15 | 204 | 65210 | 454.95 | 762 | 744 | 141.7 |
| B | 15 | 54 | 44933 | 311.85 | 762 | 744 | 141.7 |
| B | 0 | 214 | 43601 | 302.45 | 762 | 744 | 141.7 |
| C | 9 | 16 | 6721 | 35.08 | 745 | 750 | 170.2 |
| C | 1 | 16 | 6150 | 31.72 | 745 | 750 | 170.2 |
| C | 13 | 61 | 5822 | 29.8 | 745 | 750 | 170.2 |
| D | 2 | 63 | 199256 | 1111.67 | 743 | 719 | 178.6 |
| D | 12 | 221 | 71321 | 395.32 | 743 | 719 | 178.6 |
| D | 5 | 97 | 53831 | 297.39 | 743 | 719 | 178.6 |
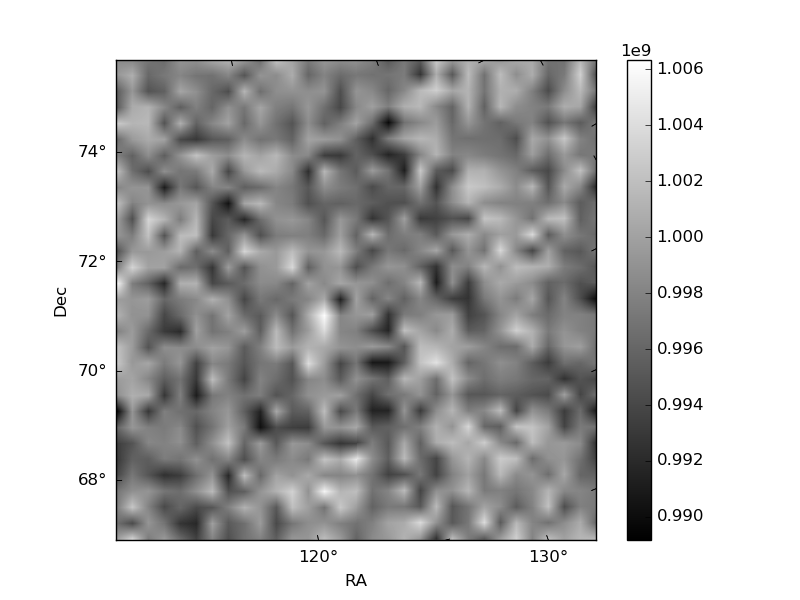
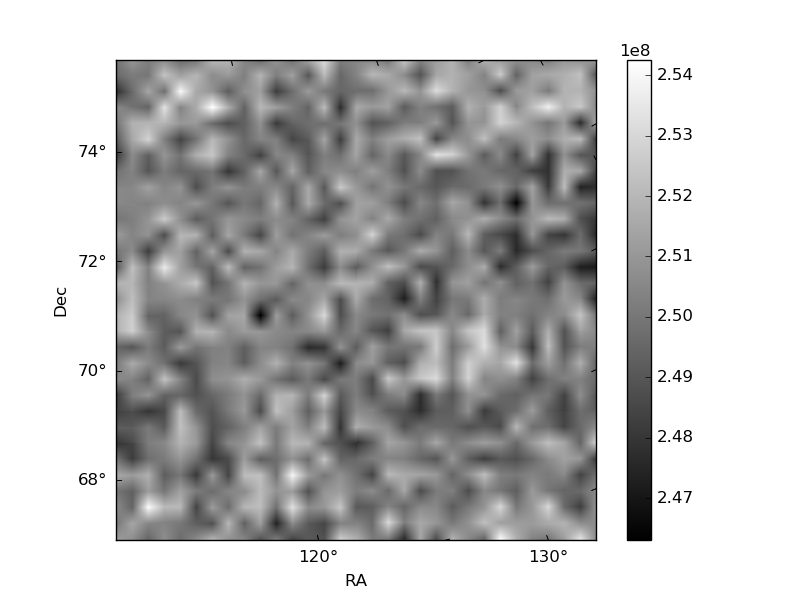
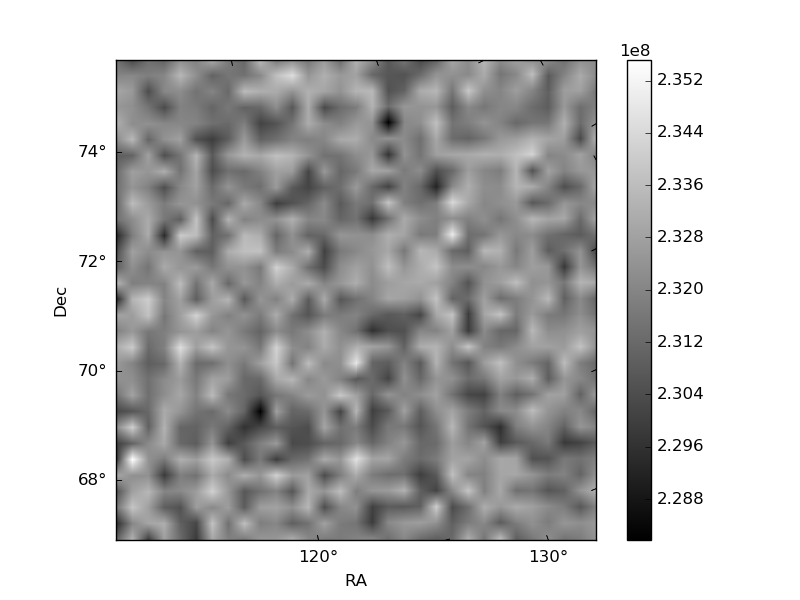
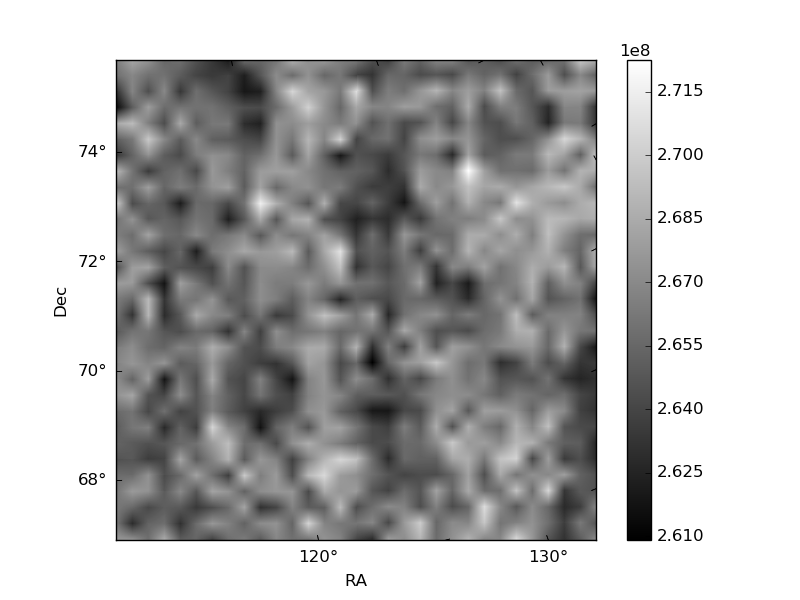
Histogram calculated using DETX and DETY for each event in the final _common_clean file
| Quadrant A | 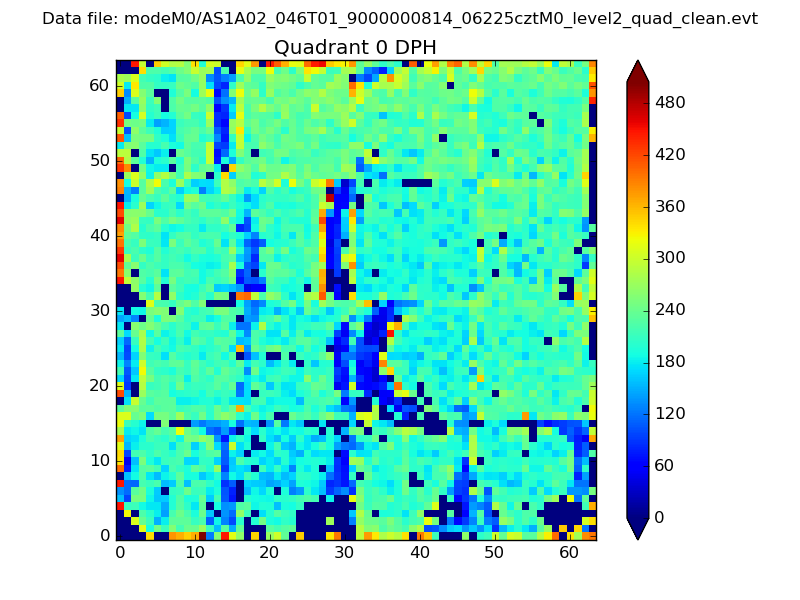 |
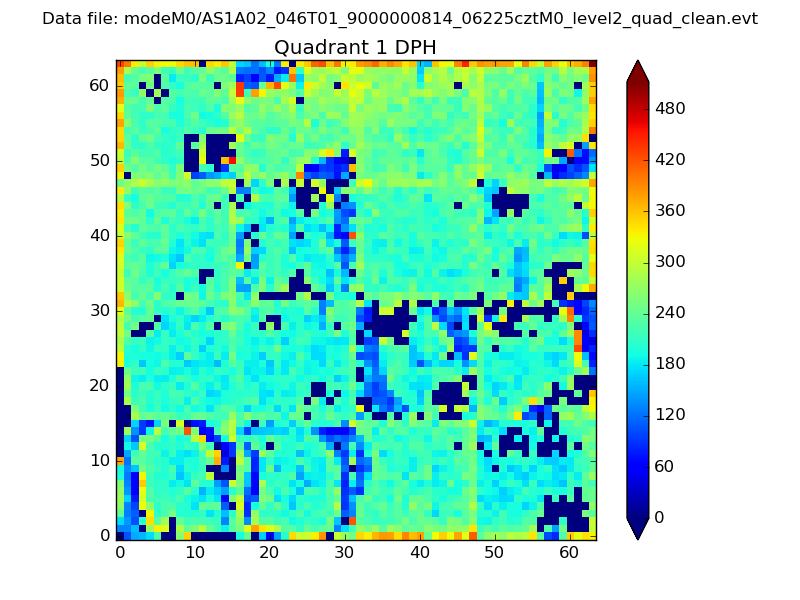 |
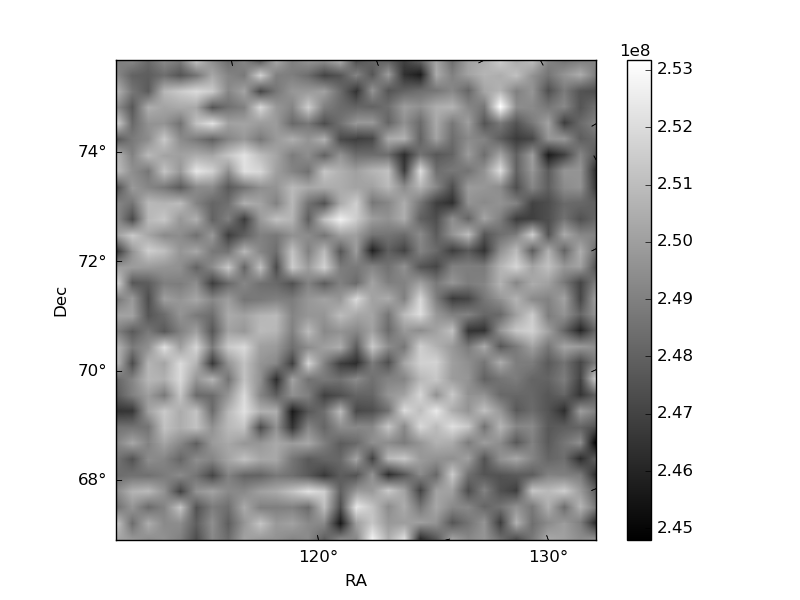
Quadrant B |
|---|---|---|---|
| Quadrant D | 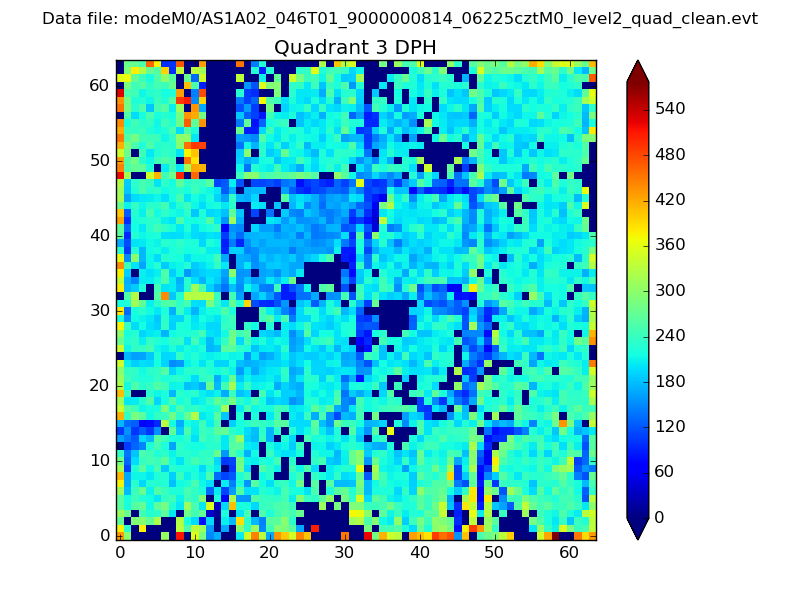 |
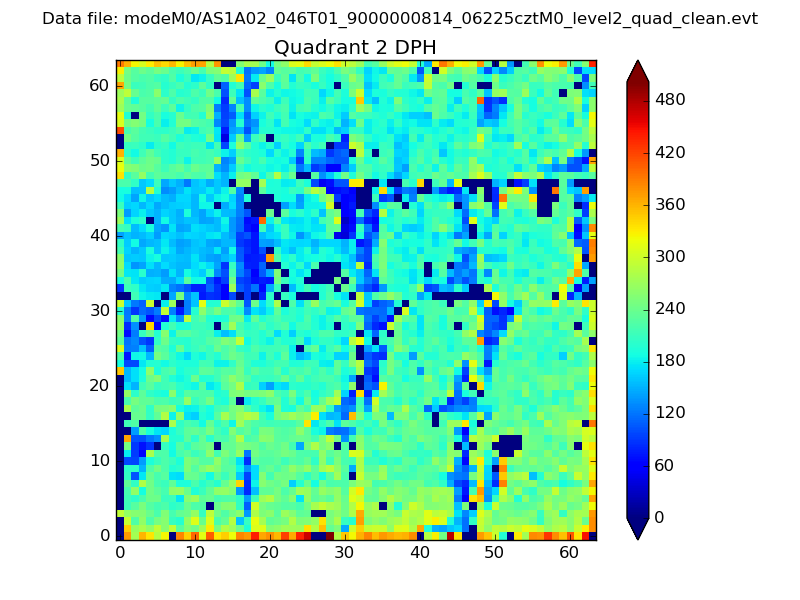 |
Quadrant C |
| Plot type | Count rate plots | Images |
|---|---|---|
| Comparison with Poisson distribution Blue bars denote a histogram of data divided into 1 sec bins. Red curve is a Poisson curve with rate = median count rate of data. |
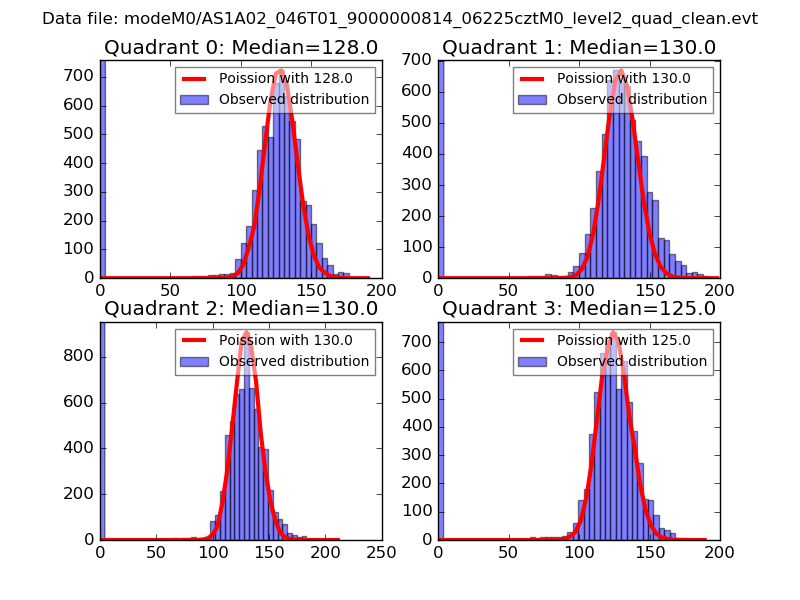 |
 |
| Quadrant-wise count rates Data is divided into 100 sec bins |
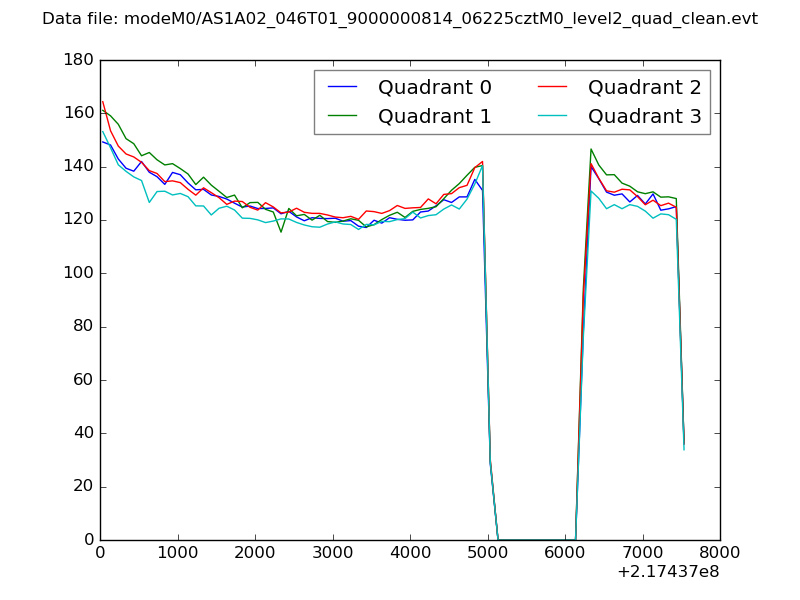 |
|
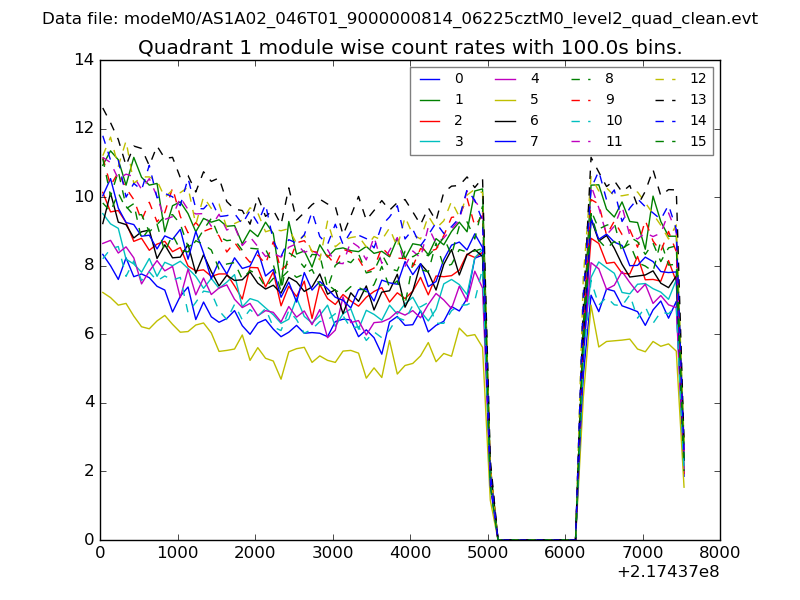
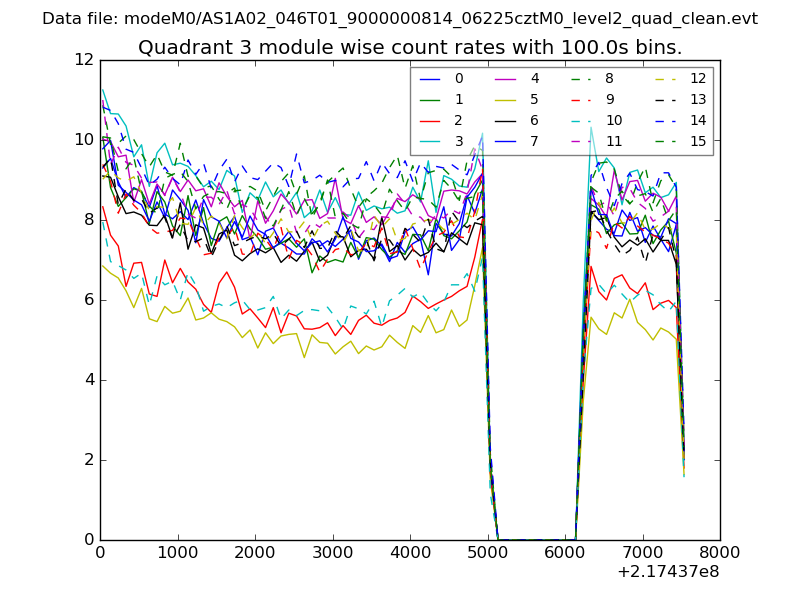
| Module-wise count rates for Quadrant A Data is divided into 100 sec bins |
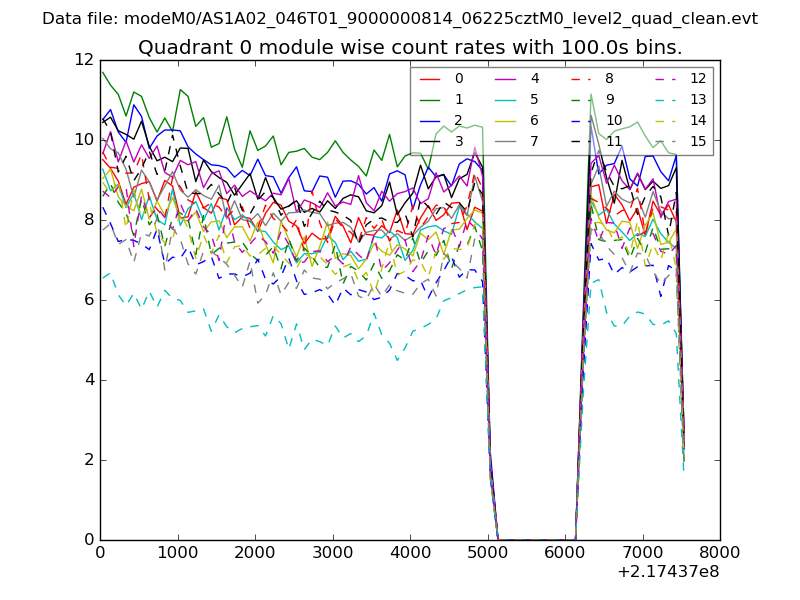 |
 |
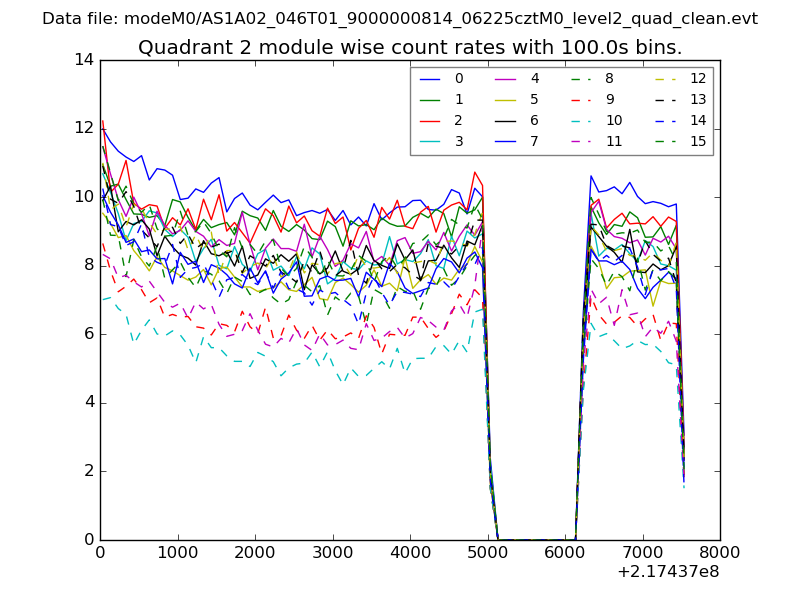
| Module-wise count rates for Quadrant B Data is divided into 100 sec bins |
 |
 |
| Module-wise count rates for Quadrant C Data is divided into 100 sec bins |
 |
 |
| Module-wise count rates for Quadrant D Data is divided into 100 sec bins |
 |
 |
| Parameter | Plot |
|---|---|
| CZT HV Monitor | 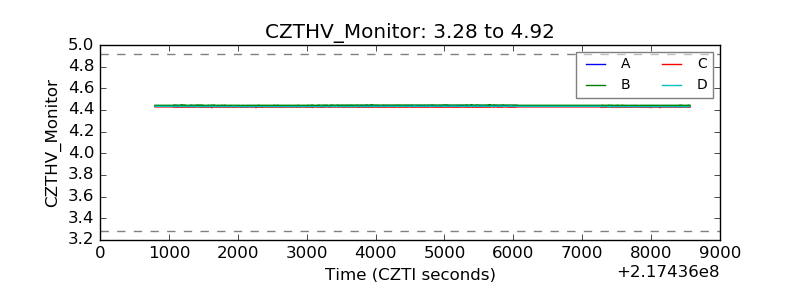 |
| D_VDD | 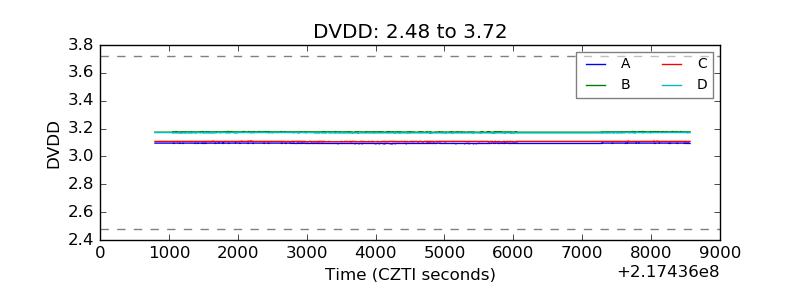 |
| Temperature 1 | 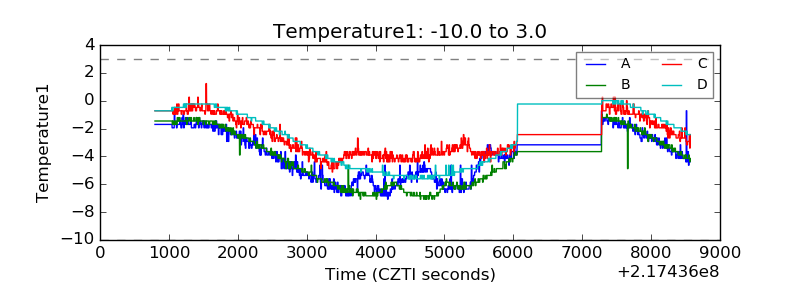 |
| Veto HV Monitor | 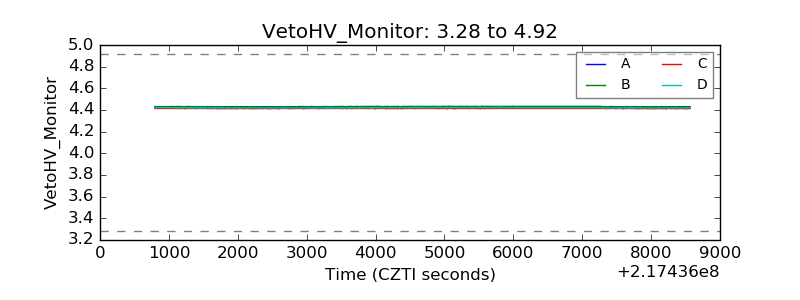 |
| Veto LLD | 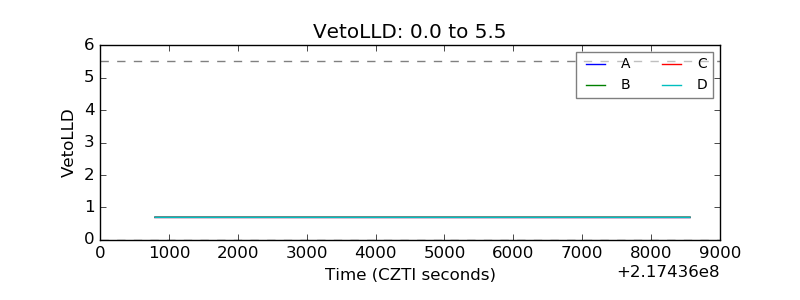 |
| Alpha Counter | 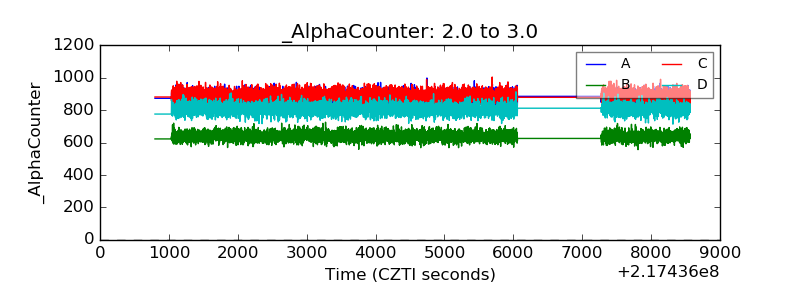 |
| _CPM_Rate | 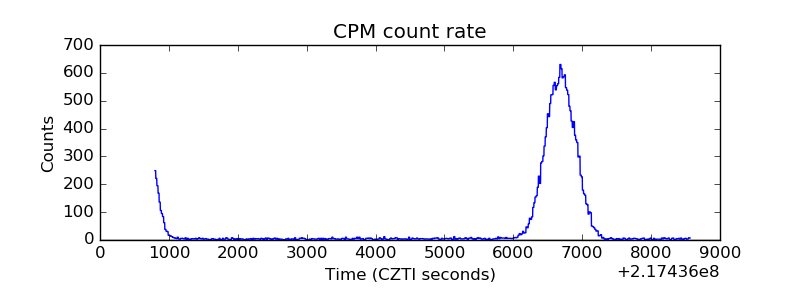 |
| CZT Counter | 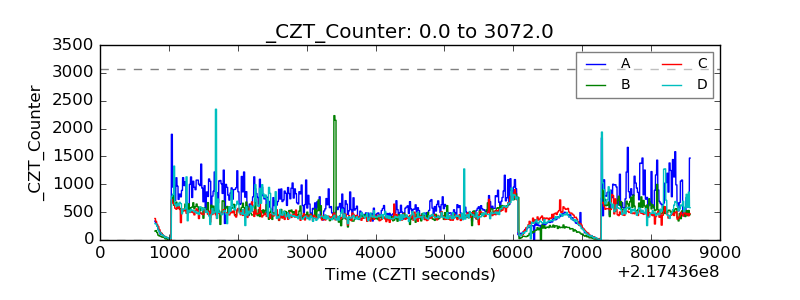 |
| +2.5 Volts monitor |  |
| +5 Volts monitor |  |
| _ROLL_ROT | 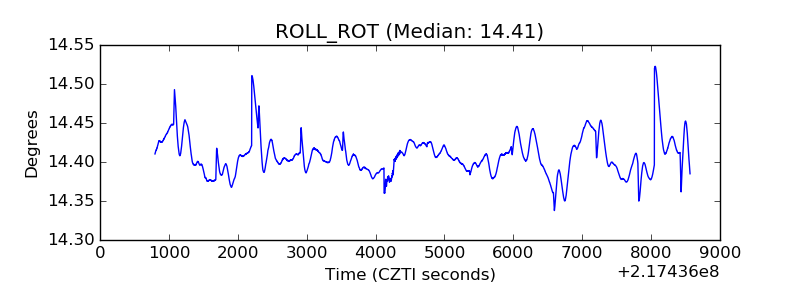 |
| _Roll_DEC | 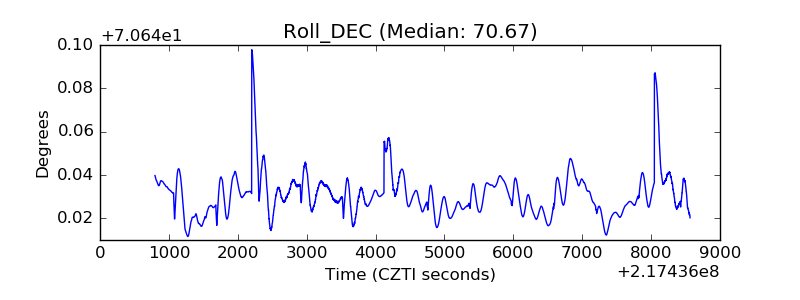 |
| _Roll_RA | 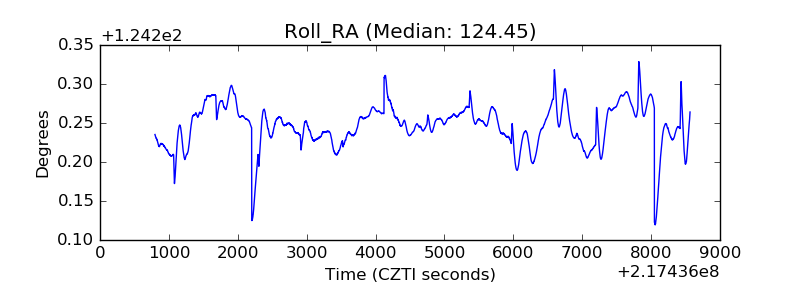 |
| Veto Counter | 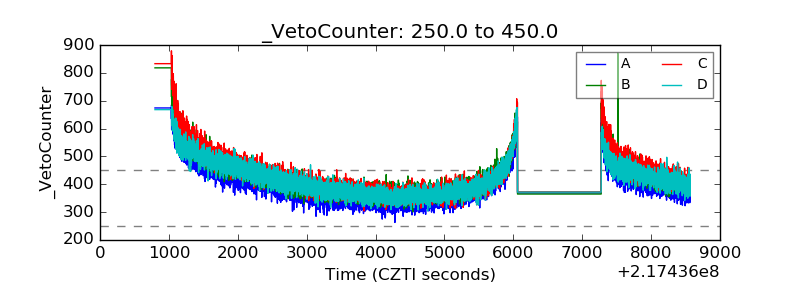 |