| Param | Original file | Final file |
|---|---|---|
| Filename | modeM0/AS1A02_046T01_9000000814_06226cztM0_level2.evt | modeM0/AS1A02_046T01_9000000814_06226cztM0_level2_quad_clean.evt |
| Size (bytes) | 496,670,400 | 124,047,360 |
| Size | 473.7 MB | 118.3 MB |
| Events in quadrant A | 4,389,222 | 819,073 |
| Events in quadrant B | 3,319,421 | 836,214 |
| Events in quadrant C | 3,000,983 | 834,301 |
| Events in quadrant D | 3,874,081 | 797,291 |
| Mode M9 | |||
|---|---|---|---|
| Quadrant | BADHDUFLAG | Total packets | Discarded packets |
| A | 0 | 9 | 0 |
| B | 0 | 9 | 0 |
| C | 0 | 9 | 0 |
| D | 0 | 10 | 0 |
| Mode M0 | |||
|---|---|---|---|
| Quadrant | BADHDUFLAG | Total packets | Discarded packets |
| A | 0 | 17665 | 3 |
| B | 0 | 14618 | 2 |
| C | 0 | 13752 | 2 |
| D | 0 | 16262 | 2 |
| Mode SS | |||
|---|---|---|---|
| Quadrant | BADHDUFLAG | Total packets | Discarded packets |
| A | 0 | 138 | 0 |
| B | 0 | 138 | 0 |
| C | 0 | 138 | 0 |
| D | 0 | 138 | 0 |
| Quadrant | Total seconds | Saturated seconds | Saturation percentage |
|---|---|---|---|
| A | 6743 | 147 | 2.180039% |
| B | 6743 | 62 | 0.919472% |
| C | 6743 | 28 | 0.415245% |
| D | 6743 | 76 | 1.127095% |
Noise dominated data is calculated using 1-second bins in cleaned event files. If a bin has >2000 counts, and if more than 50% of those come from <1% of pixels, then it is considered to be noise-dominated and hence unusable.
| Quadrant | # 1 sec bins | Bins with >0 counts | Bins with >2000 counts | High rate bins dominated by noise | Noise dominated (total time) | Noise dominated (detector-on time) | Marked lightcurve |
|---|---|---|---|---|---|---|---|
| A | 7693 | 6744 | 11 | 11 | 0.14% | 0.16% | 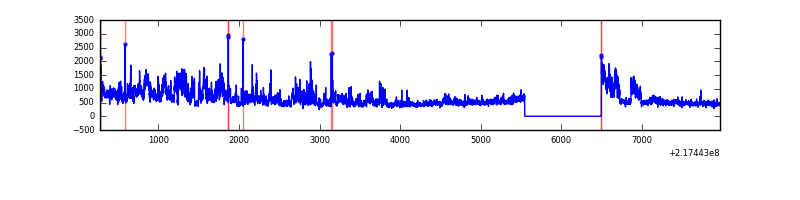 |
| B | 7693 | 6744 | 3 | 3 | 0.04% | 0.04% | 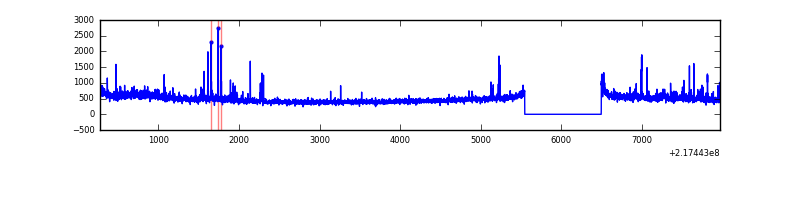 |
| C | 7693 | 6744 | 0 | 0 | 0.00% | 0.00% | 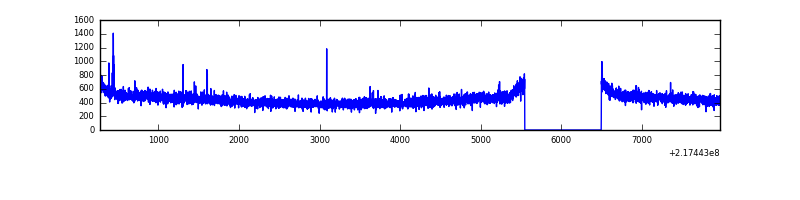 |
| D | 7693 | 6744 | 18 | 18 | 0.23% | 0.27% | 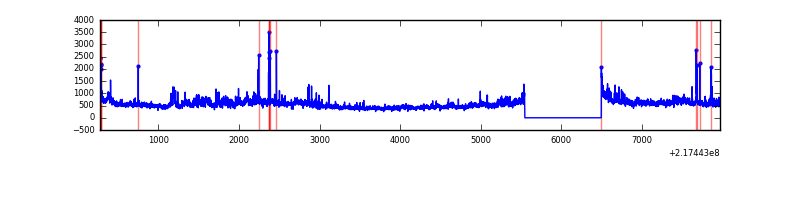 |
Top three noisy pixels from each quadrant. If the there are fewer than three noisy pixels in the level2.evt file, extra rows are filled as -1
| Pixel properties | Quadrant properties | ||||||
|---|---|---|---|---|---|---|---|
| Quadrant | DetID | PixID | Counts | Sigma | Mean | Median | Sigma |
| A | 13 | 34 | 1236265 | 7845.62 | 772 | 753 | 157.5 |
| A | 0 | 31 | 104072 | 656.09 | 772 | 753 | 157.5 |
| A | 8 | 15 | 75884 | 477.09 | 772 | 753 | 157.5 |
| B | 0 | 219 | 73796 | 495.21 | 784 | 765 | 147.5 |
| B | 15 | 204 | 72316 | 485.18 | 784 | 765 | 147.5 |
| B | 0 | 214 | 55517 | 371.27 | 784 | 765 | 147.5 |
| C | 1 | 16 | 12302 | 65.79 | 763 | 767 | 175.3 |
| C | 13 | 61 | 6174 | 30.84 | 763 | 767 | 175.3 |
| C | 9 | 16 | 5384 | 26.33 | 763 | 767 | 175.3 |
| D | 2 | 63 | 445052 | 2394.71 | 761 | 735 | 185.5 |
| D | 12 | 221 | 282241 | 1517.22 | 761 | 735 | 185.5 |
| D | 2 | 136 | 85992 | 459.51 | 761 | 735 | 185.5 |
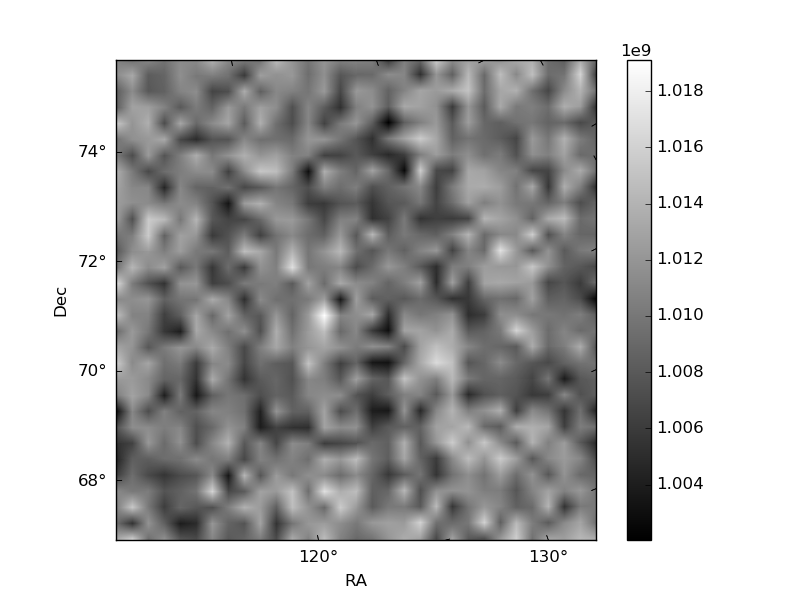
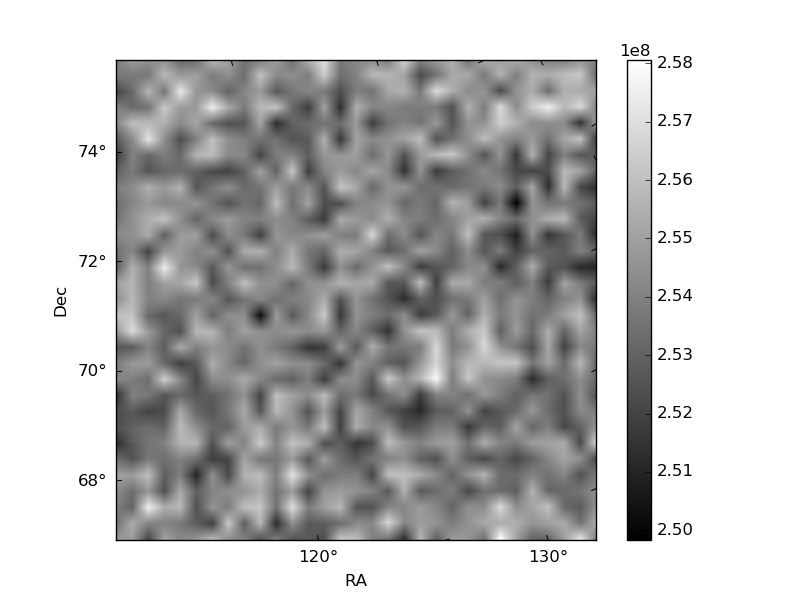
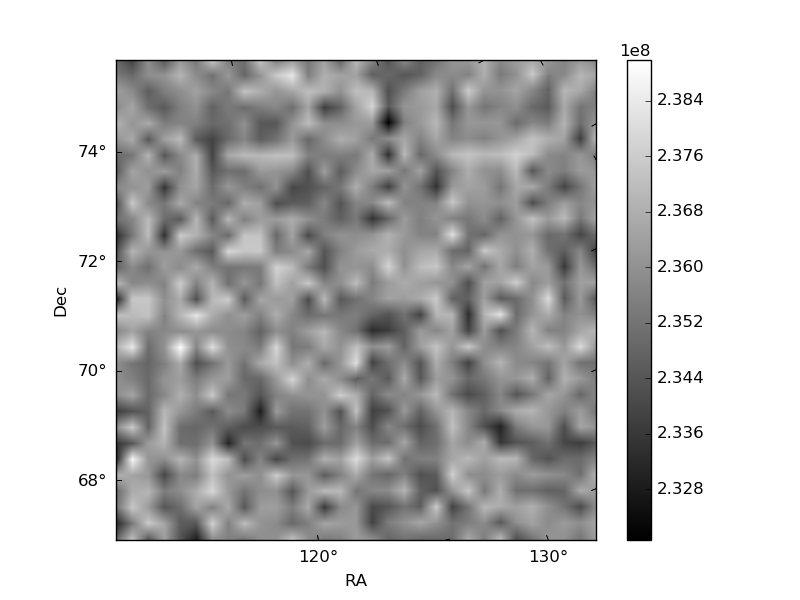
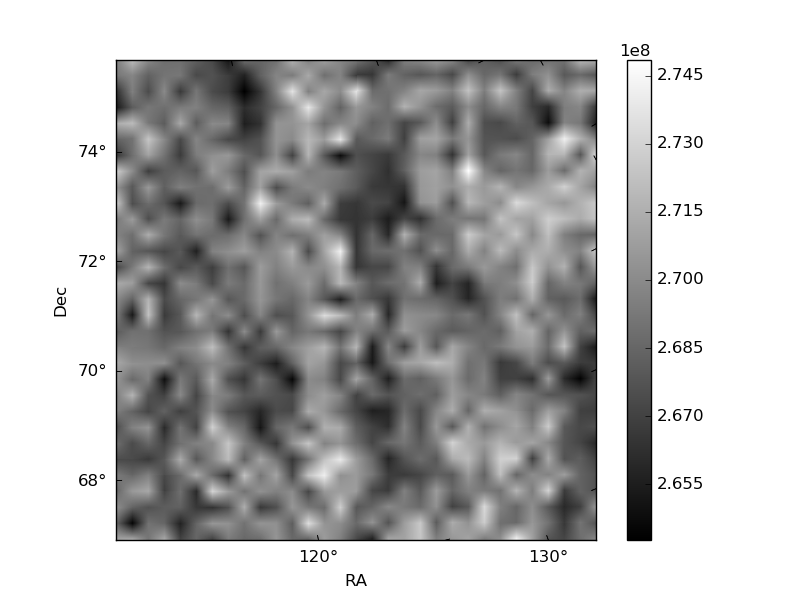
Histogram calculated using DETX and DETY for each event in the final _common_clean file
| Quadrant A | 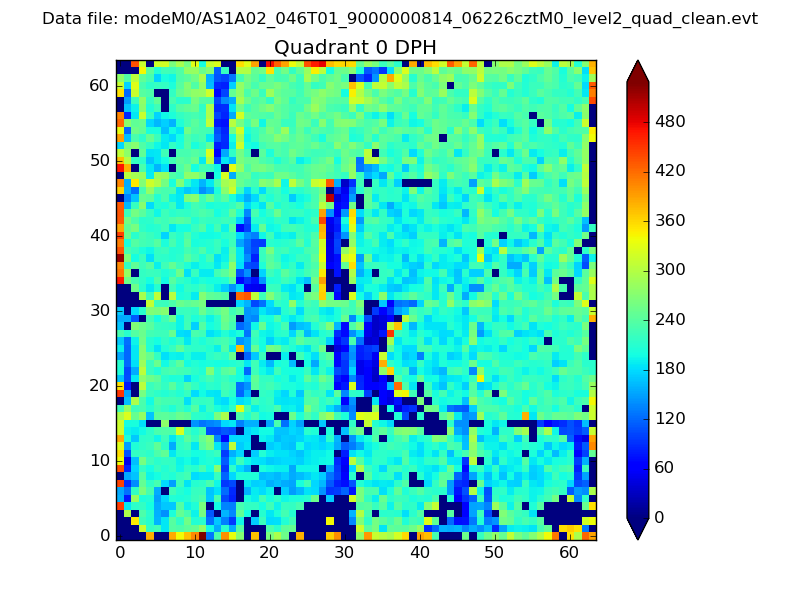 |
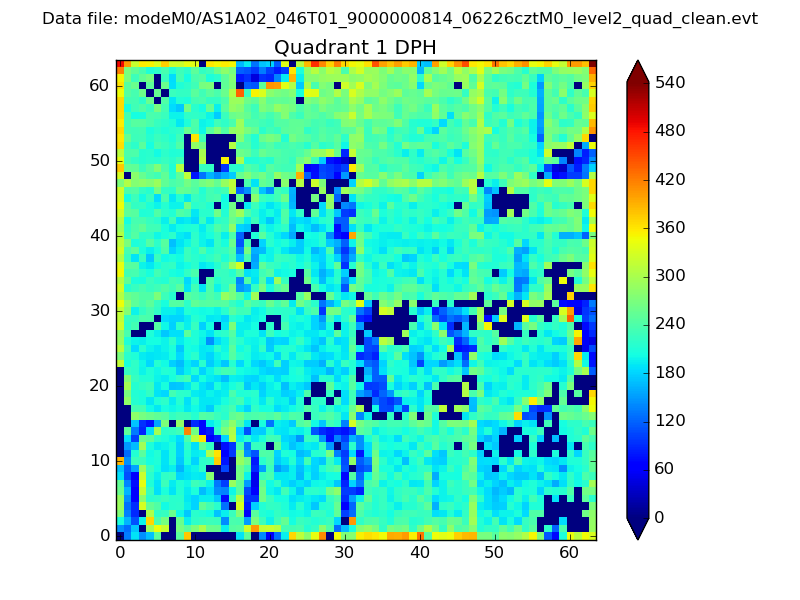 |
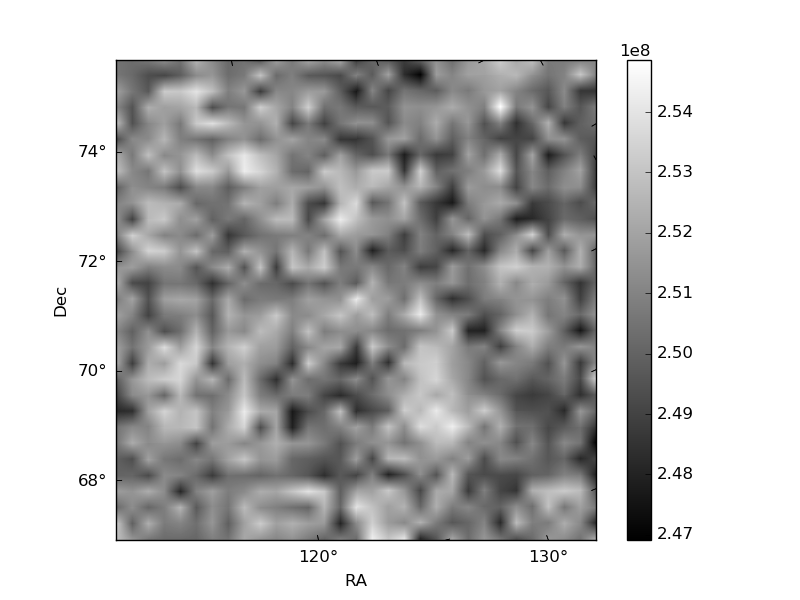
Quadrant B |
|---|---|---|---|
| Quadrant D | 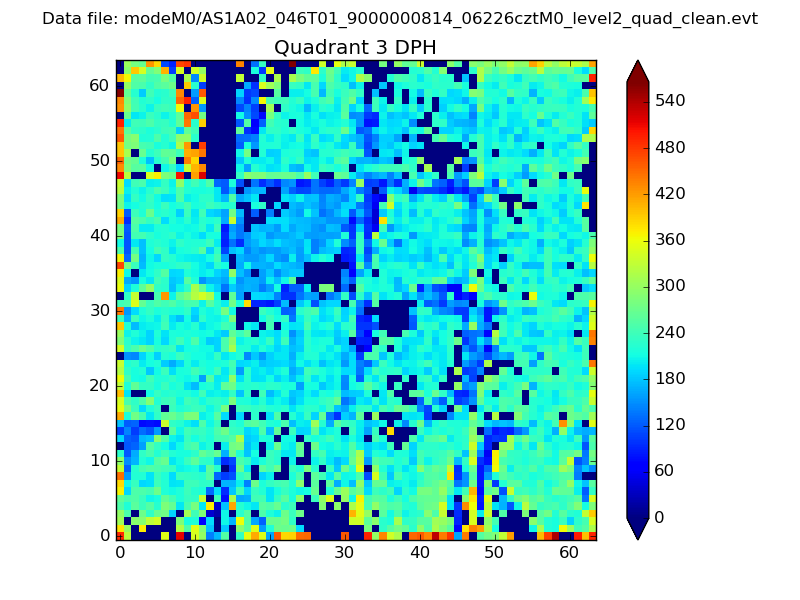 |
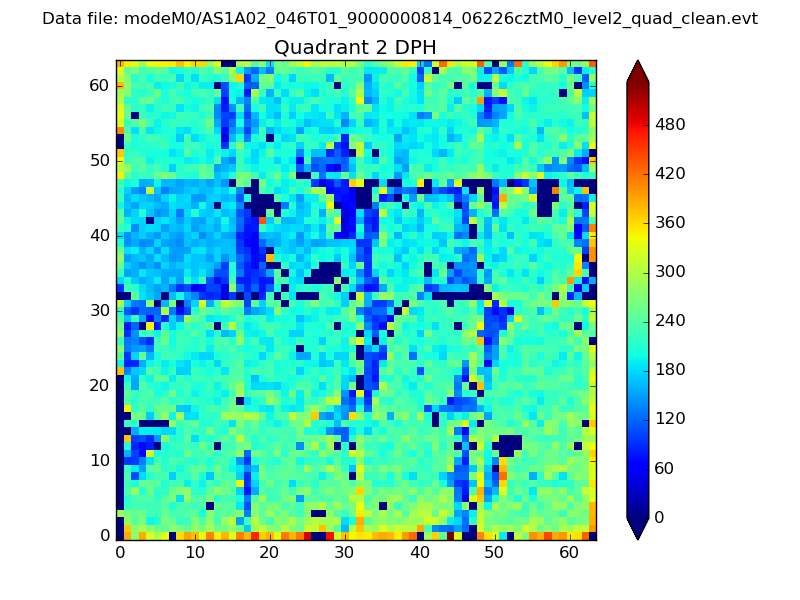 |
Quadrant C |
| Plot type | Count rate plots | Images |
|---|---|---|
| Comparison with Poisson distribution Blue bars denote a histogram of data divided into 1 sec bins. Red curve is a Poisson curve with rate = median count rate of data. |
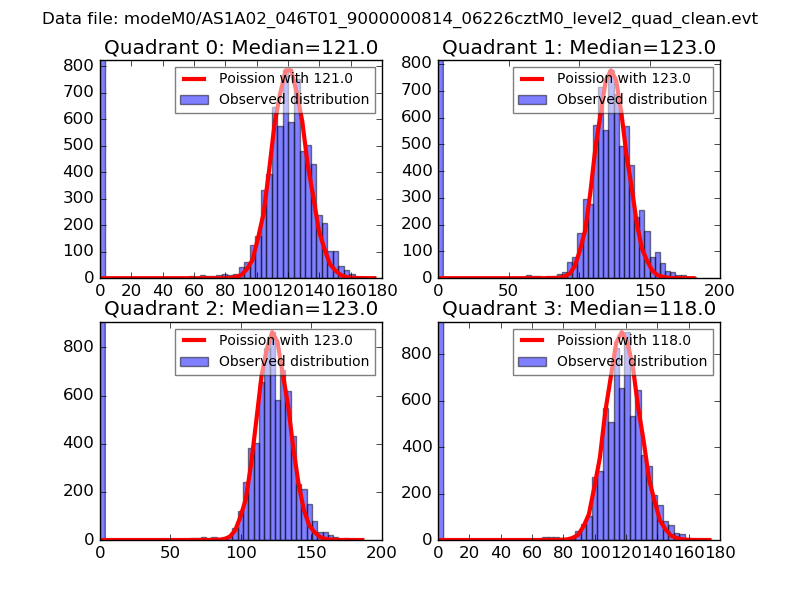 |
 |
| Quadrant-wise count rates Data is divided into 100 sec bins |
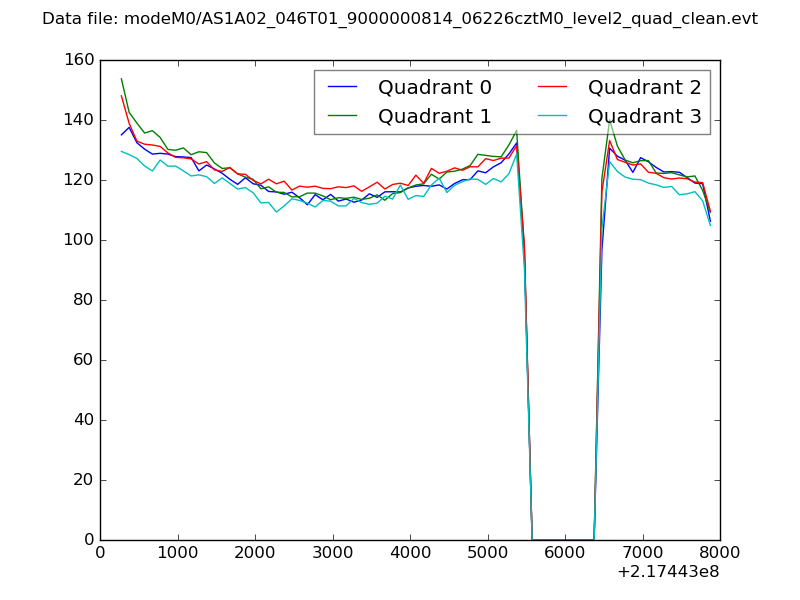 |
|
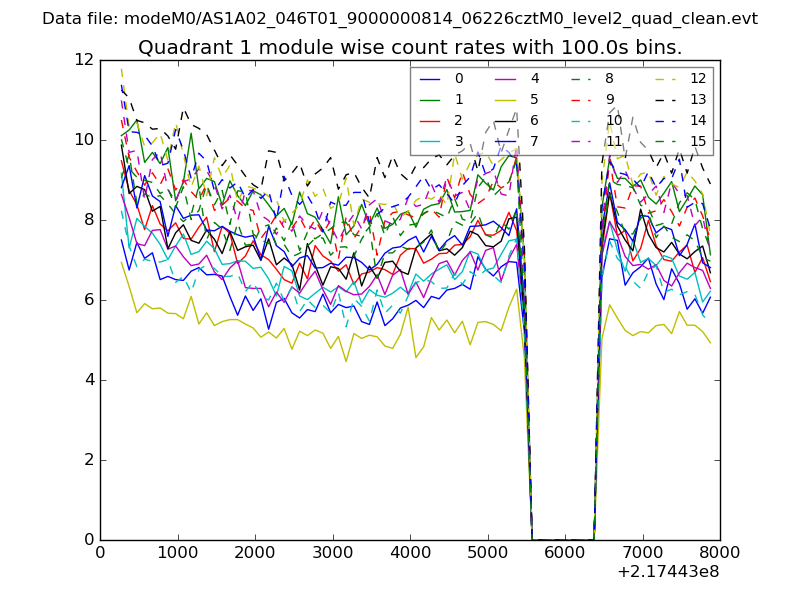
| Module-wise count rates for Quadrant A Data is divided into 100 sec bins |
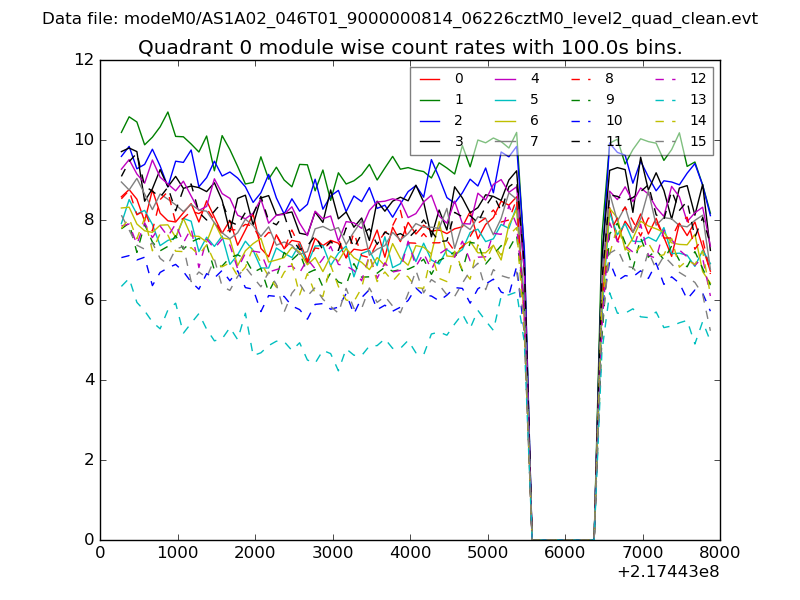 |
 |
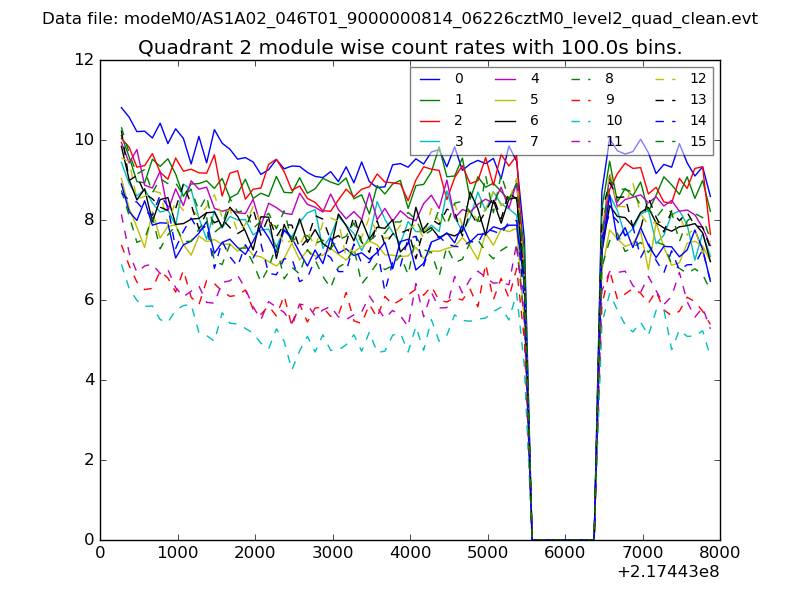
| Module-wise count rates for Quadrant B Data is divided into 100 sec bins |
 |
 |
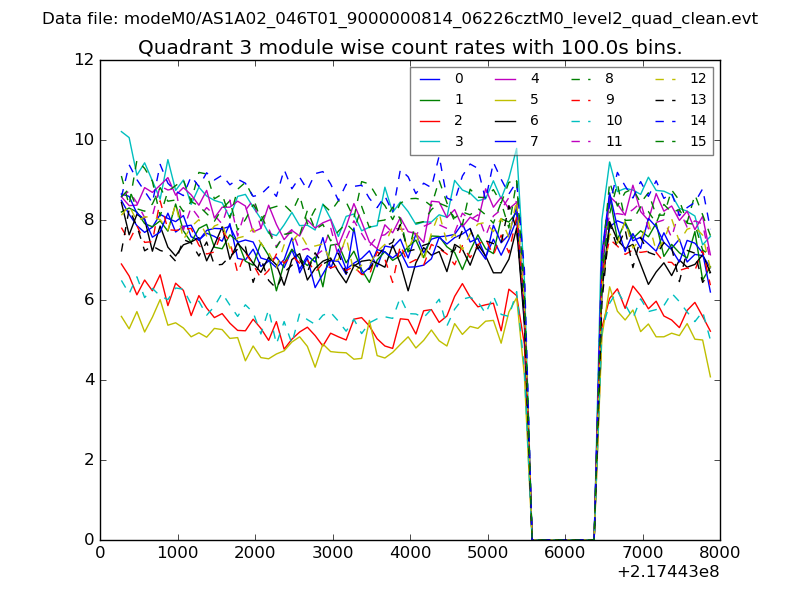
| Module-wise count rates for Quadrant C Data is divided into 100 sec bins |
 |
 |
| Module-wise count rates for Quadrant D Data is divided into 100 sec bins |
 |
 |
| Parameter | Plot |
|---|---|
| CZT HV Monitor | 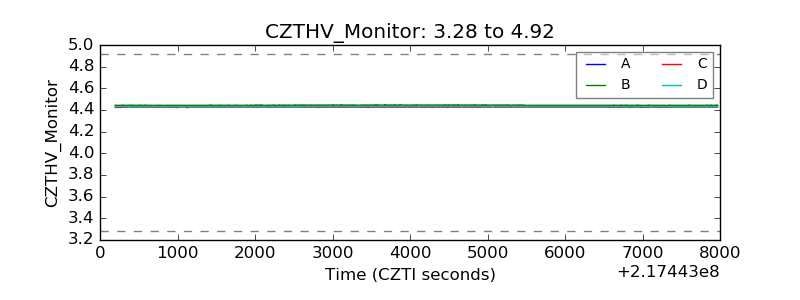 |
| D_VDD | 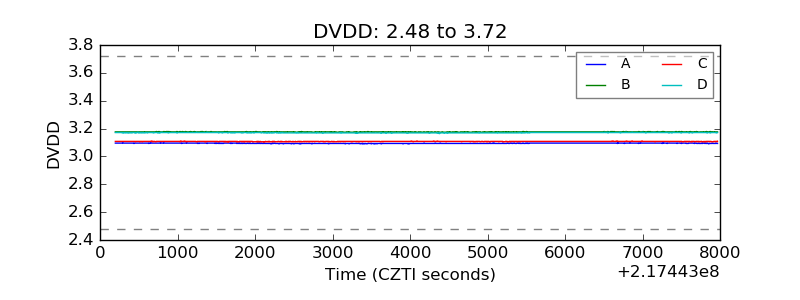 |
| Temperature 1 | 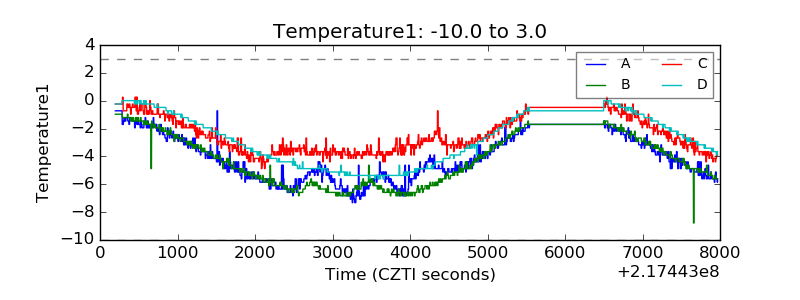 |
| Veto HV Monitor | 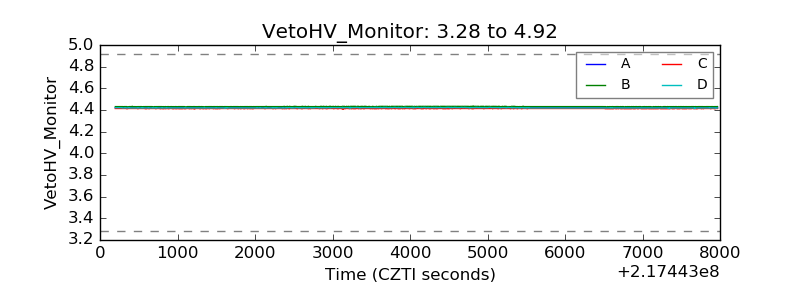 |
| Veto LLD | 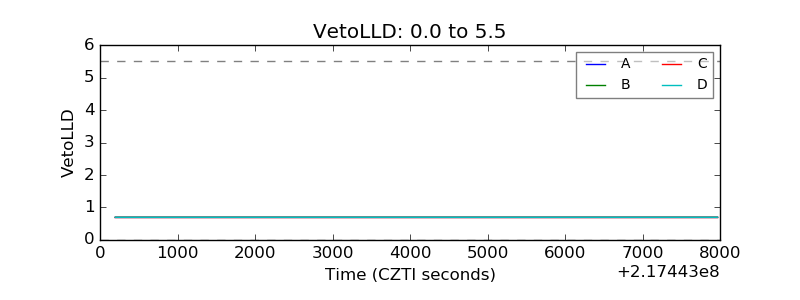 |
| Alpha Counter |  |
| _CPM_Rate | 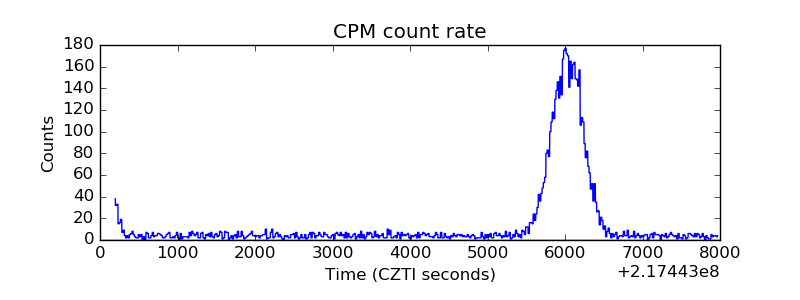 |
| CZT Counter | 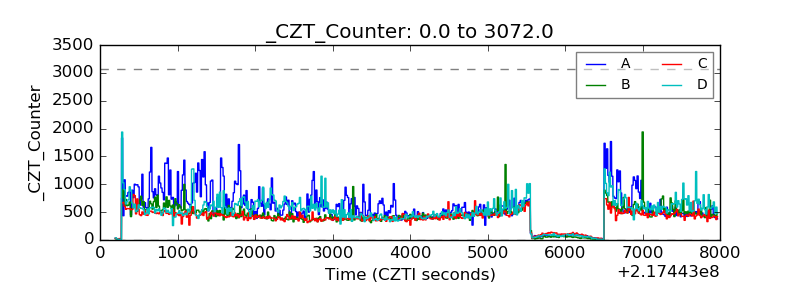 |
| +2.5 Volts monitor | 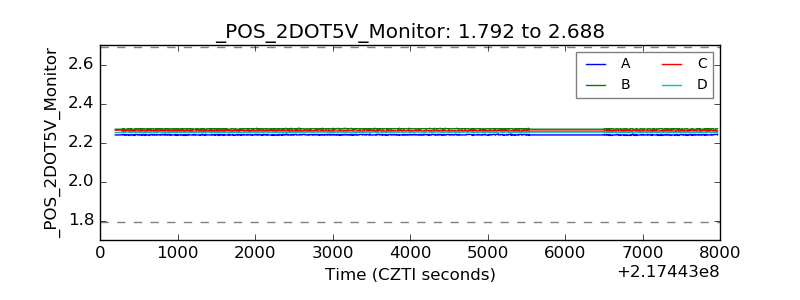 |
| +5 Volts monitor | 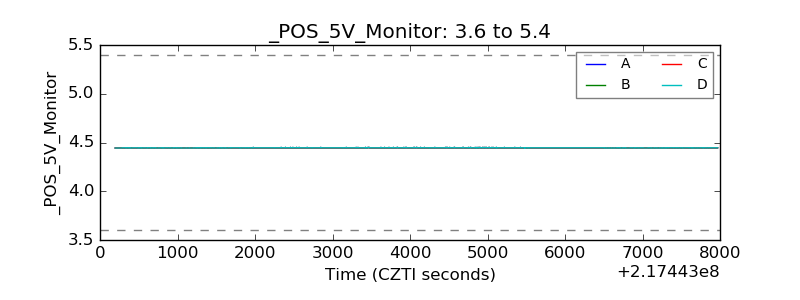 |
| _ROLL_ROT | 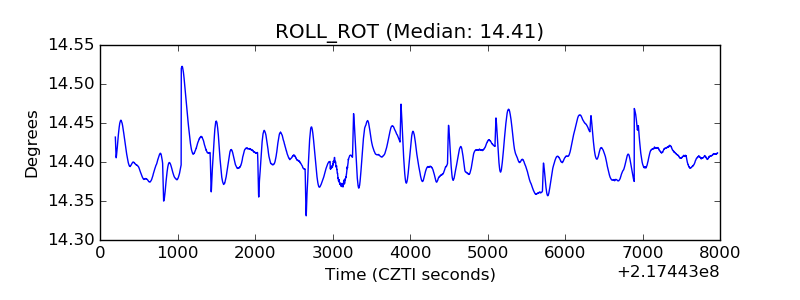 |
| _Roll_DEC | 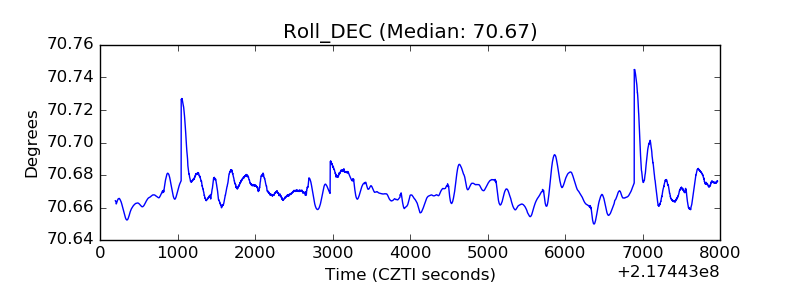 |
| _Roll_RA | 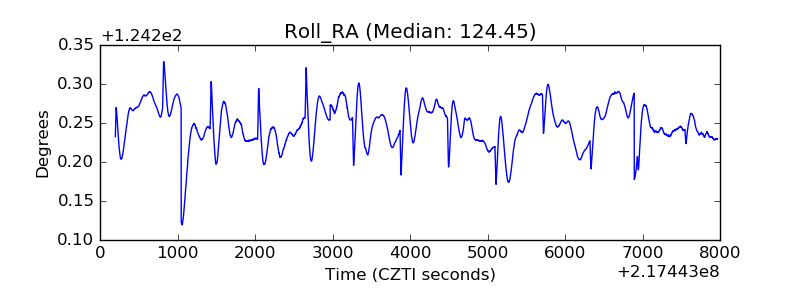 |
| Veto Counter | 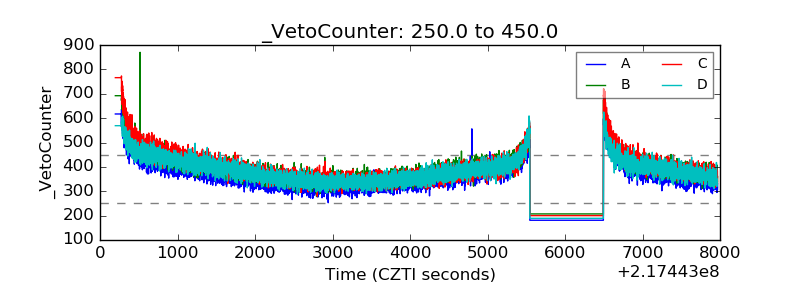 |