| Param | Original file | Final file |
|---|---|---|
| Filename | modeM0/AS1A02_046T01_9000000814_06227cztM0_level2.evt | modeM0/AS1A02_046T01_9000000814_06227cztM0_level2_quad_clean.evt |
| Size (bytes) | 146,180,160 | 35,075,520 |
| Size | 139.4 MB | 33.5 MB |
| Events in quadrant A | 1,133,589 | 231,707 |
| Events in quadrant B | 1,019,089 | 234,593 |
| Events in quadrant C | 877,999 | 232,593 |
| Events in quadrant D | 1,263,934 | 223,512 |
| Mode M0 | |||
|---|---|---|---|
| Quadrant | BADHDUFLAG | Total packets | Discarded packets |
| A | 0 | 4647 | 0 |
| B | 0 | 4283 | 0 |
| C | 0 | 3915 | 0 |
| D | 0 | 5153 | 0 |
| Mode SS | |||
|---|---|---|---|
| Quadrant | BADHDUFLAG | Total packets | Discarded packets |
| A | 0 | 38 | 0 |
| B | 0 | 38 | 0 |
| C | 0 | 38 | 0 |
| D | 0 | 38 | 0 |
| Quadrant | Total seconds | Saturated seconds | Saturation percentage |
|---|---|---|---|
| A | 1912 | 71 | 3.713389% |
| B | 1912 | 27 | 1.412134% |
| C | 1912 | 5 | 0.261506% |
| D | 1912 | 25 | 1.307531% |
Noise dominated data is calculated using 1-second bins in cleaned event files. If a bin has >2000 counts, and if more than 50% of those come from <1% of pixels, then it is considered to be noise-dominated and hence unusable.
| Quadrant | # 1 sec bins | Bins with >0 counts | Bins with >2000 counts | High rate bins dominated by noise | Noise dominated (total time) | Noise dominated (detector-on time) | Marked lightcurve |
|---|---|---|---|---|---|---|---|
| A | 1912 | 1912 | 2 | 2 | 0.10% | 0.10% | 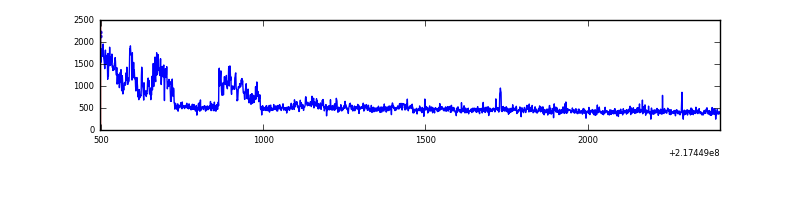 |
| B | 1912 | 1912 | 4 | 4 | 0.21% | 0.21% | 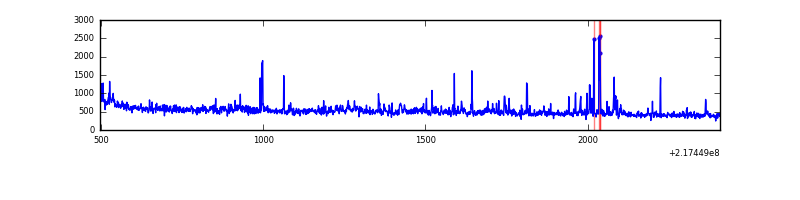 |
| C | 1912 | 1912 | 0 | 0 | 0.00% | 0.00% | 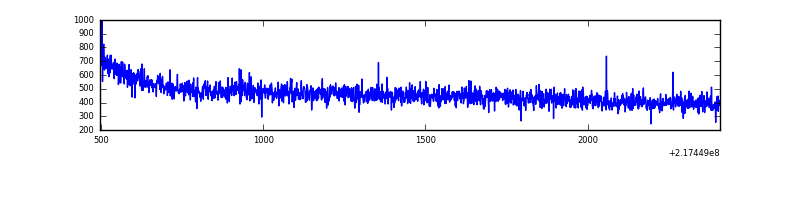 |
| D | 1912 | 1912 | 5 | 5 | 0.26% | 0.26% | 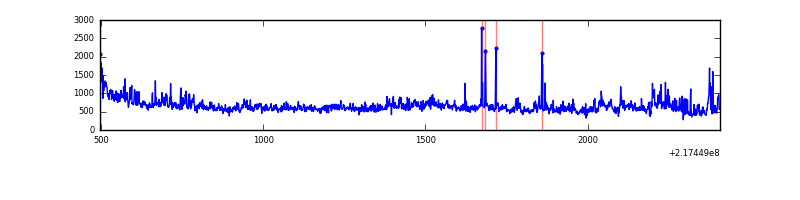 |
Top three noisy pixels from each quadrant. If the there are fewer than three noisy pixels in the level2.evt file, extra rows are filled as -1
| Pixel properties | Quadrant properties | ||||||
|---|---|---|---|---|---|---|---|
| Quadrant | DetID | PixID | Counts | Sigma | Mean | Median | Sigma |
| A | 13 | 34 | 241994 | 5121.54 | 221 | 216 | 47.2 |
| A | 8 | 15 | 29197 | 613.9 | 221 | 216 | 47.2 |
| A | 0 | 31 | 5958 | 121.63 | 221 | 216 | 47.2 |
| B | 0 | 219 | 49819 | 1117.97 | 227 | 221 | 44.4 |
| B | 15 | 204 | 41095 | 921.33 | 227 | 221 | 44.4 |
| B | 0 | 245 | 17798 | 396.2 | 227 | 221 | 44.4 |
| C | 13 | 61 | 1796 | 29.44 | 224 | 224 | 53.4 |
| C | 1 | 16 | 1608 | 25.92 | 224 | 224 | 53.4 |
| C | 8 | 222 | 898 | 12.62 | 224 | 224 | 53.4 |
| D | 12 | 221 | 205566 | 3725.91 | 222 | 214 | 55.1 |
| D | 2 | 136 | 108816 | 1970.48 | 222 | 214 | 55.1 |
| D | 2 | 63 | 74644 | 1350.46 | 222 | 214 | 55.1 |
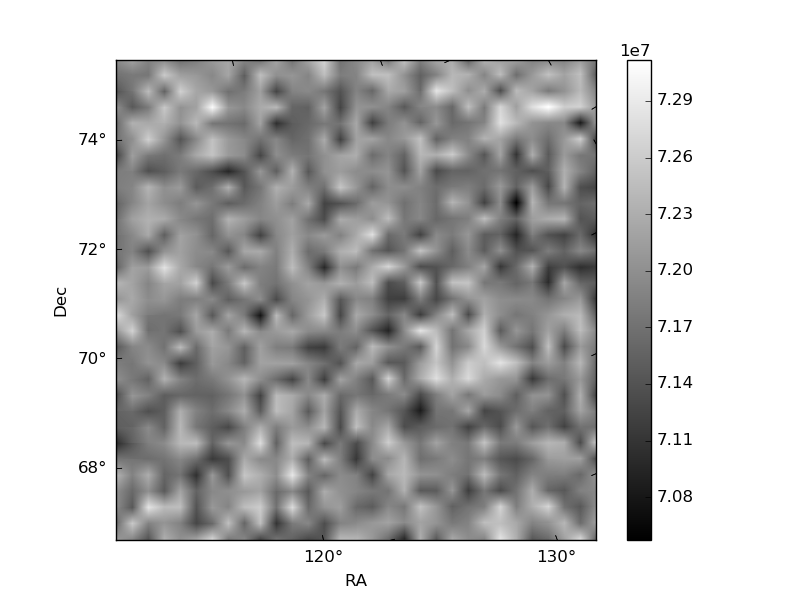
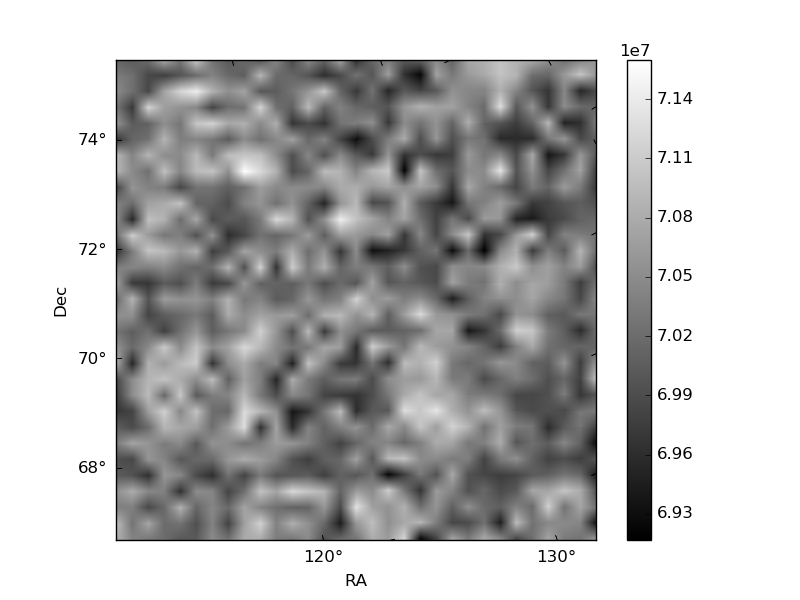
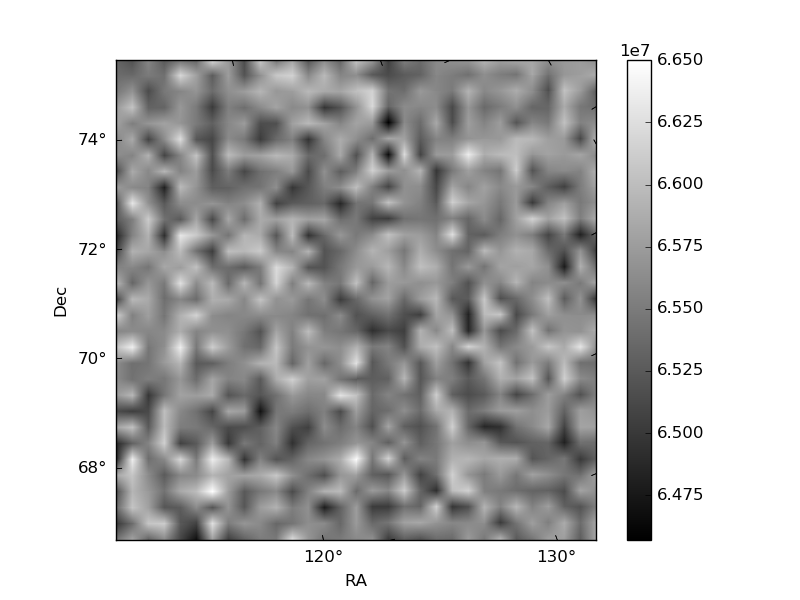
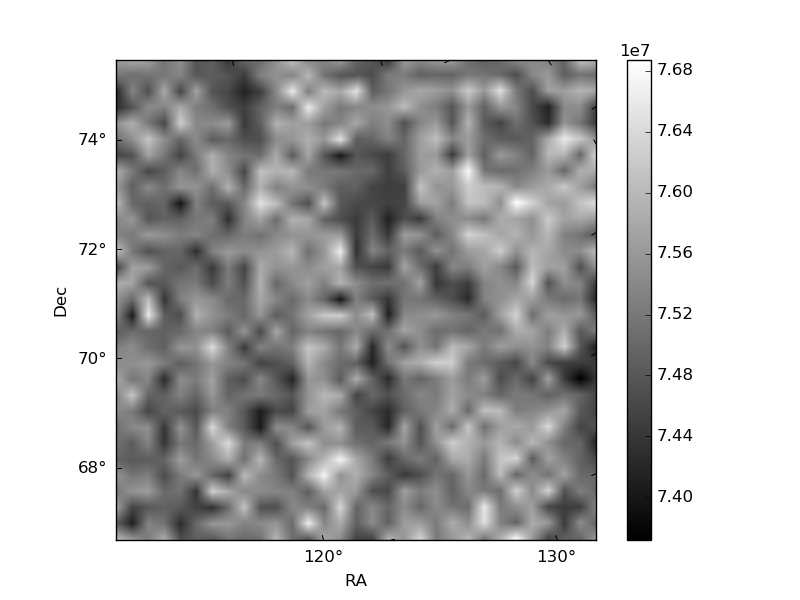
Histogram calculated using DETX and DETY for each event in the final _common_clean file
| Quadrant A | 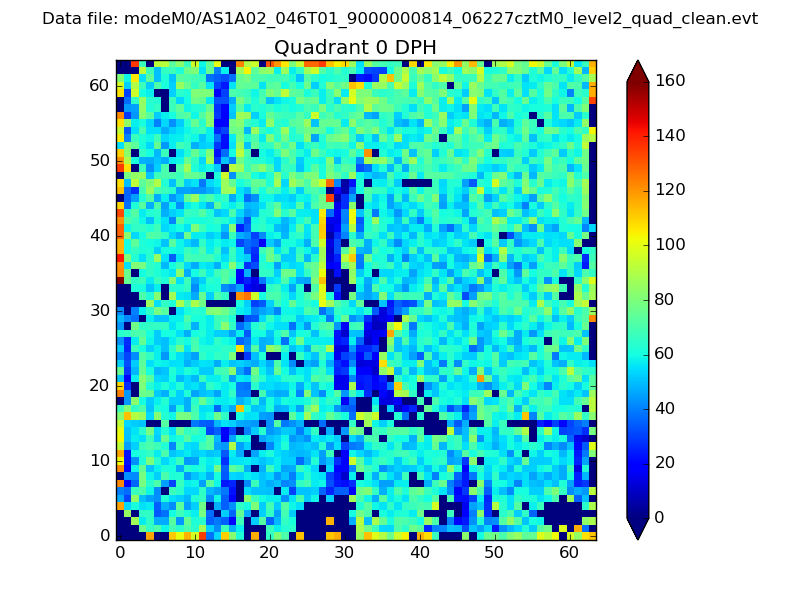 |
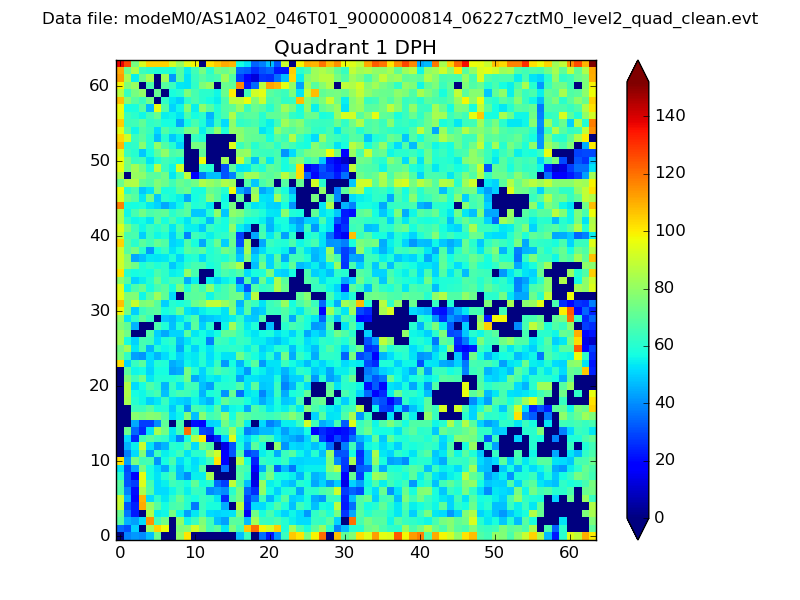 |
Quadrant B |
|---|---|---|---|
| Quadrant D | 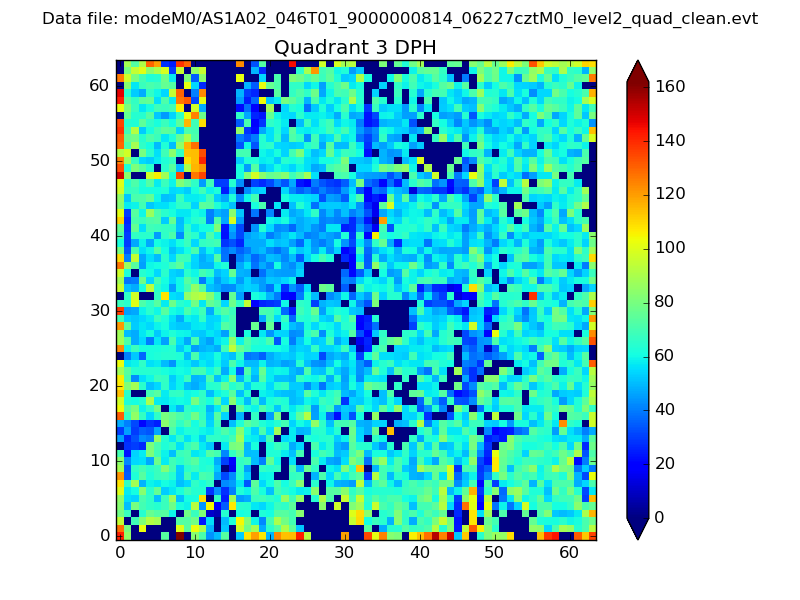 |
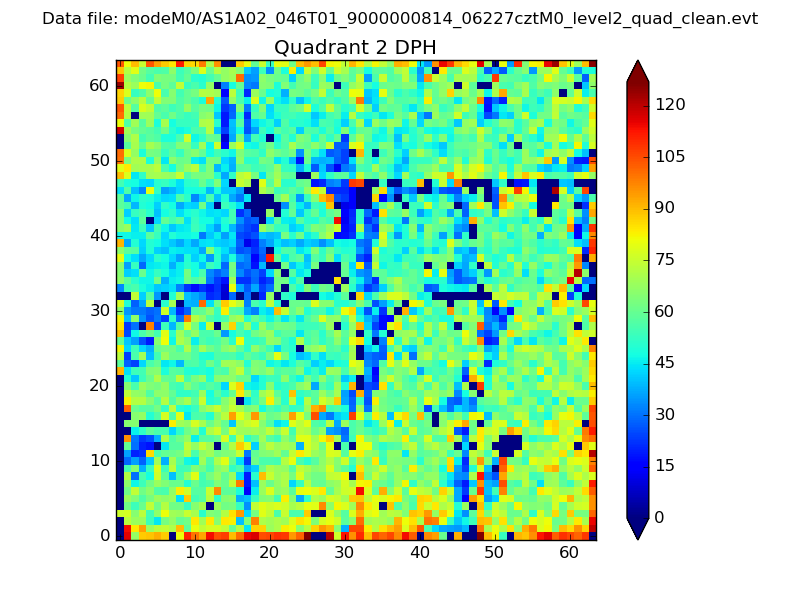 |
Quadrant C |
| Plot type | Count rate plots | Images |
|---|---|---|
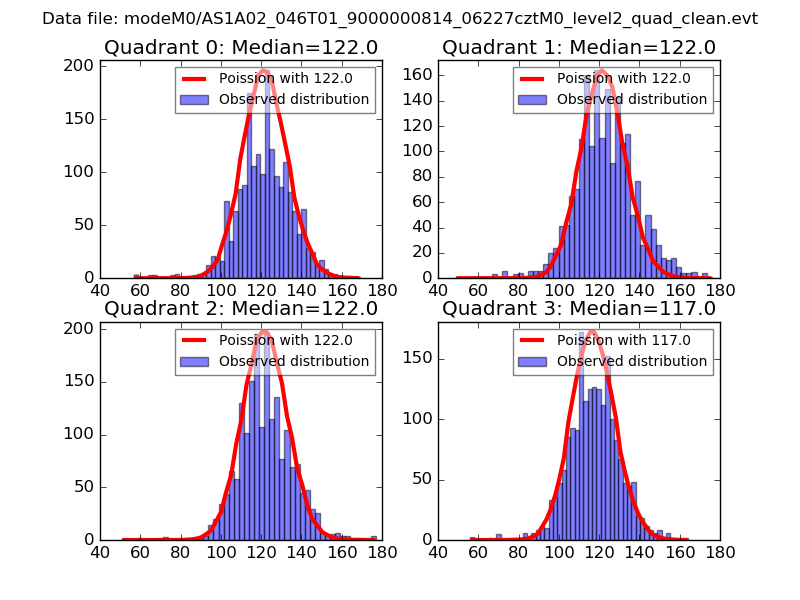
| Comparison with Poisson distribution Blue bars denote a histogram of data divided into 1 sec bins. Red curve is a Poisson curve with rate = median count rate of data. |
 |
 |
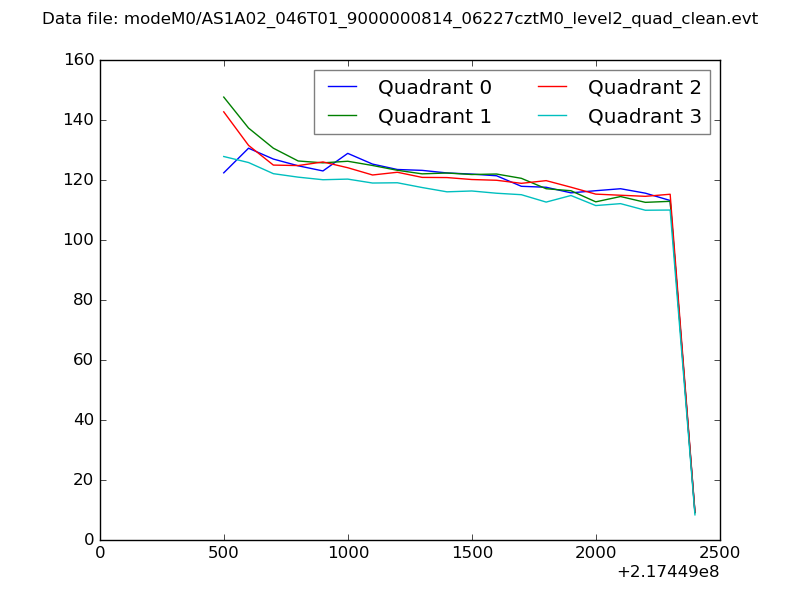
| Quadrant-wise count rates Data is divided into 100 sec bins |
 |
|
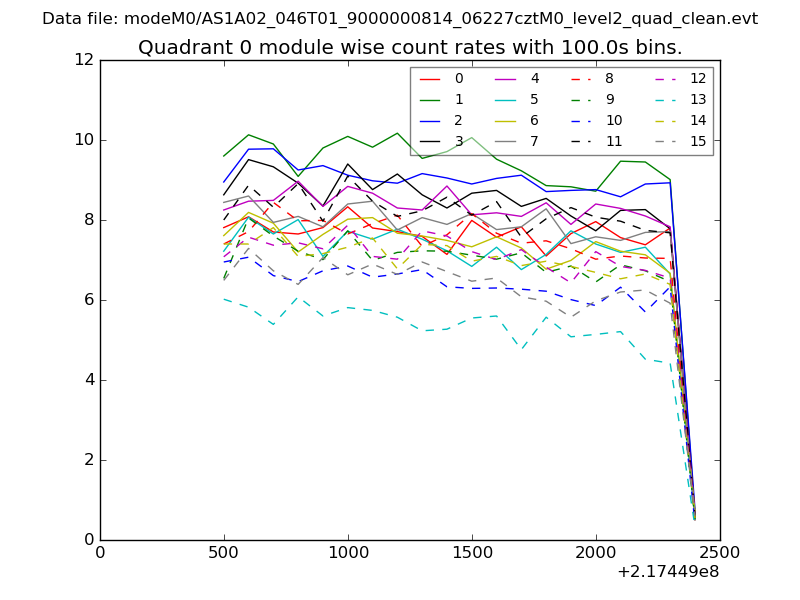
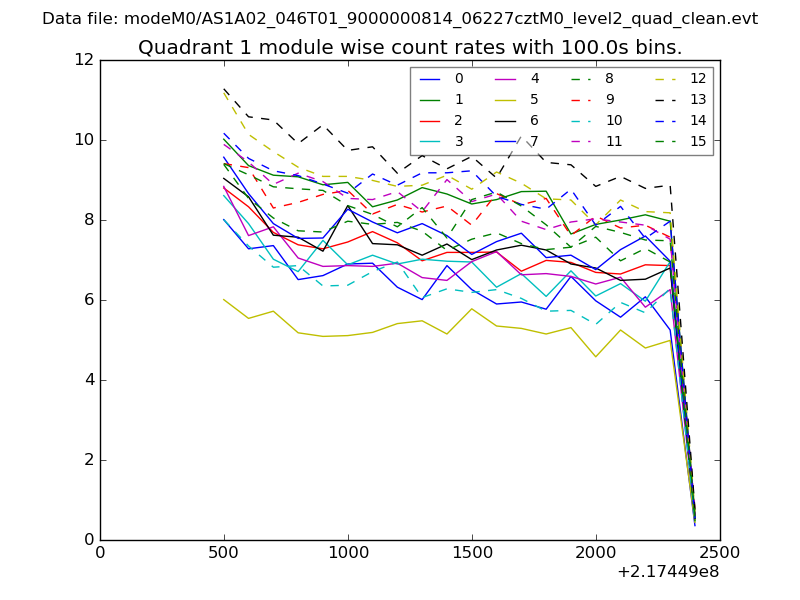
| Module-wise count rates for Quadrant A Data is divided into 100 sec bins |
 |
 |
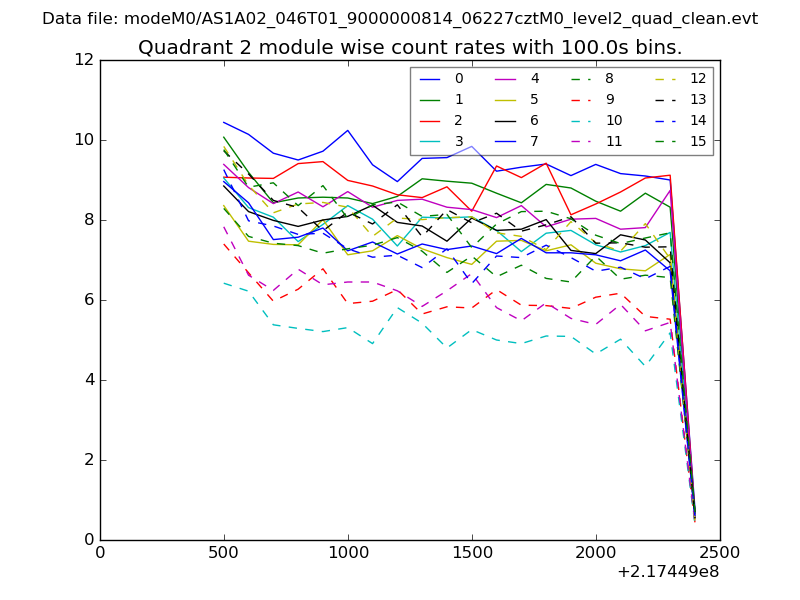
| Module-wise count rates for Quadrant B Data is divided into 100 sec bins |
 |
 |
| Module-wise count rates for Quadrant C Data is divided into 100 sec bins |
 |
 |
| Module-wise count rates for Quadrant D Data is divided into 100 sec bins |
 |
 |
| Parameter | Plot |
|---|---|
| CZT HV Monitor | 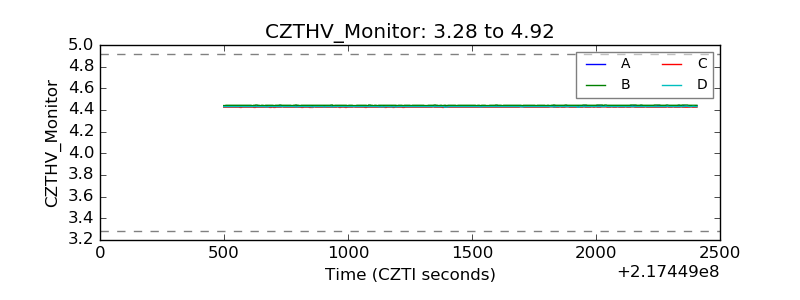 |
| D_VDD | 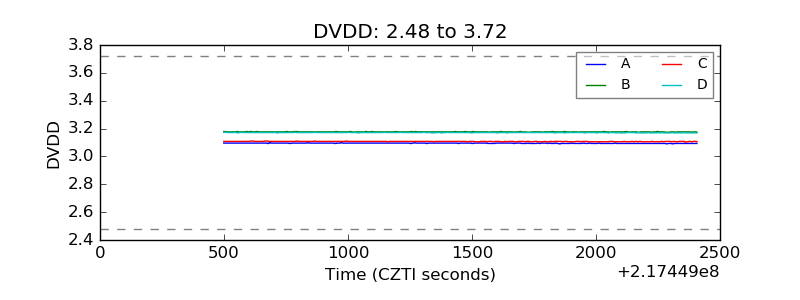 |
| Temperature 1 | 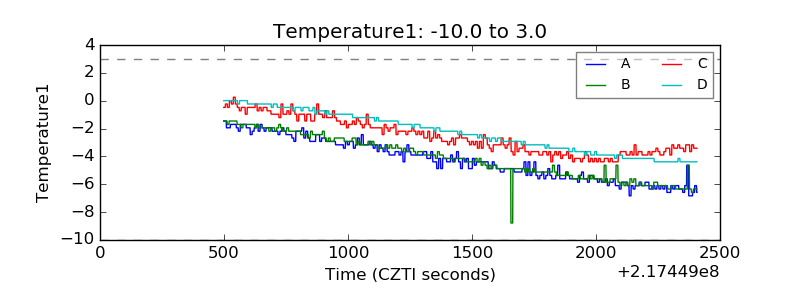 |
| Veto HV Monitor | 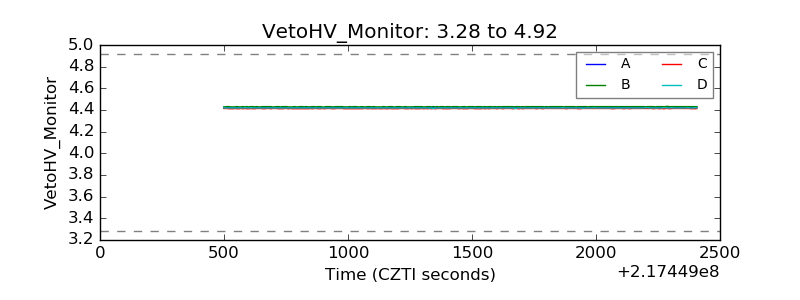 |
| Veto LLD | 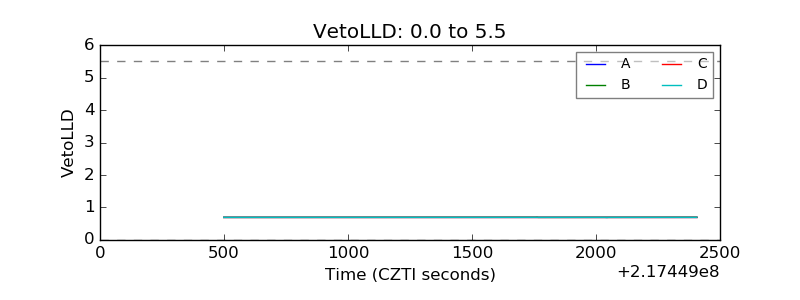 |
| Alpha Counter | 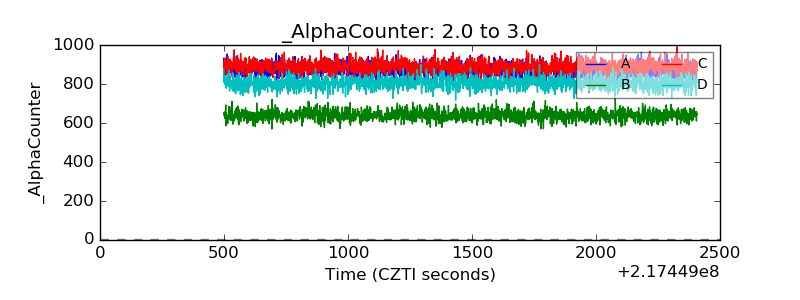 |
| _CPM_Rate | 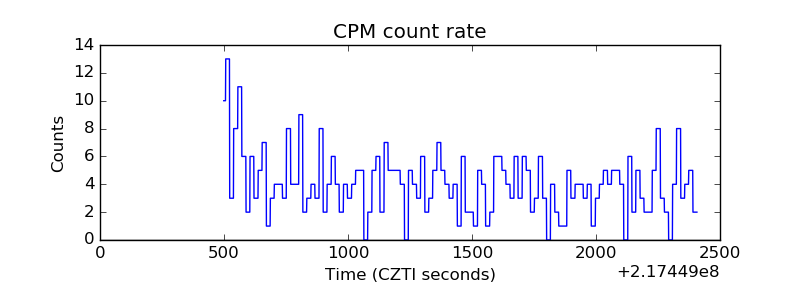 |
| CZT Counter | 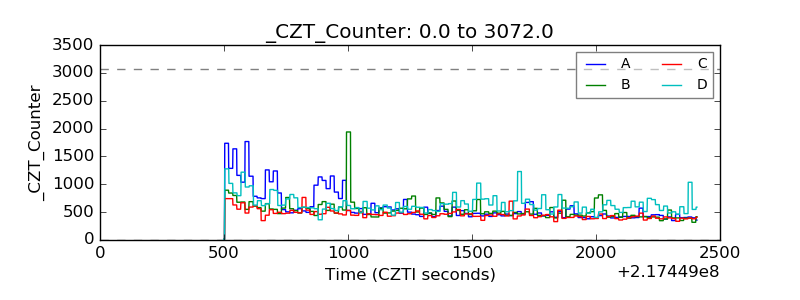 |
| +2.5 Volts monitor | 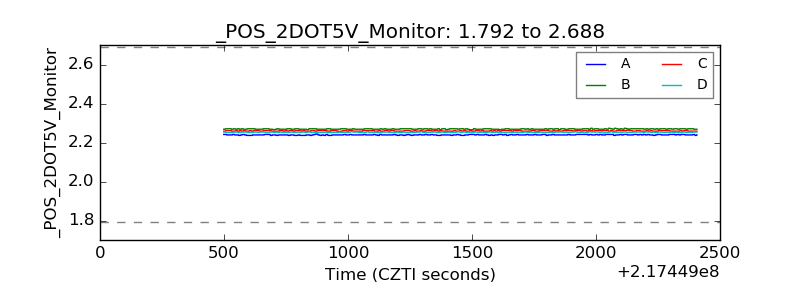 |
| +5 Volts monitor | 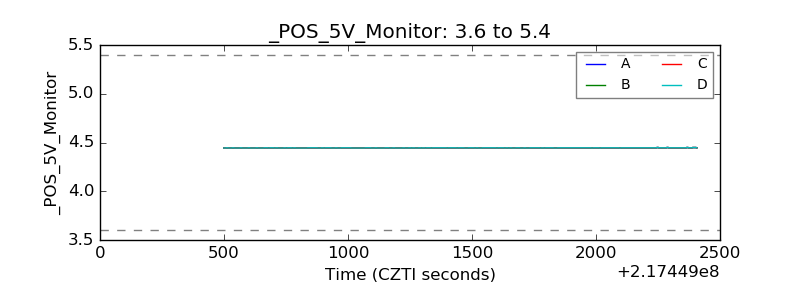 |
| _ROLL_ROT | 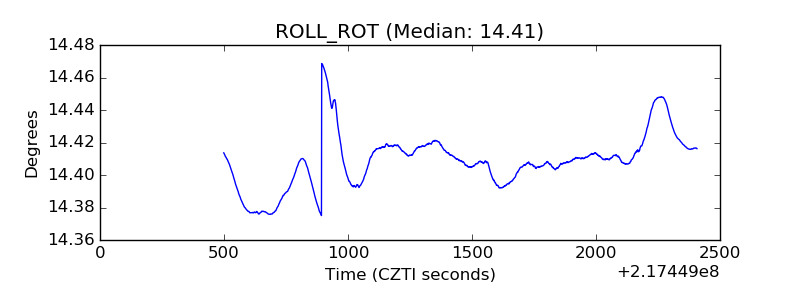 |
| _Roll_DEC | 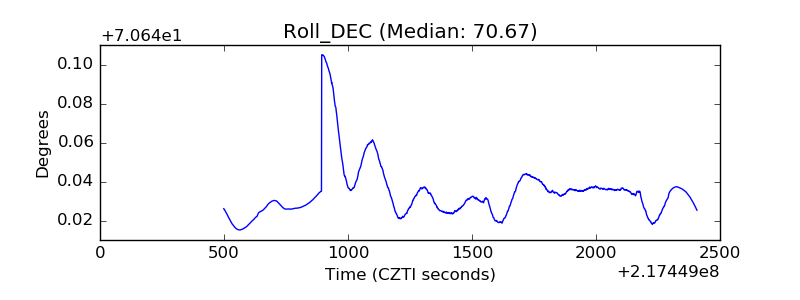 |
| _Roll_RA | 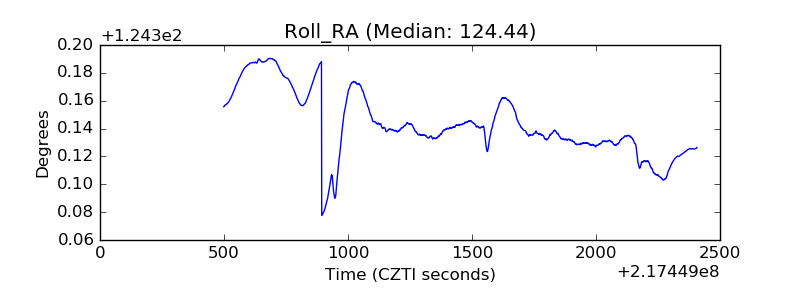 |
| Veto Counter | 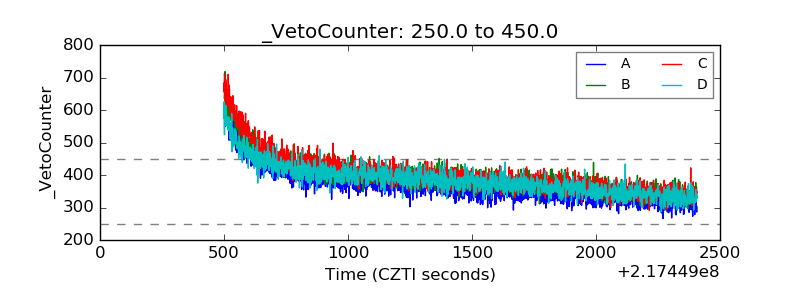 |