| Param | Original file | Final file |
|---|---|---|
| Filename | modeM0/AS1A02_046T01_9000000814_06235cztM0_level2.evt | modeM0/AS1A02_046T01_9000000814_06235cztM0_level2_quad_clean.evt |
| Size (bytes) | 525,657,600 | 131,667,840 |
| Size | 501.3 MB | 125.6 MB |
| Events in quadrant A | 4,571,707 | 870,218 |
| Events in quadrant B | 3,529,169 | 886,298 |
| Events in quadrant C | 3,177,503 | 885,164 |
| Events in quadrant D | 4,153,376 | 845,659 |
| Mode M9 | |||
|---|---|---|---|
| Quadrant | BADHDUFLAG | Total packets | Discarded packets |
| A | 0 | 9 | 0 |
| B | 0 | 9 | 0 |
| C | 0 | 9 | 0 |
| D | 0 | 10 | 0 |
| Mode M0 | |||
|---|---|---|---|
| Quadrant | BADHDUFLAG | Total packets | Discarded packets |
| A | 0 | 18548 | 2 |
| B | 0 | 15574 | 2 |
| C | 0 | 14633 | 2 |
| D | 0 | 17398 | 2 |
| Mode SS | |||
|---|---|---|---|
| Quadrant | BADHDUFLAG | Total packets | Discarded packets |
| A | 0 | 148 | 0 |
| B | 0 | 148 | 0 |
| C | 0 | 148 | 0 |
| D | 0 | 148 | 0 |
| Quadrant | Total seconds | Saturated seconds | Saturation percentage |
|---|---|---|---|
| A | 7183 | 147 | 2.046499% |
| B | 7183 | 67 | 0.932758% |
| C | 7183 | 29 | 0.403731% |
| D | 7183 | 76 | 1.058054% |
Noise dominated data is calculated using 1-second bins in cleaned event files. If a bin has >2000 counts, and if more than 50% of those come from <1% of pixels, then it is considered to be noise-dominated and hence unusable.
| Quadrant | # 1 sec bins | Bins with >0 counts | Bins with >2000 counts | High rate bins dominated by noise | Noise dominated (total time) | Noise dominated (detector-on time) | Marked lightcurve |
|---|---|---|---|---|---|---|---|
| A | 8133 | 7184 | 11 | 11 | 0.14% | 0.15% | 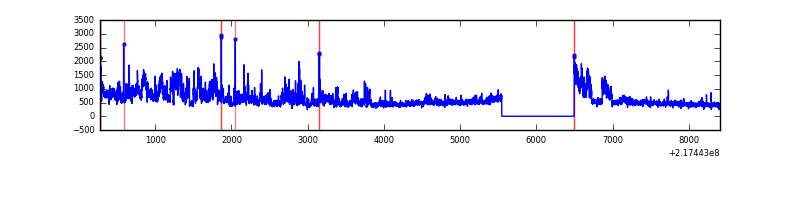 |
| B | 8133 | 7184 | 7 | 7 | 0.09% | 0.10% | 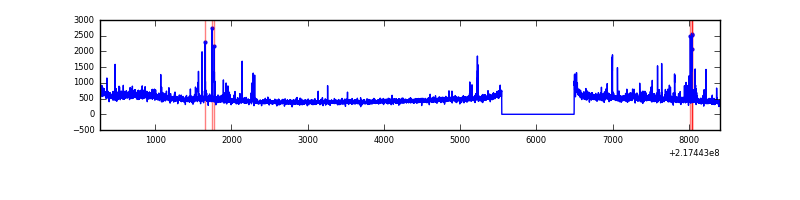 |
| C | 8133 | 7184 | 0 | 0 | 0.00% | 0.00% | 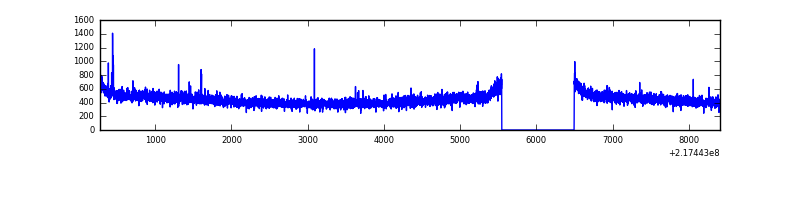 |
| D | 8133 | 7184 | 18 | 18 | 0.22% | 0.25% | 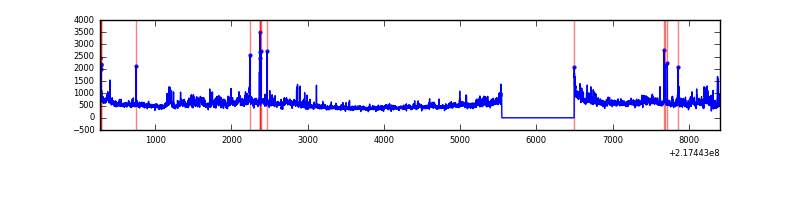 |
Top three noisy pixels from each quadrant. If the there are fewer than three noisy pixels in the level2.evt file, extra rows are filled as -1
| Pixel properties | Quadrant properties | ||||||
|---|---|---|---|---|---|---|---|
| Quadrant | DetID | PixID | Counts | Sigma | Mean | Median | Sigma |
| A | 13 | 34 | 1238966 | 7390.23 | 817 | 798 | 167.5 |
| A | 0 | 31 | 106408 | 630.35 | 817 | 798 | 167.5 |
| A | 8 | 15 | 80483 | 475.61 | 817 | 798 | 167.5 |
| B | 0 | 219 | 98904 | 630.43 | 829 | 808 | 155.6 |
| B | 15 | 204 | 73832 | 469.3 | 829 | 808 | 155.6 |
| B | 0 | 214 | 56475 | 357.75 | 829 | 808 | 155.6 |
| C | 1 | 16 | 12535 | 63.13 | 808 | 812 | 185.7 |
| C | 13 | 61 | 6483 | 30.54 | 808 | 812 | 185.7 |
| C | 9 | 16 | 5431 | 24.87 | 808 | 812 | 185.7 |
| D | 2 | 63 | 487627 | 2477.82 | 806 | 779 | 196.5 |
| D | 12 | 221 | 299726 | 1521.5 | 806 | 779 | 196.5 |
| D | 2 | 136 | 129982 | 657.58 | 806 | 779 | 196.5 |
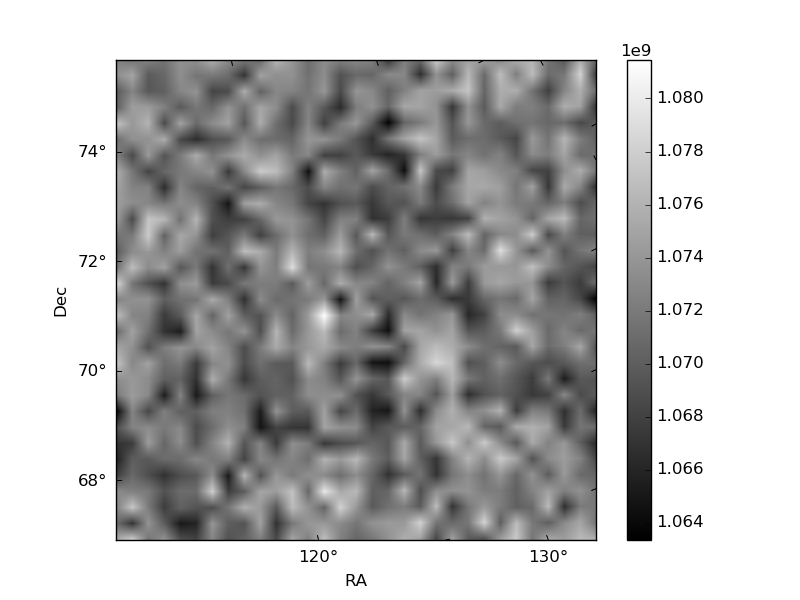
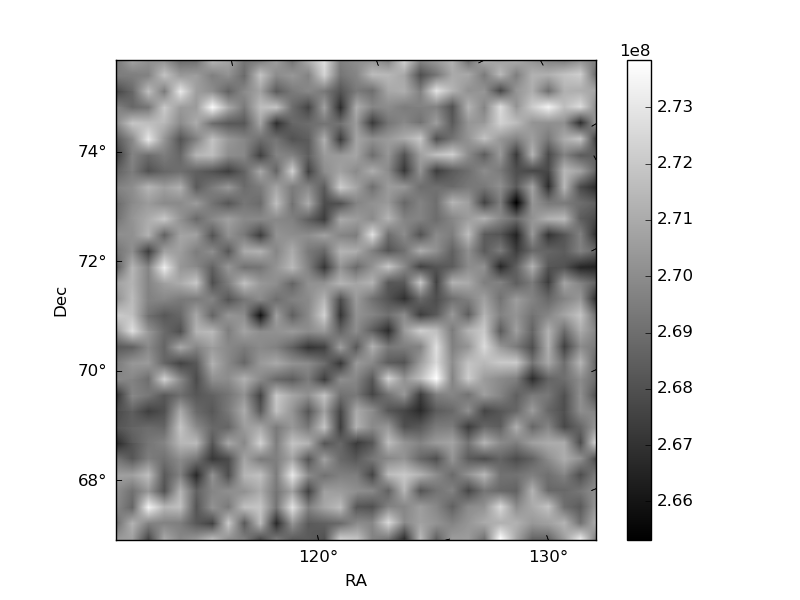
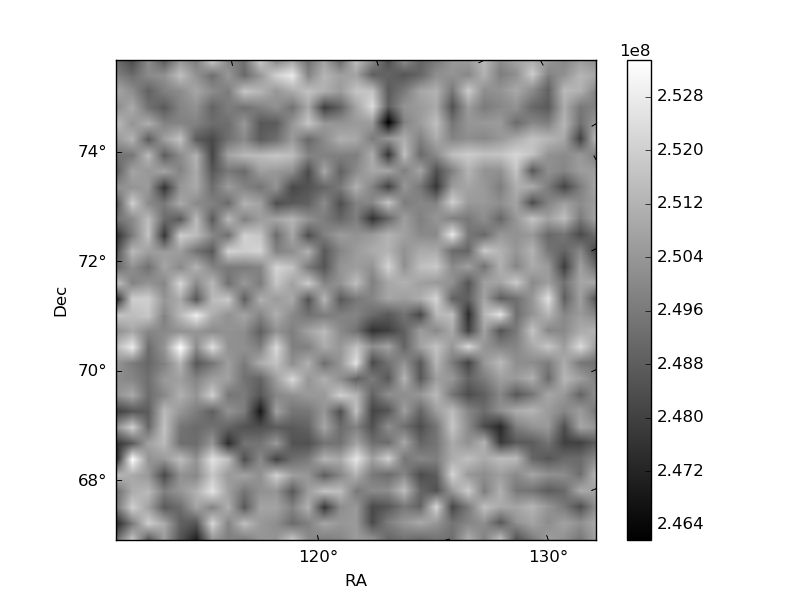
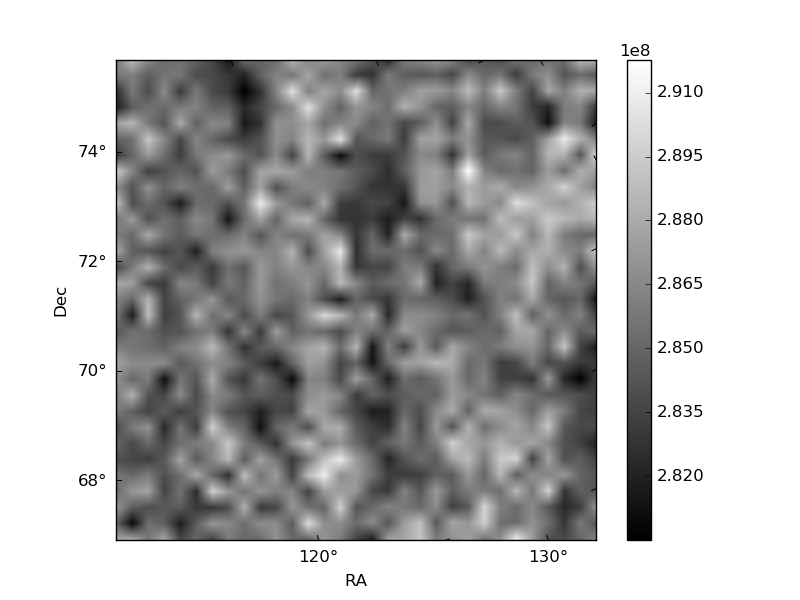
Histogram calculated using DETX and DETY for each event in the final _common_clean file
| Quadrant A | 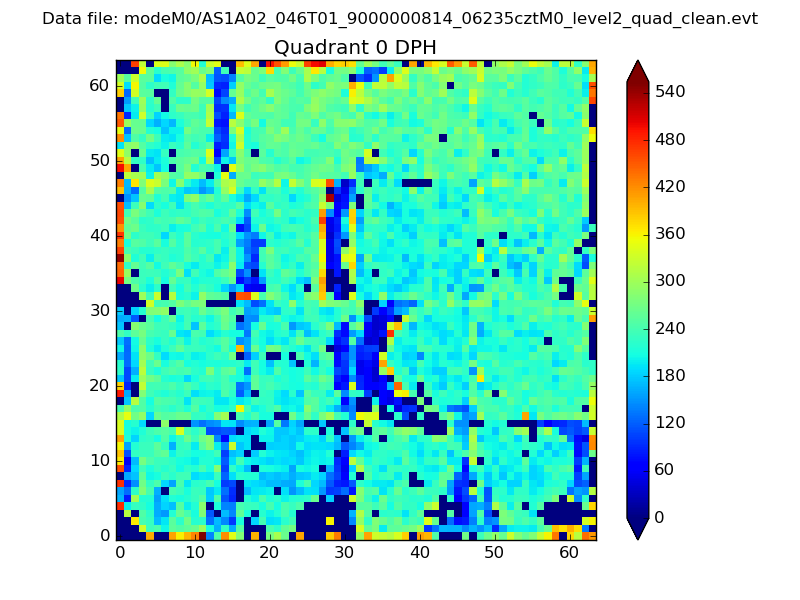 |
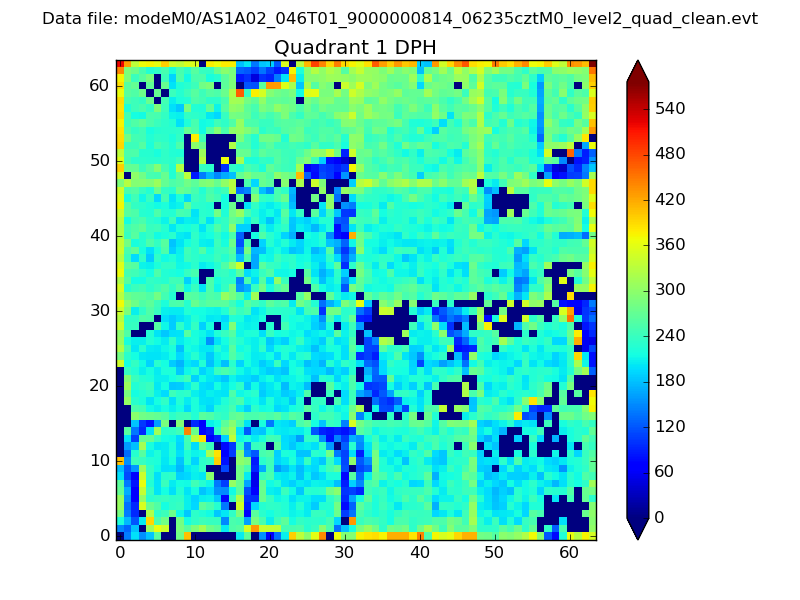 |
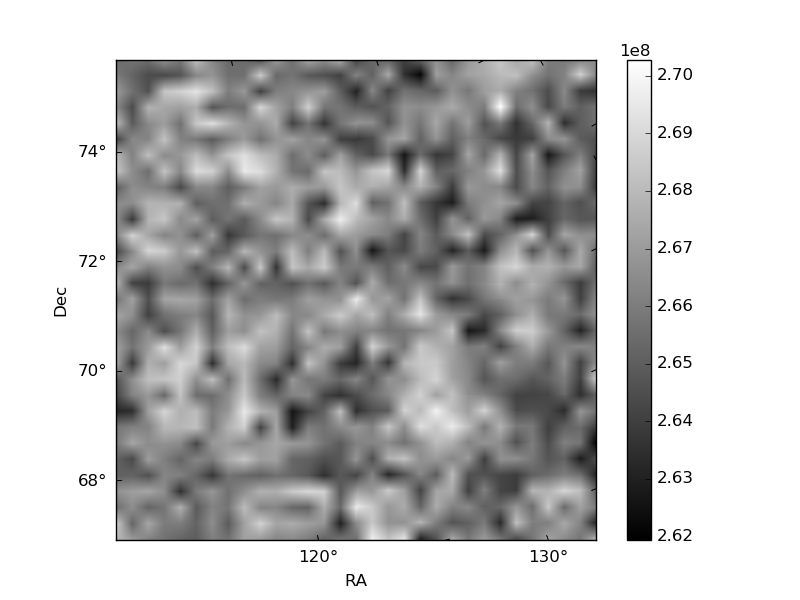
Quadrant B |
|---|---|---|---|
| Quadrant D | 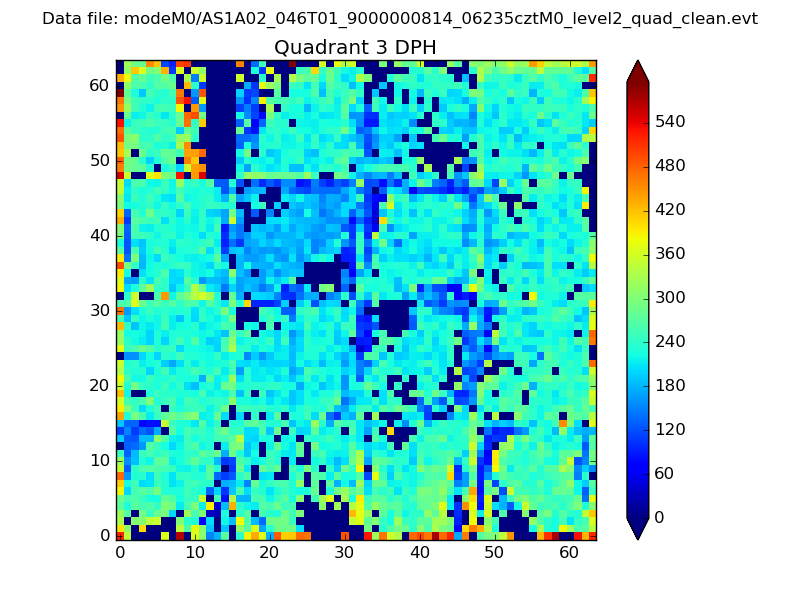 |
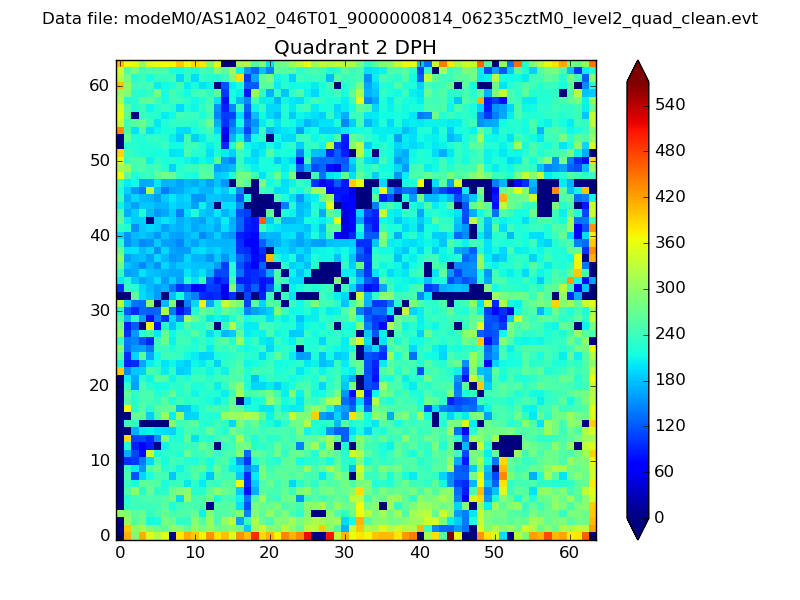 |
Quadrant C |
| Plot type | Count rate plots | Images |
|---|---|---|
| Comparison with Poisson distribution Blue bars denote a histogram of data divided into 1 sec bins. Red curve is a Poisson curve with rate = median count rate of data. |
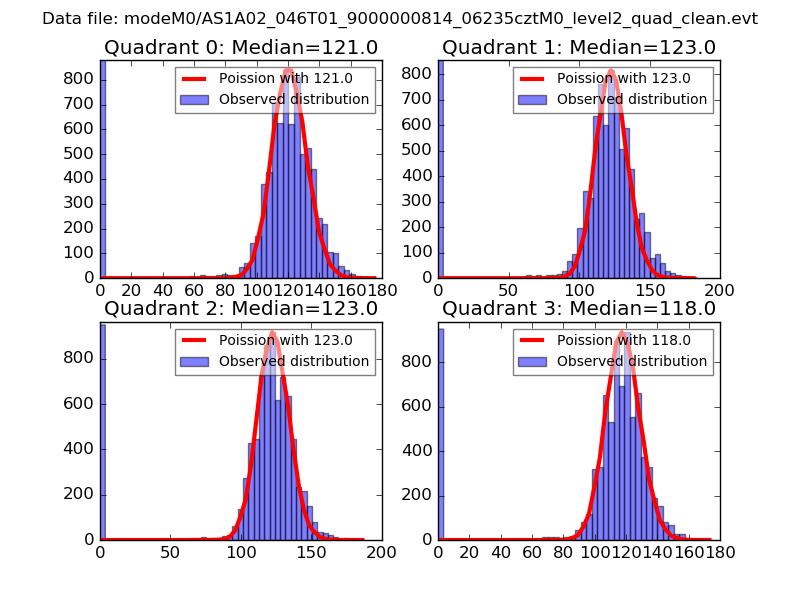 |
 |
| Quadrant-wise count rates Data is divided into 100 sec bins |
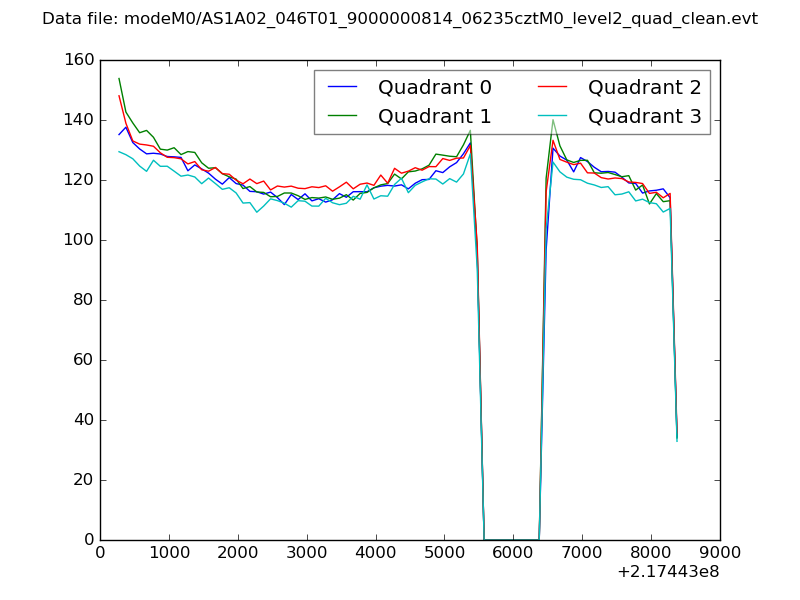 |
|
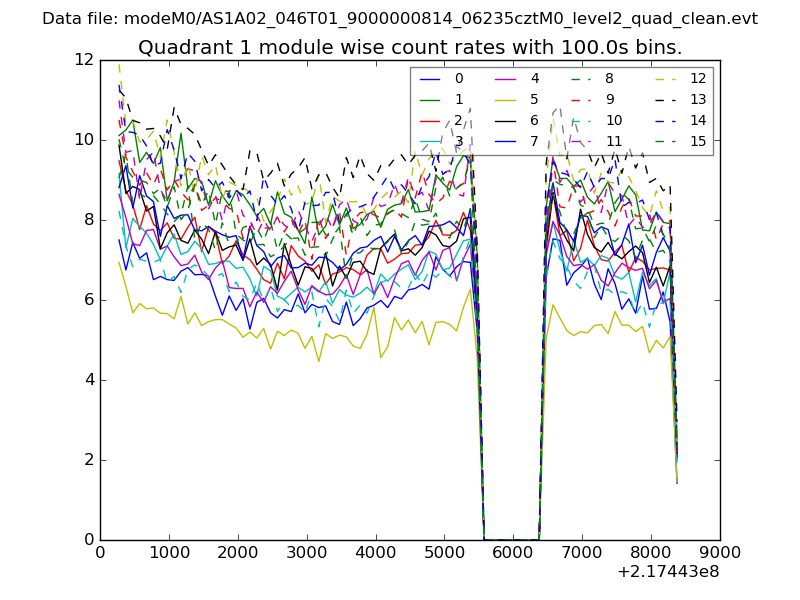
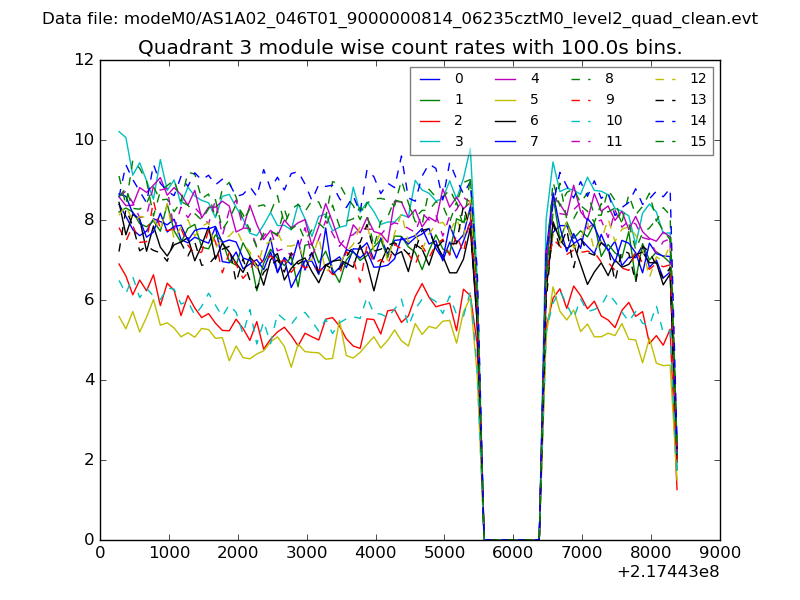
| Module-wise count rates for Quadrant A Data is divided into 100 sec bins |
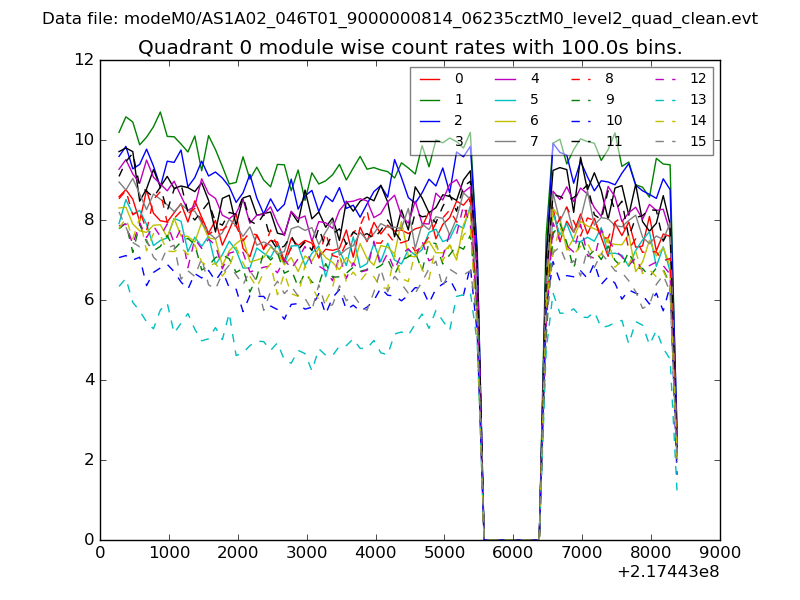 |
 |
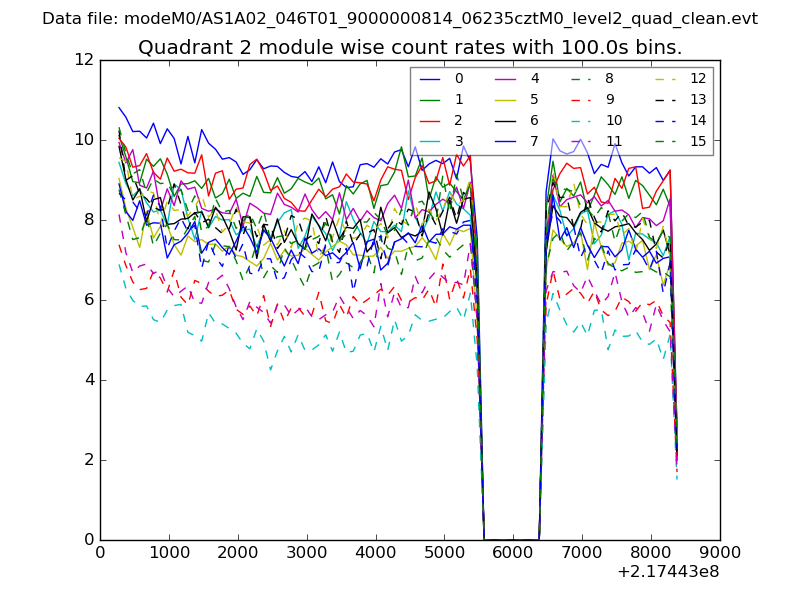
| Module-wise count rates for Quadrant B Data is divided into 100 sec bins |
 |
 |
| Module-wise count rates for Quadrant C Data is divided into 100 sec bins |
 |
 |
| Module-wise count rates for Quadrant D Data is divided into 100 sec bins |
 |
 |
| Parameter | Plot |
|---|---|
| CZT HV Monitor | 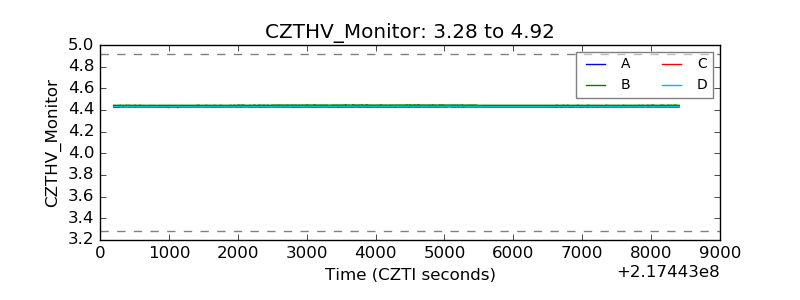 |
| D_VDD | 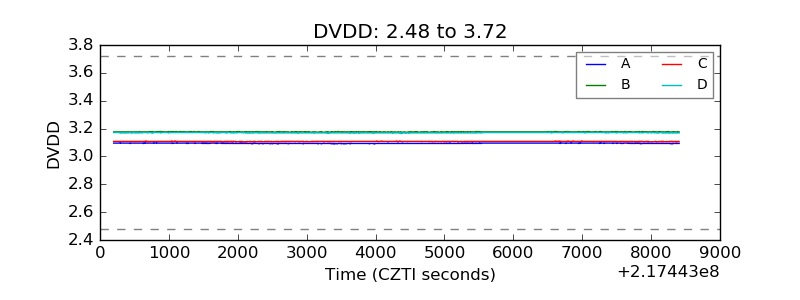 |
| Temperature 1 | 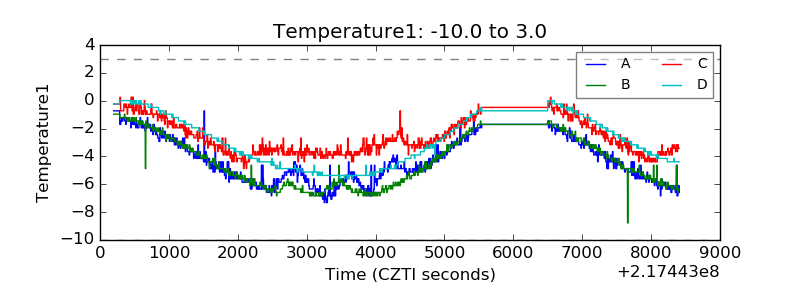 |
| Veto HV Monitor | 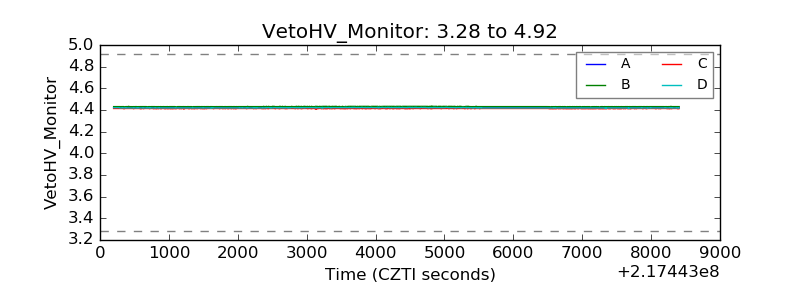 |
| Veto LLD | 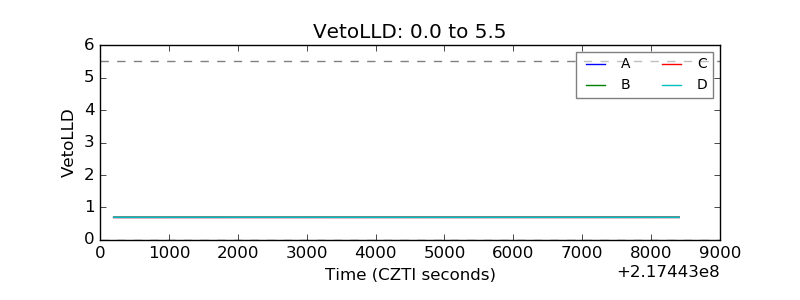 |
| Alpha Counter | 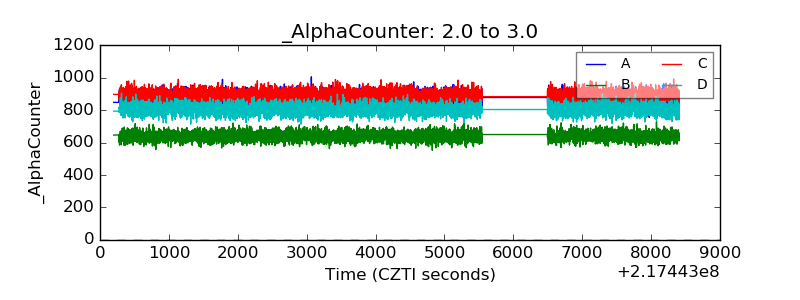 |
| _CPM_Rate | 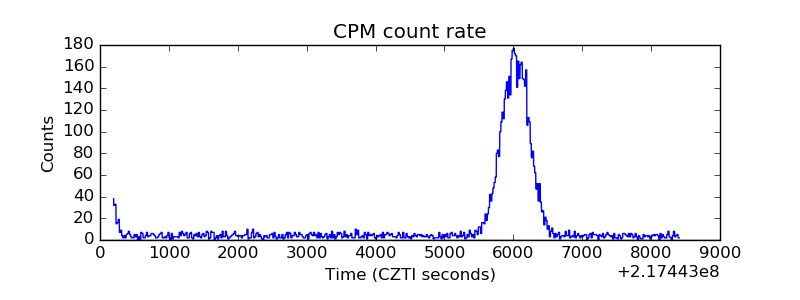 |
| CZT Counter | 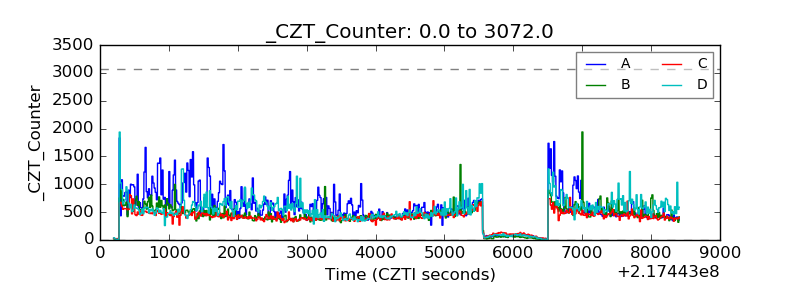 |
| +2.5 Volts monitor | 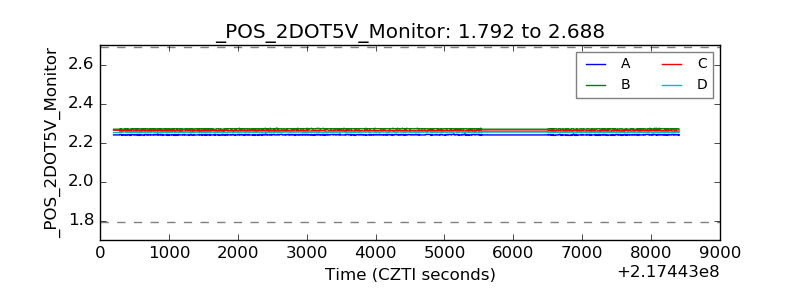 |
| +5 Volts monitor | 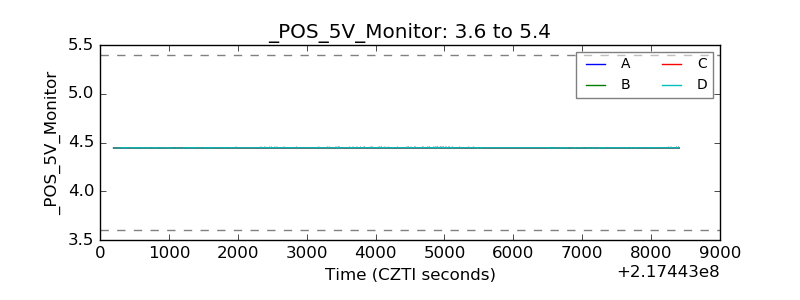 |
| _ROLL_ROT | 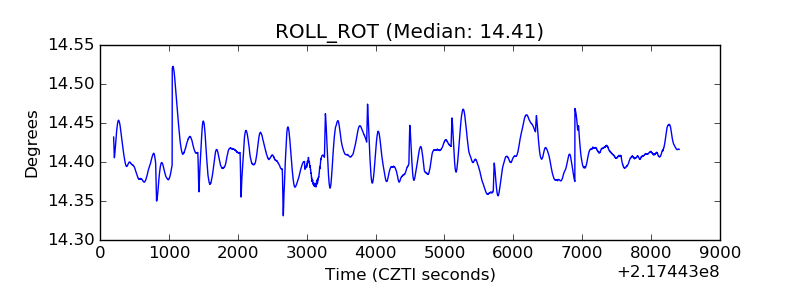 |
| _Roll_DEC | 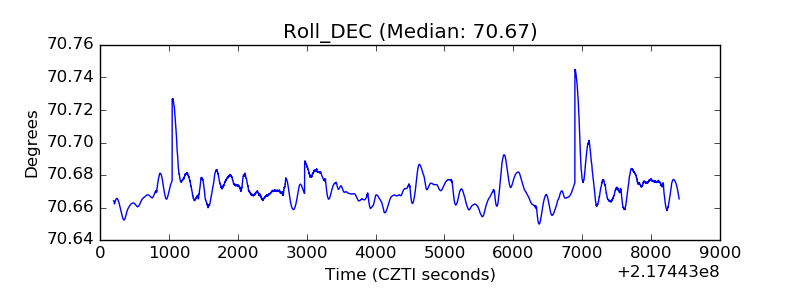 |
| _Roll_RA | 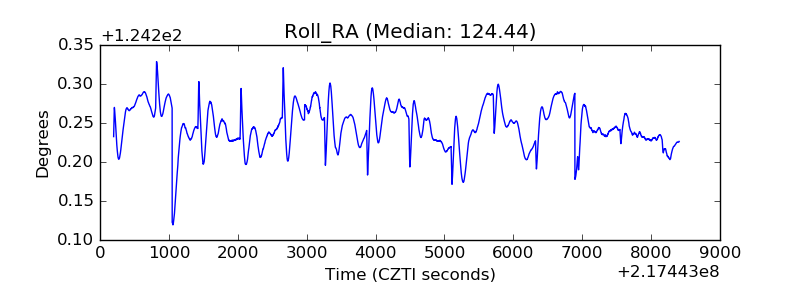 |
| Veto Counter | 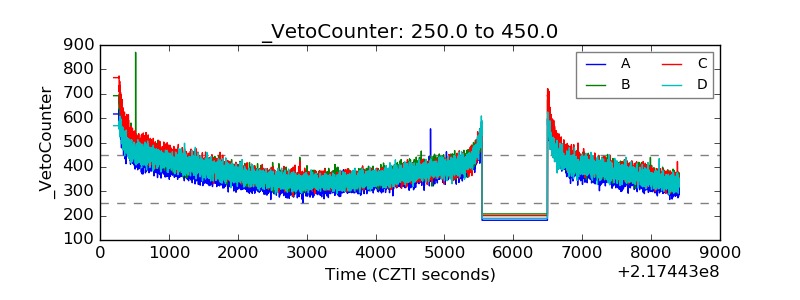 |