| Param | Original file | Final file |
|---|---|---|
| Filename | modeM0/AS1G06_145T01_9000000816_06227cztM0_level2.evt | modeM0/AS1G06_145T01_9000000816_06227cztM0_level2_quad_clean.evt |
| Size (bytes) | 356,875,200 | 57,274,560 |
| Size | 340.3 MB | 54.6 MB |
| Events in quadrant A | 3,061,941 | 351,913 |
| Events in quadrant B | 2,566,366 | 362,541 |
| Events in quadrant C | 2,069,832 | 357,255 |
| Events in quadrant D | 2,795,272 | 337,491 |
| Mode SS | |||
|---|---|---|---|
| Quadrant | BADHDUFLAG | Total packets | Discarded packets |
| A | 0 | 92 | 0 |
| B | 0 | 92 | 0 |
| C | 0 | 92 | 0 |
| D | 0 | 92 | 0 |
| Mode M9 | |||
|---|---|---|---|
| Quadrant | BADHDUFLAG | Total packets | Discarded packets |
| A | 0 | 6 | 0 |
| B | 0 | 6 | 0 |
| C | 0 | 6 | 0 |
| D | 0 | 6 | 0 |
| Mode M0 | |||
|---|---|---|---|
| Quadrant | BADHDUFLAG | Total packets | Discarded packets |
| A | 0 | 12339 | 2 |
| B | 0 | 10643 | 1 |
| C | 0 | 9479 | 1 |
| D | 0 | 11560 | 1 |
| Quadrant | Total seconds | Saturated seconds | Saturation percentage |
|---|---|---|---|
| A | 4629 | 93 | 2.009073% |
| B | 4629 | 54 | 1.166559% |
| C | 4629 | 9 | 0.194426% |
| D | 4629 | 47 | 1.015338% |
Noise dominated data is calculated using 1-second bins in cleaned event files. If a bin has >2000 counts, and if more than 50% of those come from <1% of pixels, then it is considered to be noise-dominated and hence unusable.
| Quadrant | # 1 sec bins | Bins with >0 counts | Bins with >2000 counts | High rate bins dominated by noise | Noise dominated (total time) | Noise dominated (detector-on time) | Marked lightcurve |
|---|---|---|---|---|---|---|---|
| A | 5174 | 4630 | 9 | 9 | 0.17% | 0.19% | 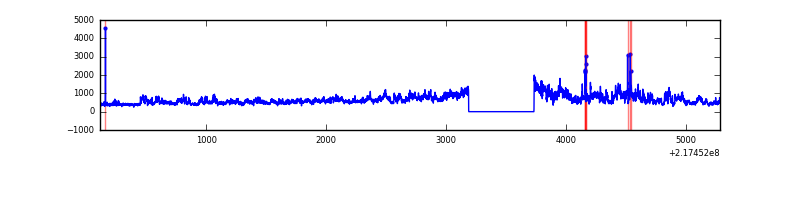 |
| B | 5174 | 4630 | 15 | 15 | 0.29% | 0.32% | 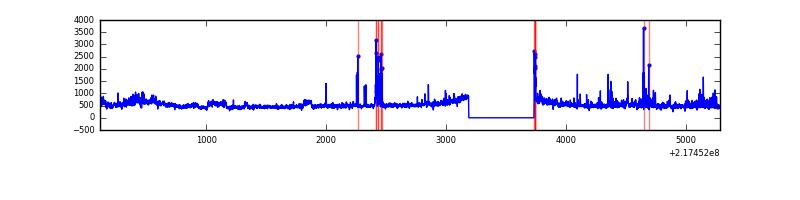 |
| C | 5174 | 4630 | 0 | 0 | 0.00% | 0.00% | 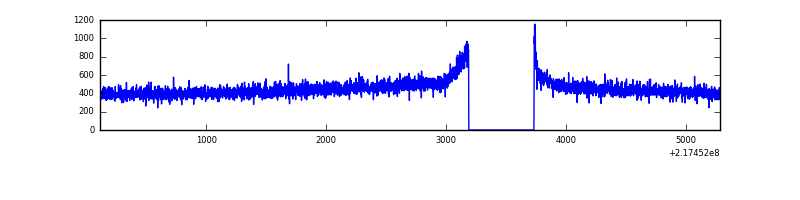 |
| D | 5174 | 4630 | 25 | 25 | 0.48% | 0.54% | 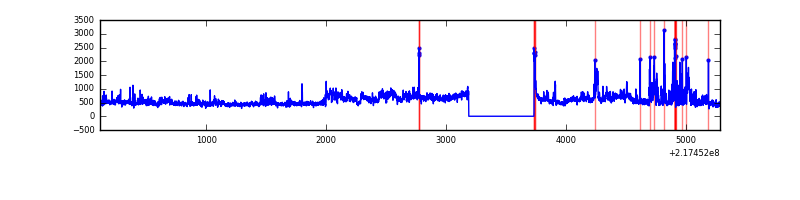 |
Top three noisy pixels from each quadrant. If the there are fewer than three noisy pixels in the level2.evt file, extra rows are filled as -1
| Pixel properties | Quadrant properties | ||||||
|---|---|---|---|---|---|---|---|
| Quadrant | DetID | PixID | Counts | Sigma | Mean | Median | Sigma |
| A | 13 | 34 | 897560 | 7991.44 | 538 | 527 | 112.2 |
| A | 8 | 15 | 43206 | 380.22 | 538 | 527 | 112.2 |
| A | 0 | 31 | 38285 | 336.38 | 538 | 527 | 112.2 |
| B | 0 | 187 | 191592 | 1812.89 | 544 | 530 | 105.4 |
| B | 0 | 219 | 140155 | 1324.83 | 544 | 530 | 105.4 |
| B | 15 | 204 | 36529 | 341.57 | 544 | 530 | 105.4 |
| C | 1 | 16 | 6630 | 49.81 | 527 | 529 | 122.5 |
| C | 13 | 61 | 4149 | 29.56 | 527 | 529 | 122.5 |
| C | 8 | 222 | 3896 | 27.49 | 527 | 529 | 122.5 |
| D | 12 | 221 | 371735 | 2837.83 | 526 | 508 | 130.8 |
| D | 2 | 63 | 207939 | 1585.7 | 526 | 508 | 130.8 |
| D | 2 | 136 | 141139 | 1075.05 | 526 | 508 | 130.8 |
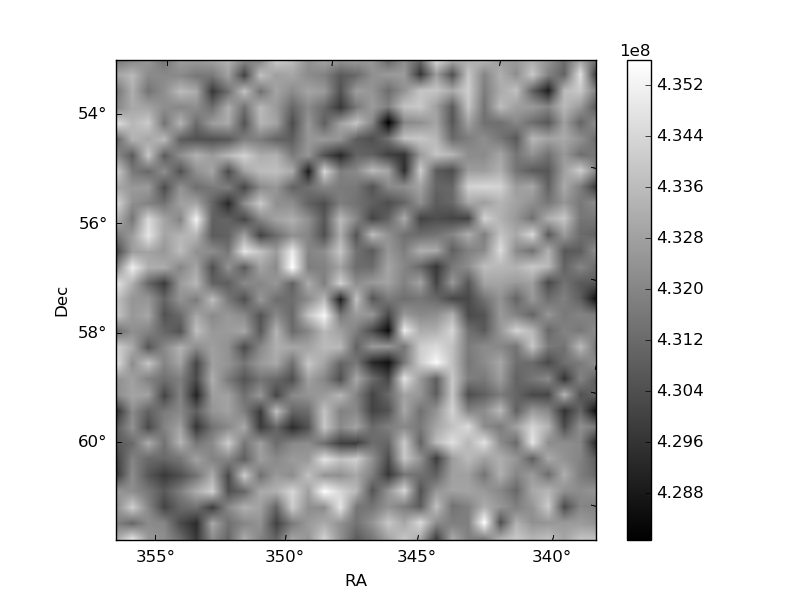
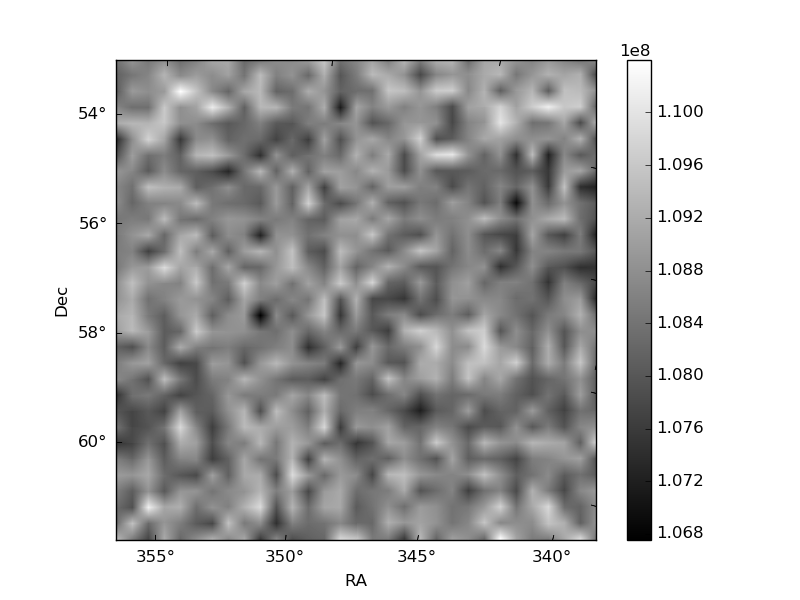
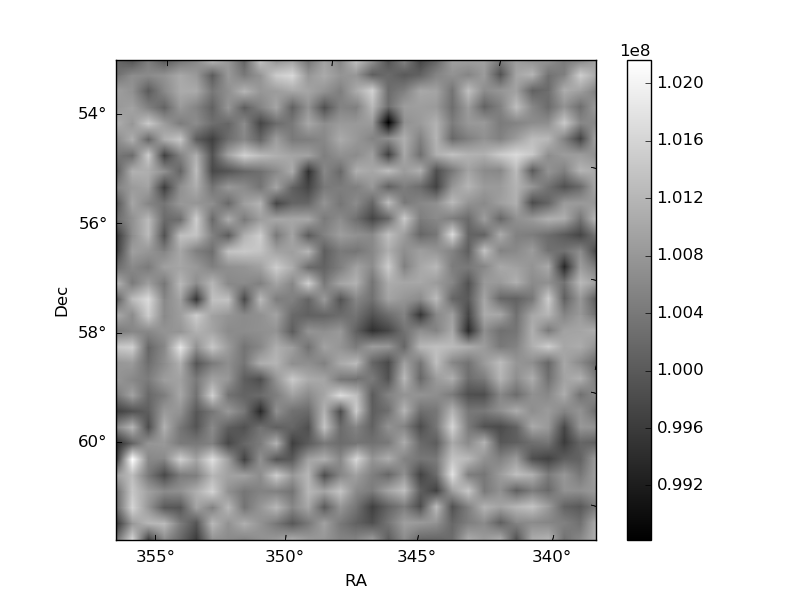
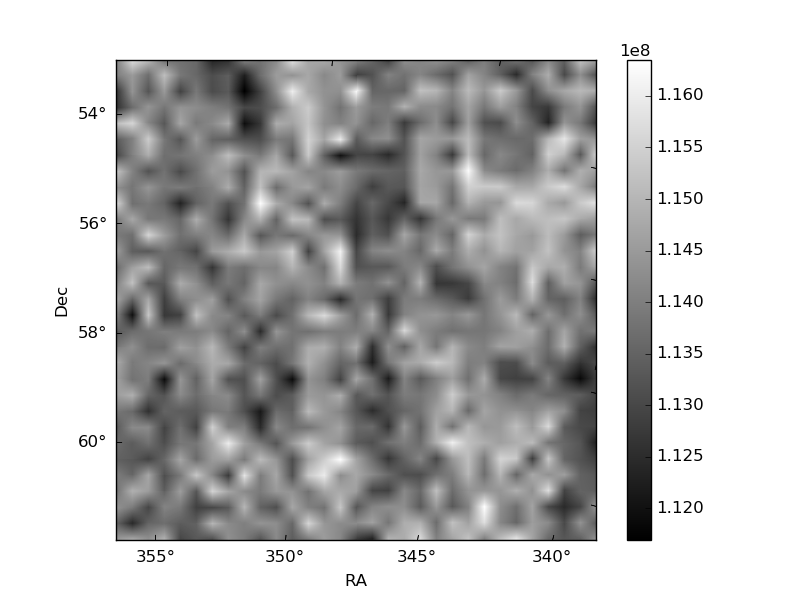
Histogram calculated using DETX and DETY for each event in the final _common_clean file
| Quadrant A | 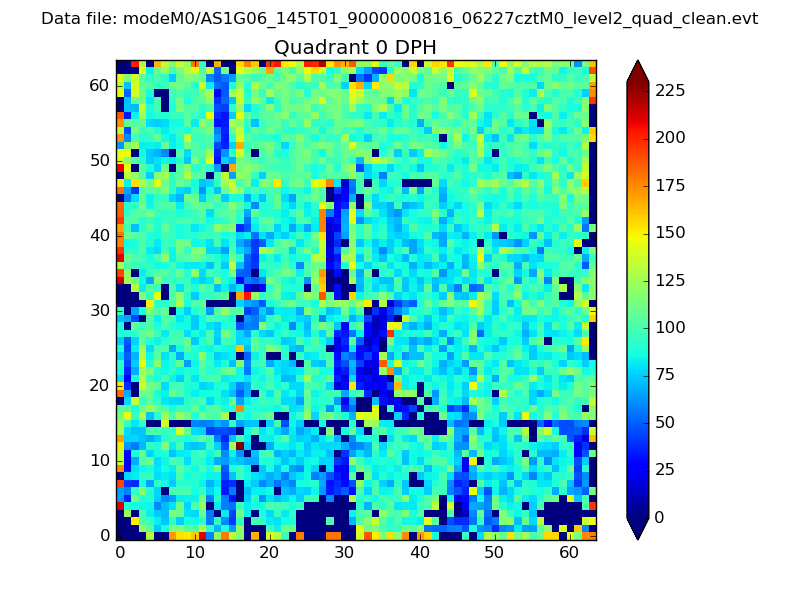 |
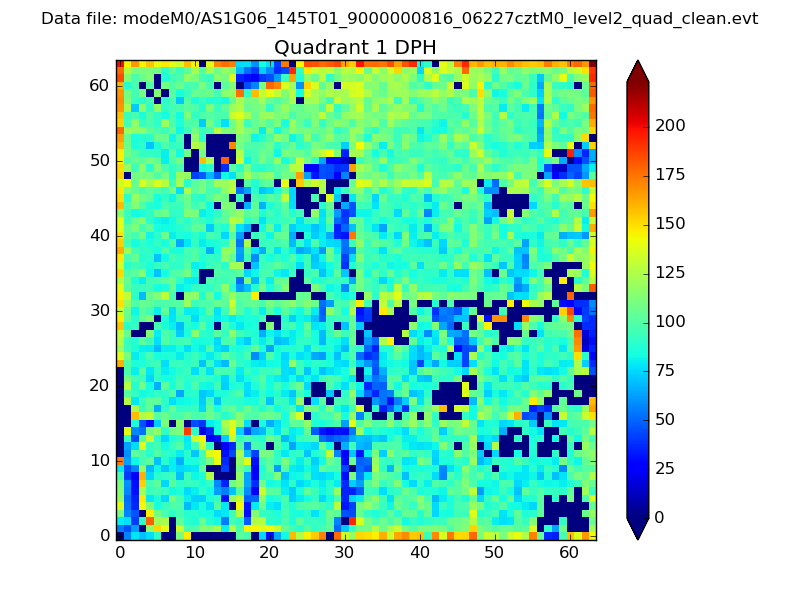 |
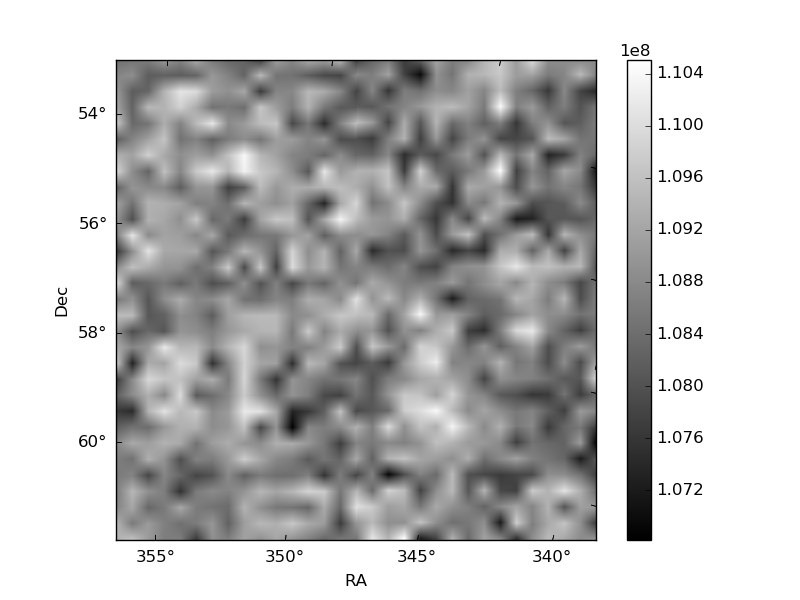
Quadrant B |
|---|---|---|---|
| Quadrant D | 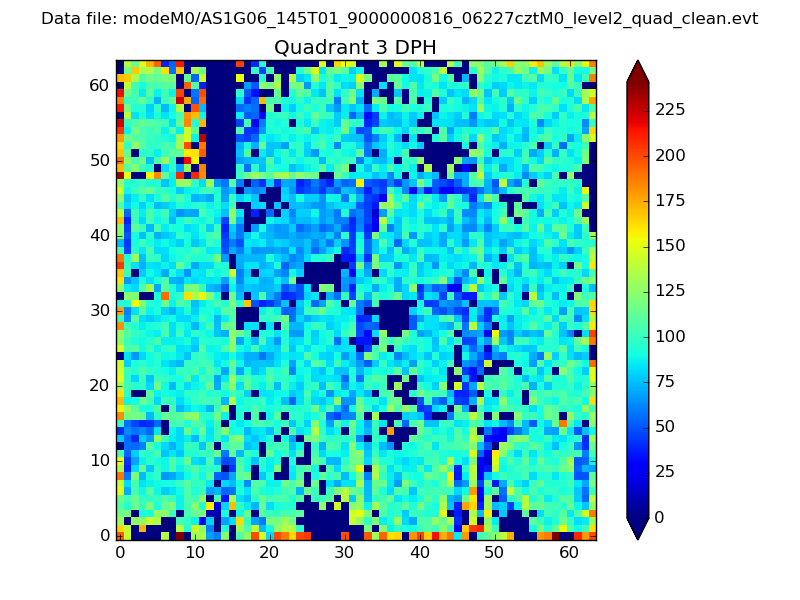 |
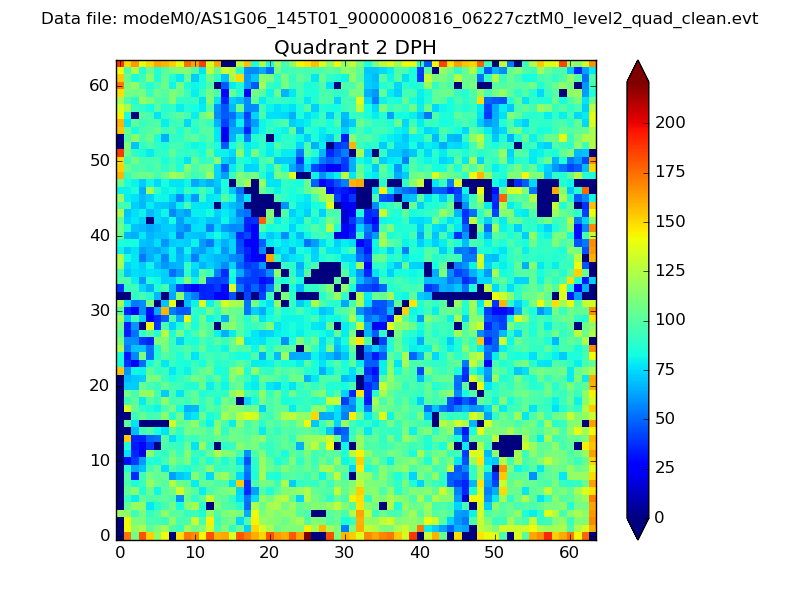 |
Quadrant C |
| Plot type | Count rate plots | Images |
|---|---|---|
| Comparison with Poisson distribution Blue bars denote a histogram of data divided into 1 sec bins. Red curve is a Poisson curve with rate = median count rate of data. |
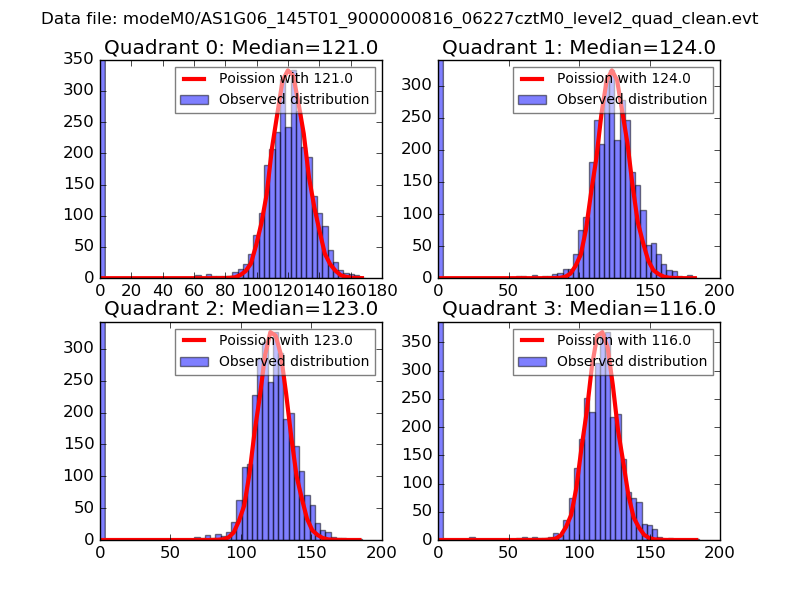 |
 |
| Quadrant-wise count rates Data is divided into 100 sec bins |
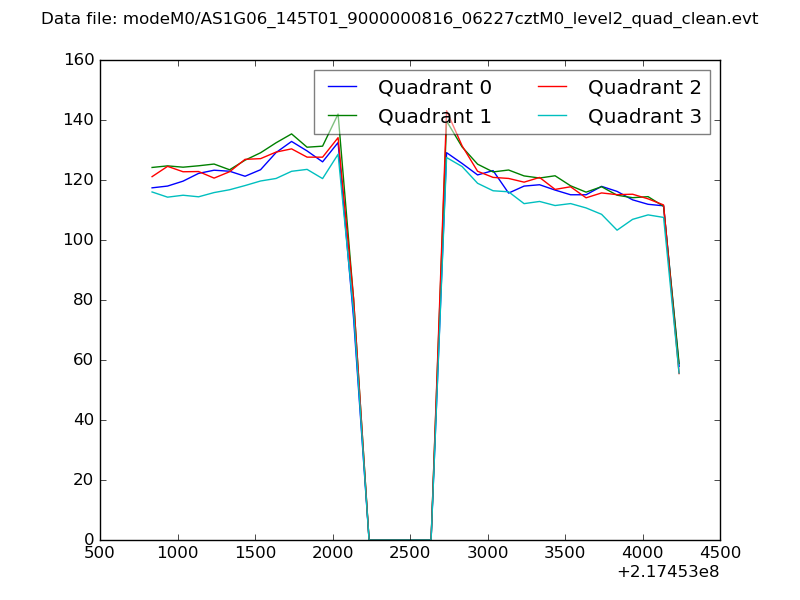 |
|
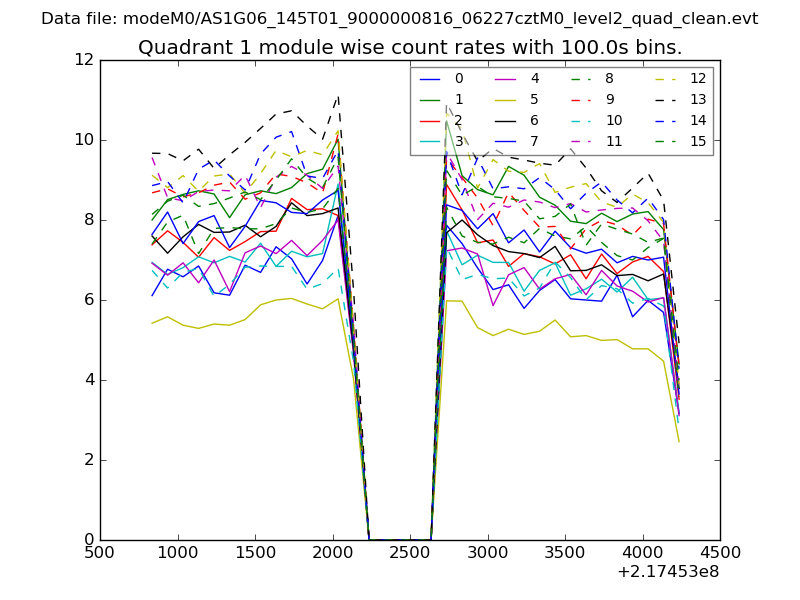
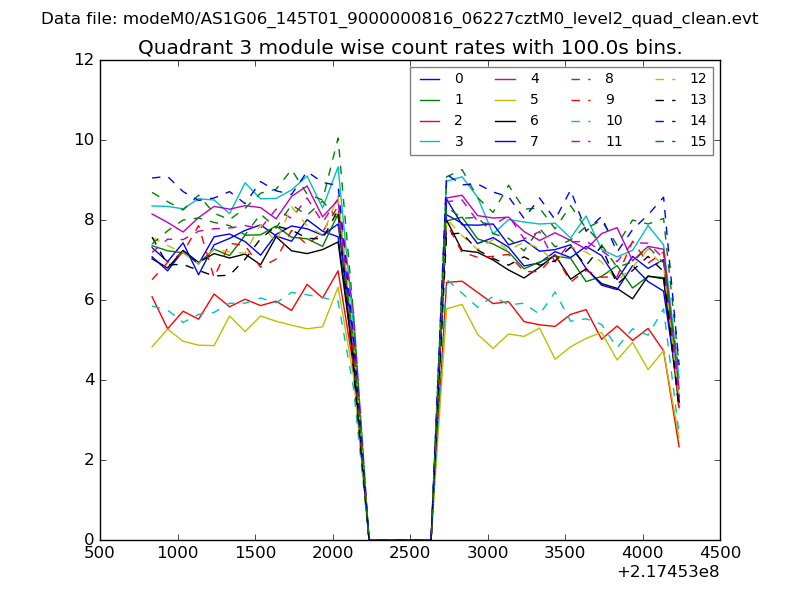
| Module-wise count rates for Quadrant A Data is divided into 100 sec bins |
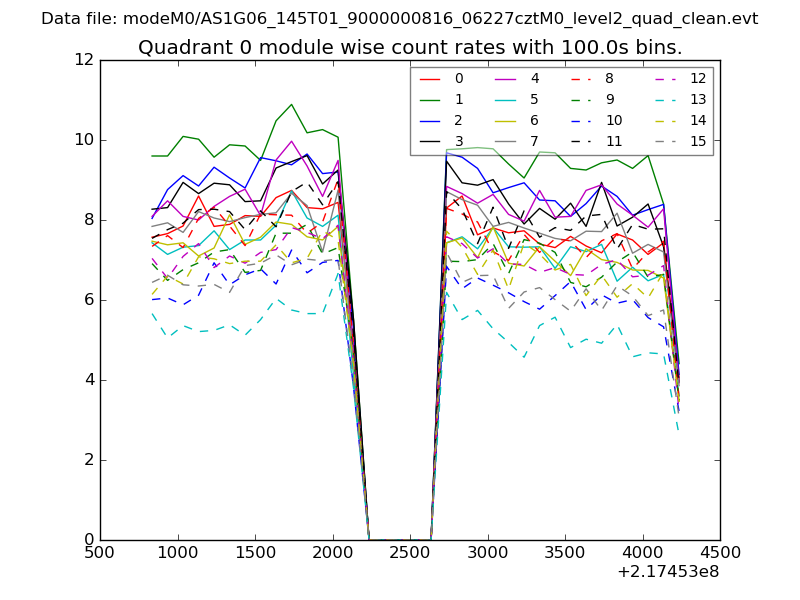 |
 |
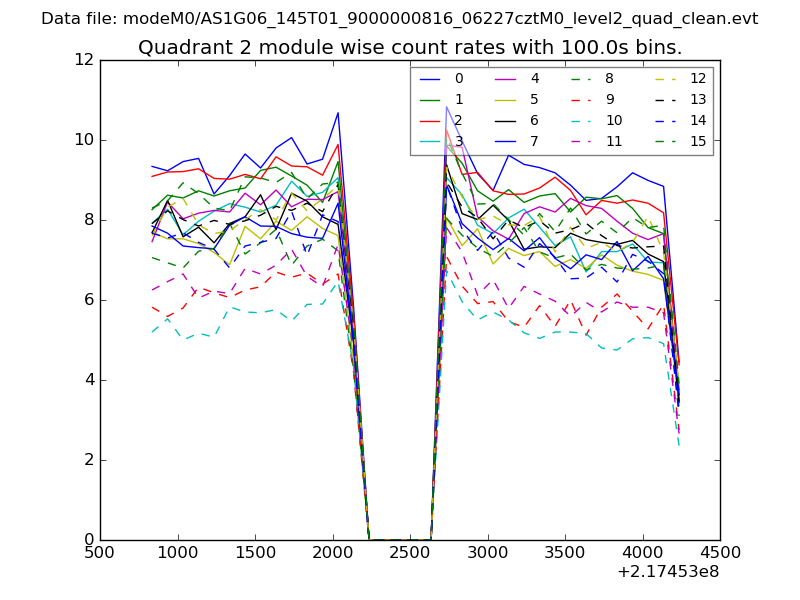
| Module-wise count rates for Quadrant B Data is divided into 100 sec bins |
 |
 |
| Module-wise count rates for Quadrant C Data is divided into 100 sec bins |
 |
 |
| Module-wise count rates for Quadrant D Data is divided into 100 sec bins |
 |
 |
| Parameter | Plot |
|---|---|
| CZT HV Monitor | 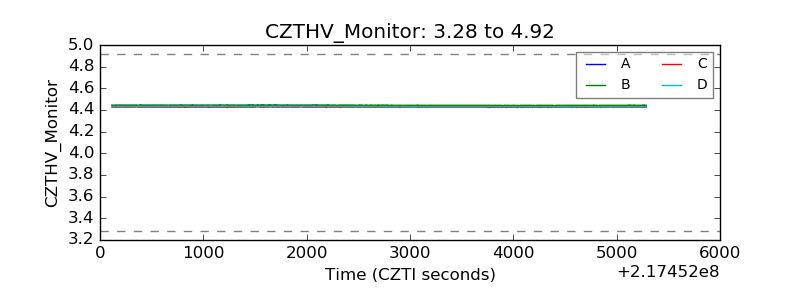 |
| D_VDD | 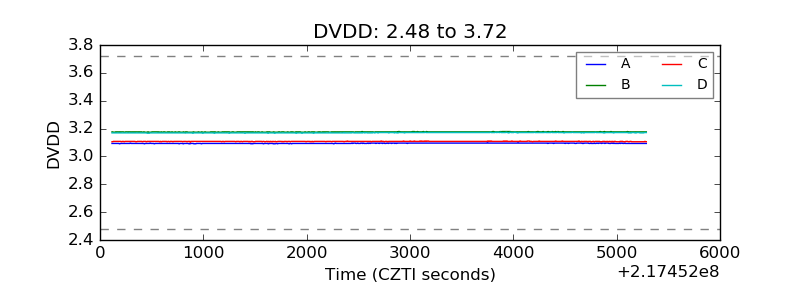 |
| Temperature 1 | 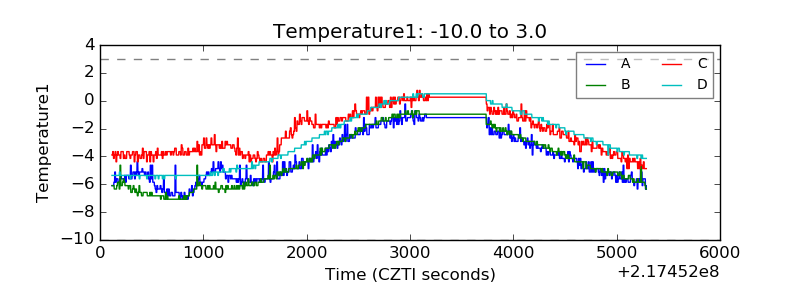 |
| Veto HV Monitor | 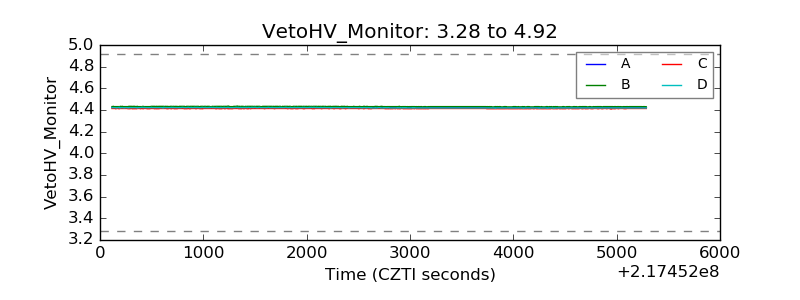 |
| Veto LLD | 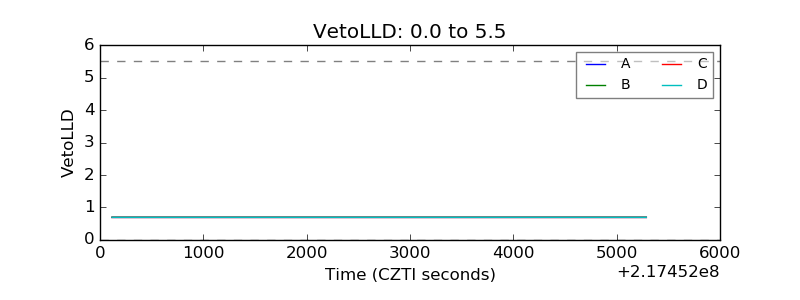 |
| Alpha Counter | 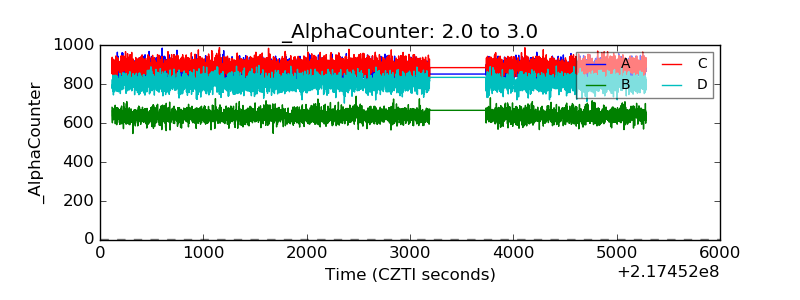 |
| _CPM_Rate | 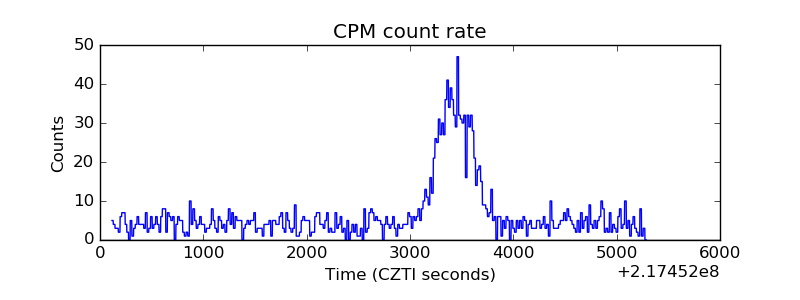 |
| CZT Counter | 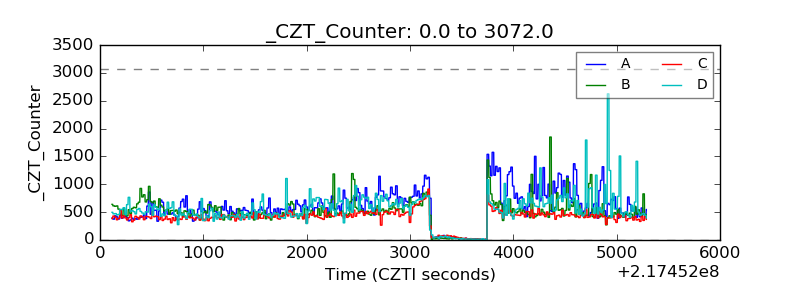 |
| +2.5 Volts monitor |  |
| +5 Volts monitor |  |
| _ROLL_ROT | 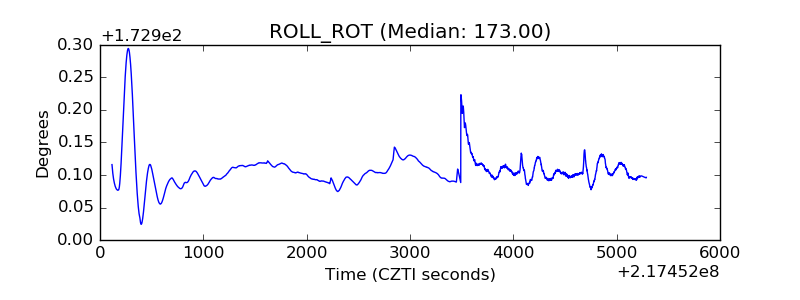 |
| _Roll_DEC | 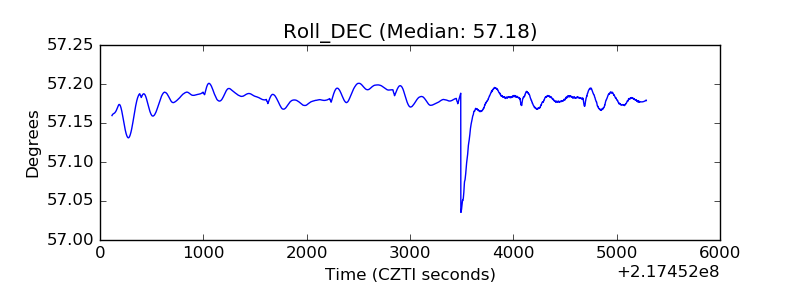 |
| _Roll_RA | 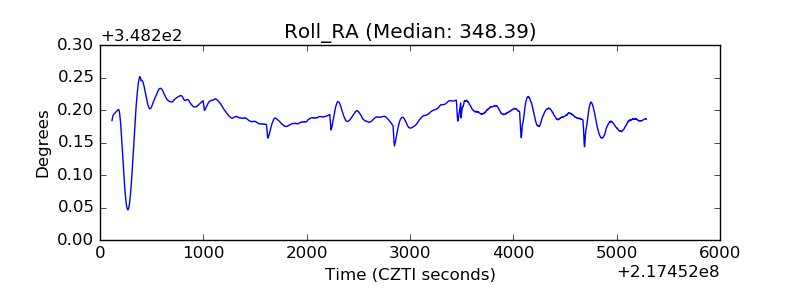 |
| Veto Counter | 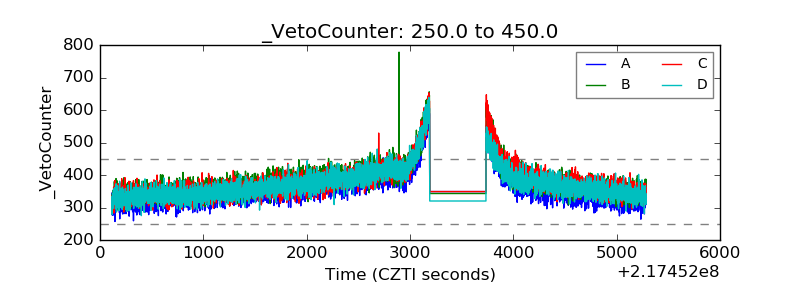 |