| Param | Original file | Final file |
|---|---|---|
| Filename | modeM0/AS1G06_145T01_9000000816_06228cztM0_level2.evt | modeM0/AS1G06_145T01_9000000816_06228cztM0_level2_quad_clean.evt |
| Size (bytes) | 620,265,600 | 105,543,360 |
| Size | 591.5 MB | 100.7 MB |
| Events in quadrant A | 5,148,118 | 677,367 |
| Events in quadrant B | 3,989,548 | 695,083 |
| Events in quadrant C | 3,356,308 | 693,228 |
| Events in quadrant D | 5,774,756 | 600,449 |
| Mode SS | |||
|---|---|---|---|
| Quadrant | BADHDUFLAG | Total packets | Discarded packets |
| A | 0 | 154 | 0 |
| B | 0 | 154 | 0 |
| C | 0 | 154 | 2 |
| D | 0 | 154 | 0 |
| Mode M9 | |||
|---|---|---|---|
| Quadrant | BADHDUFLAG | Total packets | Discarded packets |
| A | 0 | 6 | 0 |
| B | 0 | 6 | 0 |
| C | 0 | 6 | 0 |
| D | 0 | 7 | 0 |
| Mode M0 | |||
|---|---|---|---|
| Quadrant | BADHDUFLAG | Total packets | Discarded packets |
| A | 0 | 20582 | 42 |
| B | 0 | 17265 | 38 |
| C | 0 | 15631 | 20 |
| D | 0 | 22680 | 58 |
| Quadrant | Total seconds | Saturated seconds | Saturation percentage |
|---|---|---|---|
| A | 7624 | 236 | 3.095488% |
| B | 7624 | 157 | 2.059286% |
| C | 7630 | 24 | 0.314548% |
| D | 7626 | 825 | 10.818253% |
Noise dominated data is calculated using 1-second bins in cleaned event files. If a bin has >2000 counts, and if more than 50% of those come from <1% of pixels, then it is considered to be noise-dominated and hence unusable.
| Quadrant | # 1 sec bins | Bins with >0 counts | Bins with >2000 counts | High rate bins dominated by noise | Noise dominated (total time) | Noise dominated (detector-on time) | Marked lightcurve |
|---|---|---|---|---|---|---|---|
| A | 7839 | 7640 | 44 | 44 | 0.56% | 0.58% | 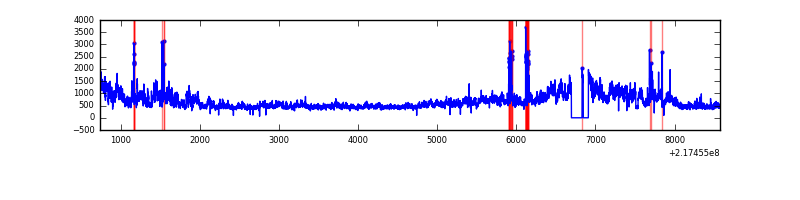 |
| B | 7839 | 7639 | 37 | 37 | 0.47% | 0.48% | 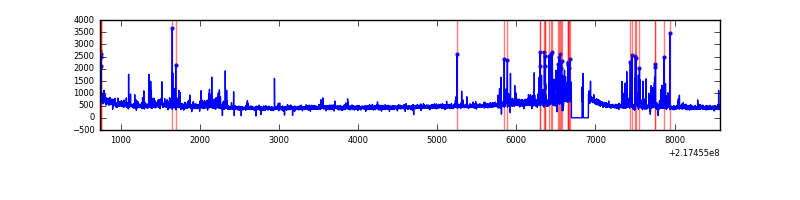 |
| C | 7839 | 7641 | 0 | 0 | 0.00% | 0.00% | 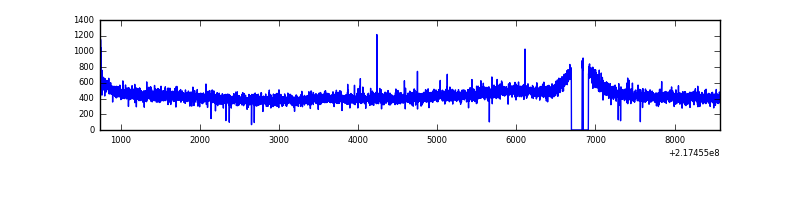 |
| D | 7839 | 7637 | 802 | 802 | 10.23% | 10.50% | 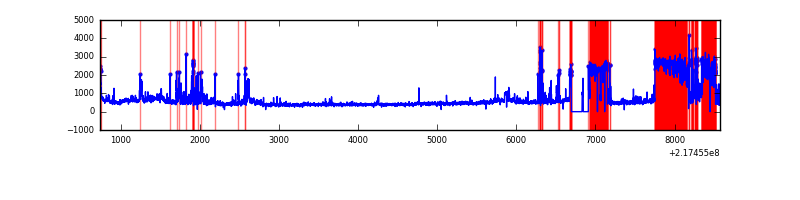 |
Top three noisy pixels from each quadrant. If the there are fewer than three noisy pixels in the level2.evt file, extra rows are filled as -1
| Pixel properties | Quadrant properties | ||||||
|---|---|---|---|---|---|---|---|
| Quadrant | DetID | PixID | Counts | Sigma | Mean | Median | Sigma |
| A | 13 | 34 | 1589690 | 8922.6 | 861 | 838 | 178.1 |
| A | 15 | 239 | 105019 | 585.05 | 861 | 838 | 178.1 |
| A | 8 | 15 | 53224 | 294.19 | 861 | 838 | 178.1 |
| B | 3 | 64 | 265035 | 1569.93 | 877 | 855 | 168.3 |
| B | 0 | 219 | 135470 | 799.97 | 877 | 855 | 168.3 |
| B | 0 | 214 | 56969 | 333.46 | 877 | 855 | 168.3 |
| C | 1 | 16 | 9973 | 46.01 | 857 | 860 | 198.1 |
| C | 13 | 61 | 6705 | 29.51 | 857 | 860 | 198.1 |
| C | 8 | 222 | 3880 | 15.25 | 857 | 860 | 198.1 |
| D | 12 | 221 | 2078073 | 10505.95 | 801 | 775 | 197.7 |
| D | 2 | 63 | 254567 | 1283.55 | 801 | 775 | 197.7 |
| D | 2 | 136 | 248809 | 1254.43 | 801 | 775 | 197.7 |
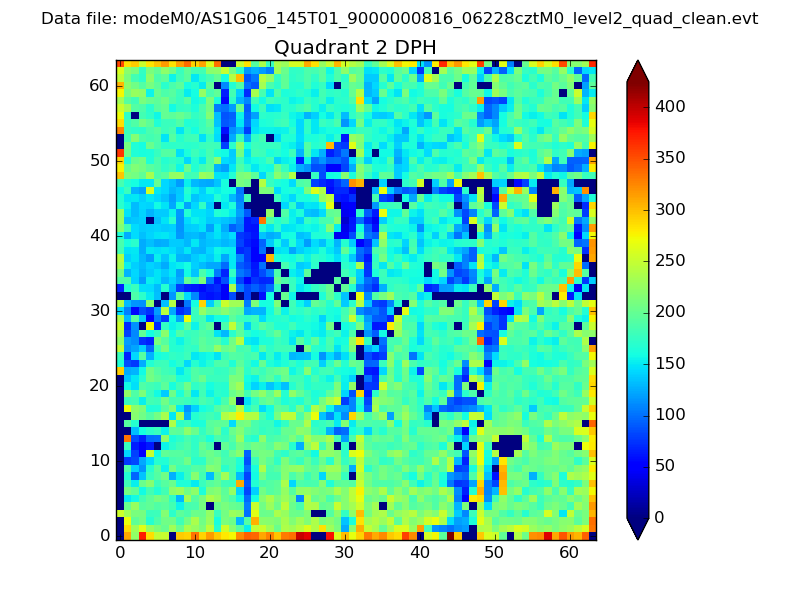
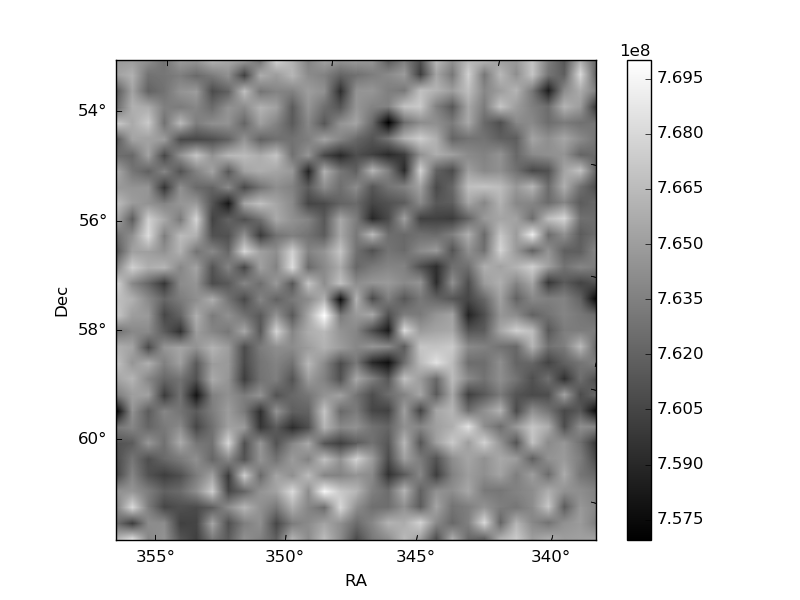
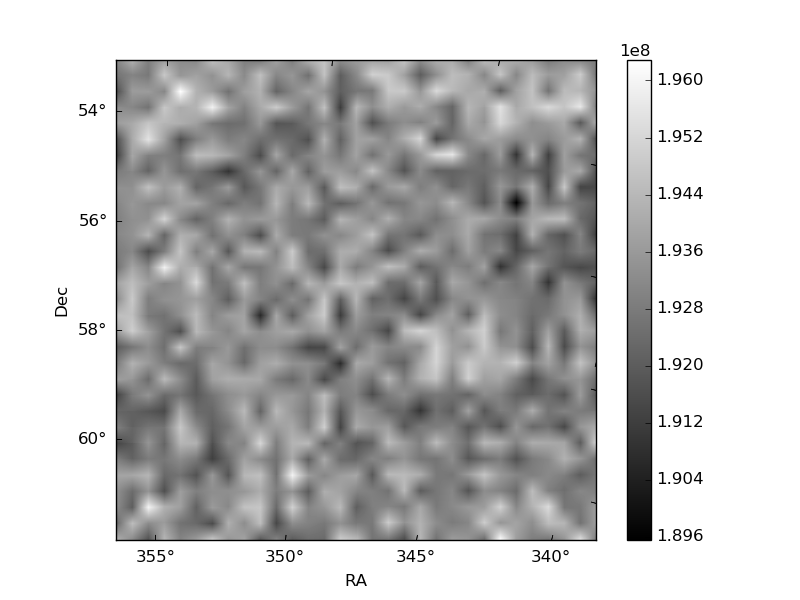
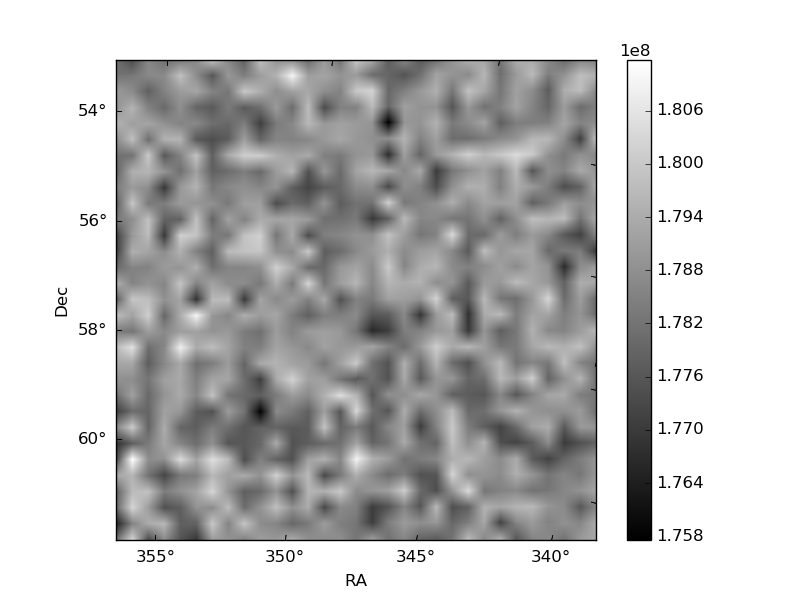
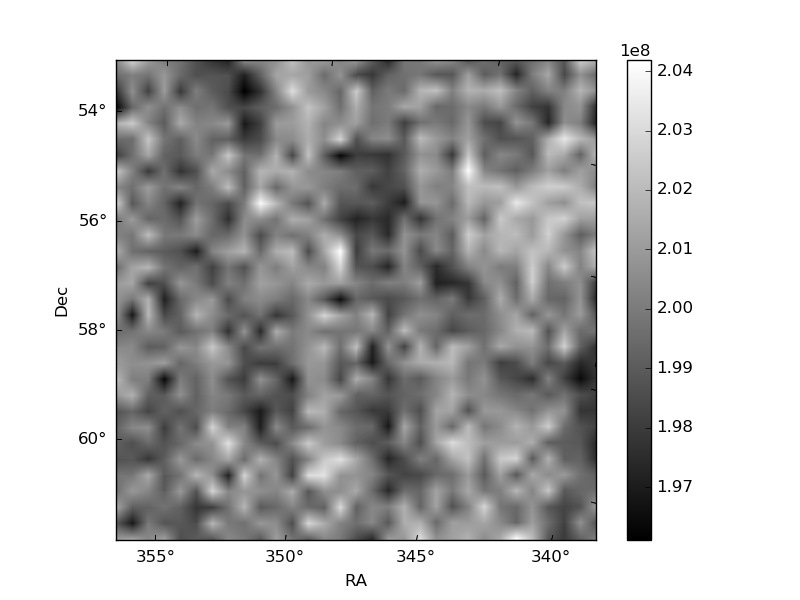
Histogram calculated using DETX and DETY for each event in the final _common_clean file
| Quadrant A | 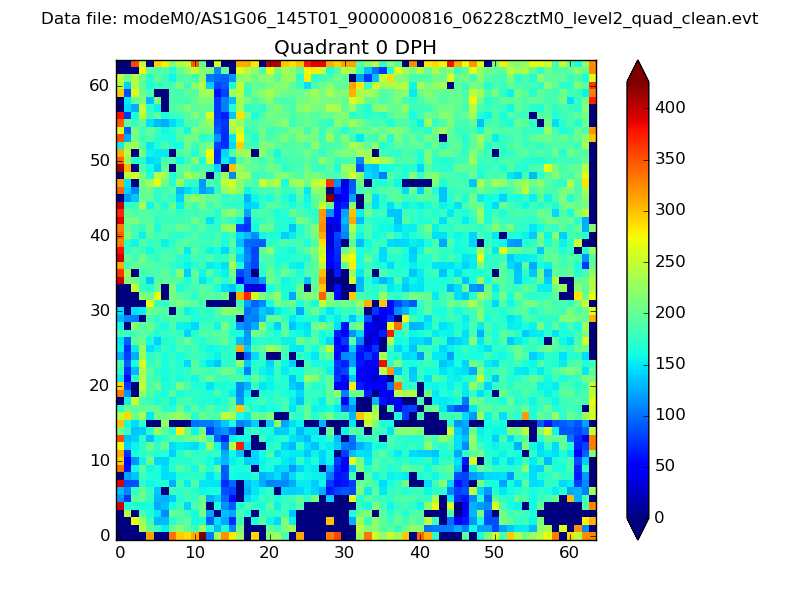 |
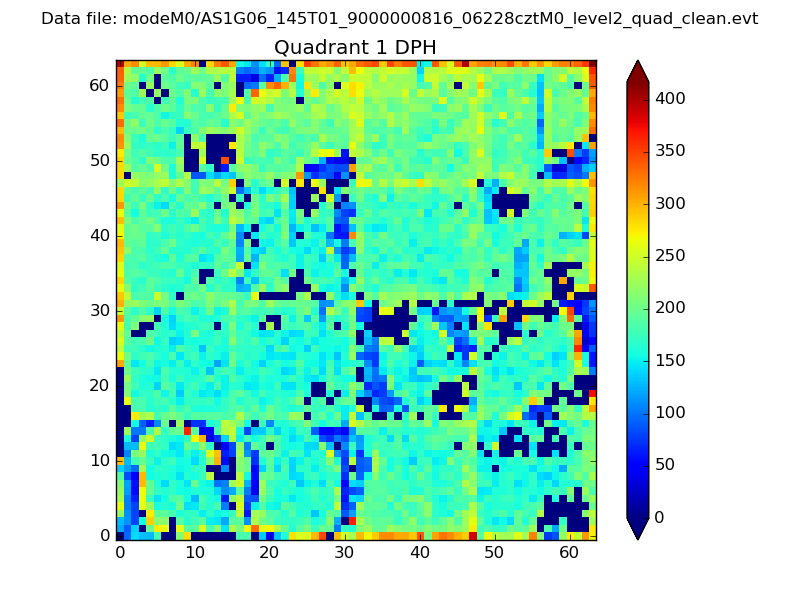 |
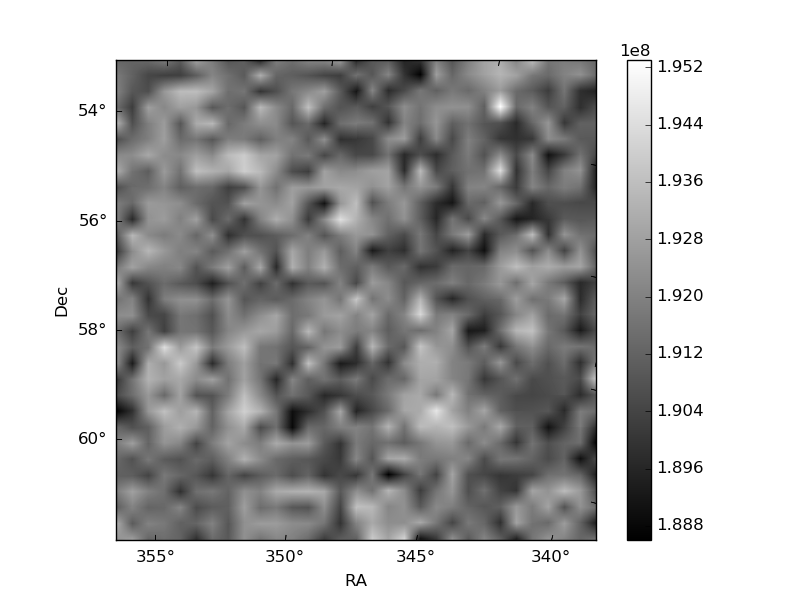
Quadrant B |
|---|---|---|---|
| Quadrant D | 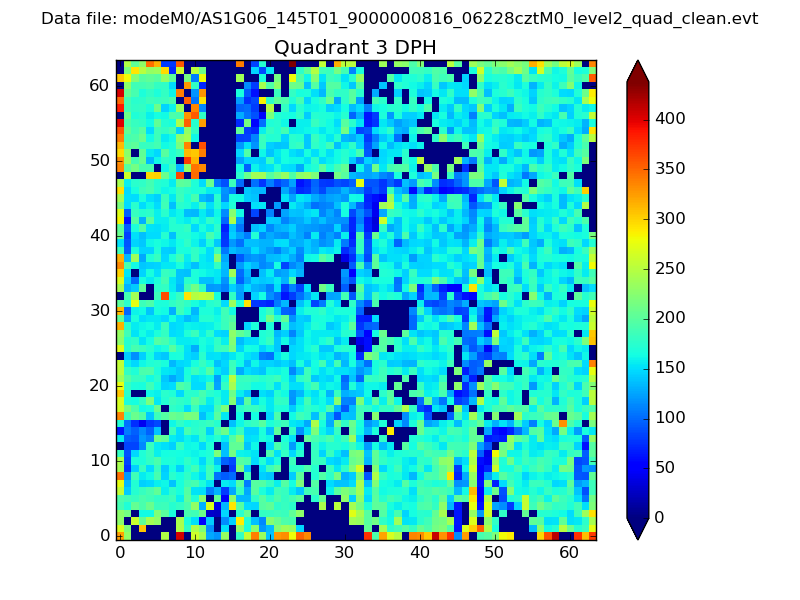 |
 |
Quadrant C |
| Plot type | Count rate plots | Images |
|---|---|---|
| Comparison with Poisson distribution Blue bars denote a histogram of data divided into 1 sec bins. Red curve is a Poisson curve with rate = median count rate of data. |
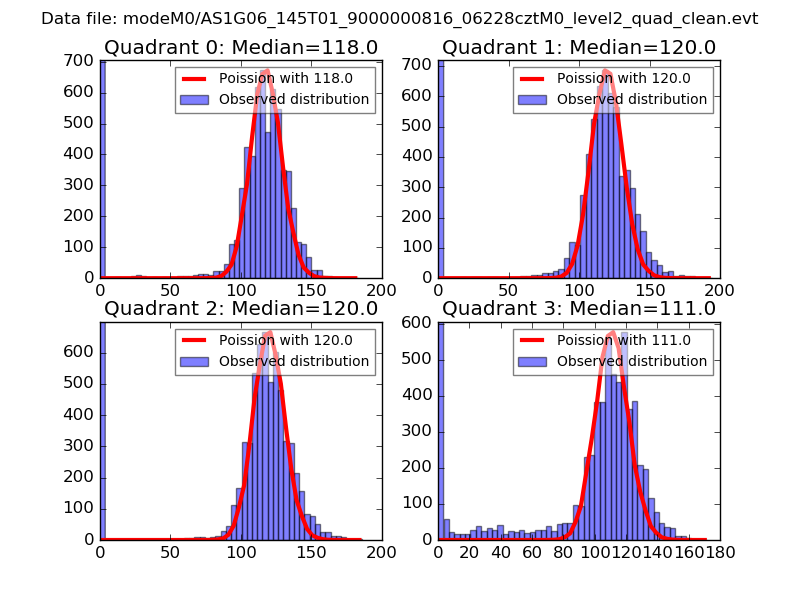 |
 |
| Quadrant-wise count rates Data is divided into 100 sec bins |
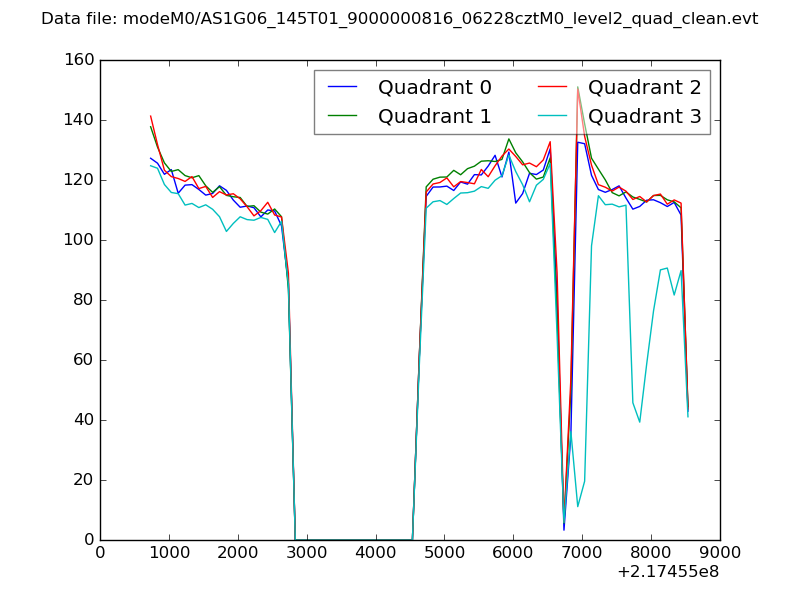 |
|
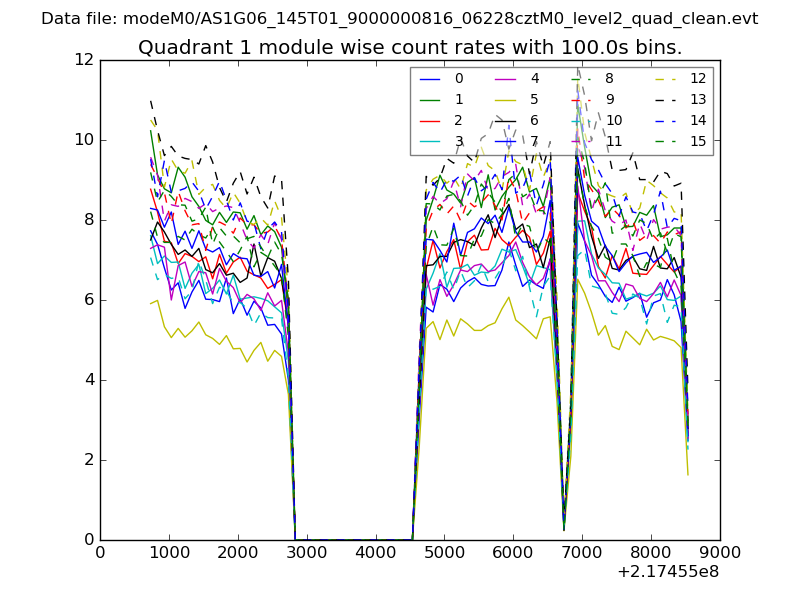
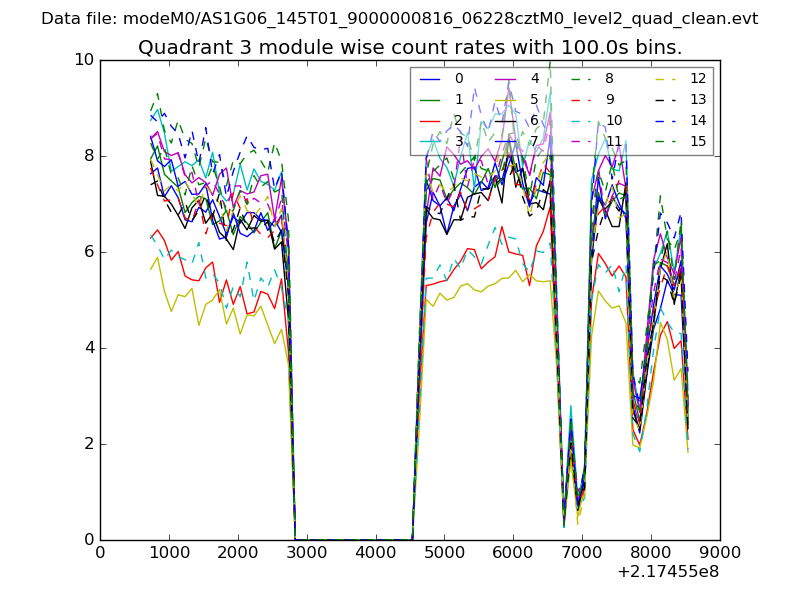
| Module-wise count rates for Quadrant A Data is divided into 100 sec bins |
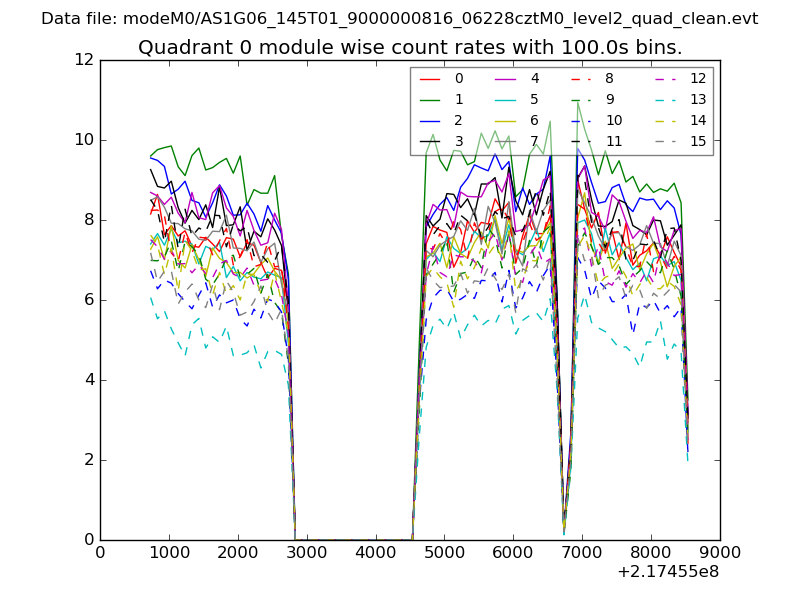 |
 |
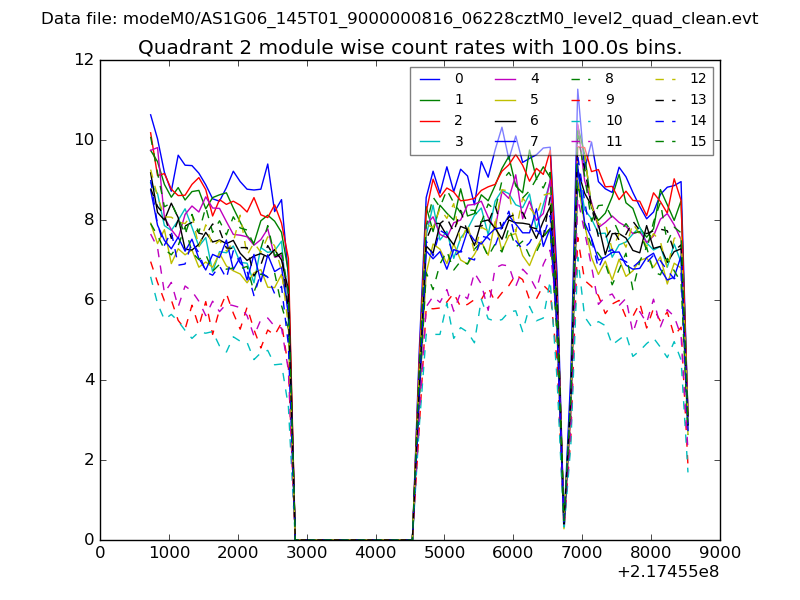
| Module-wise count rates for Quadrant B Data is divided into 100 sec bins |
 |
 |
| Module-wise count rates for Quadrant C Data is divided into 100 sec bins |
 |
 |
| Module-wise count rates for Quadrant D Data is divided into 100 sec bins |
 |
 |
| Parameter | Plot |
|---|---|
| CZT HV Monitor | 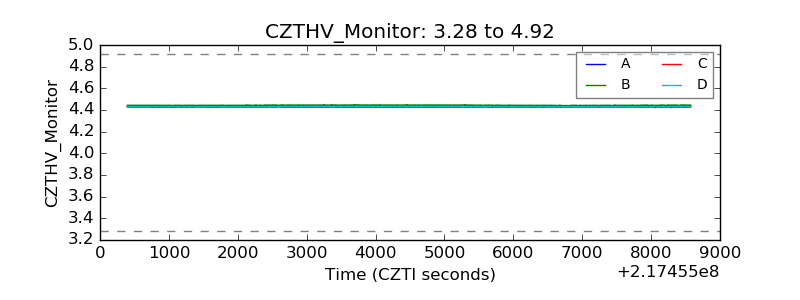 |
| D_VDD | 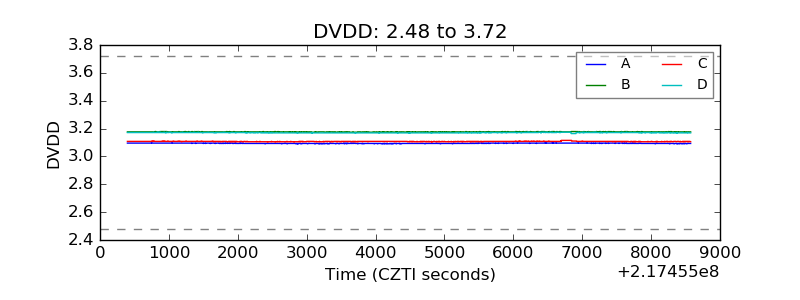 |
| Temperature 1 | 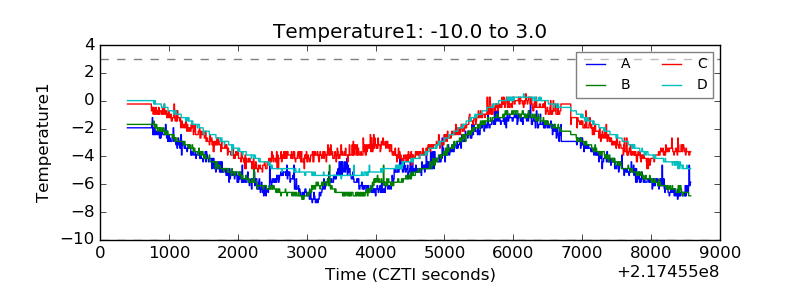 |
| Veto HV Monitor | 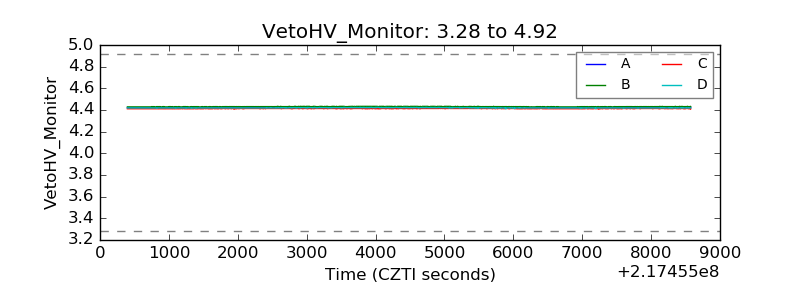 |
| Veto LLD |  |
| Alpha Counter | 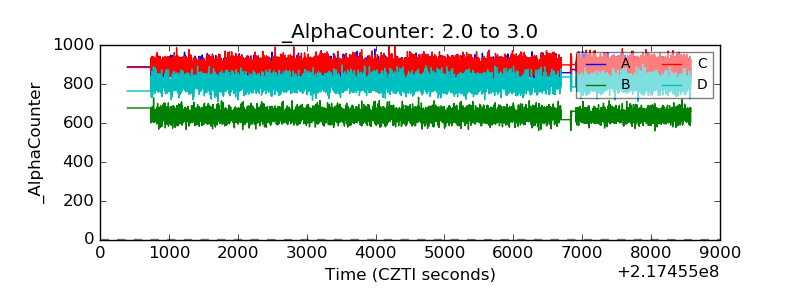 |
| _CPM_Rate | 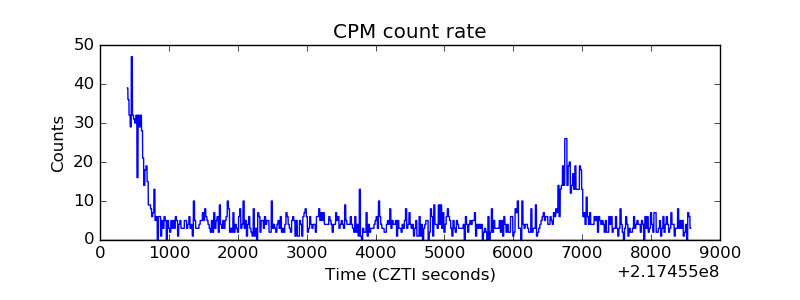 |
| CZT Counter | 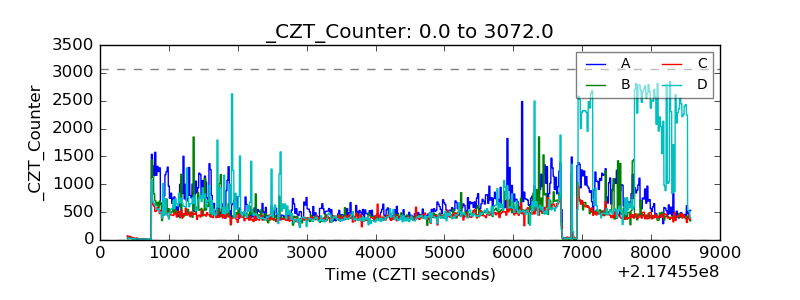 |
| +2.5 Volts monitor |  |
| +5 Volts monitor |  |
| _ROLL_ROT | 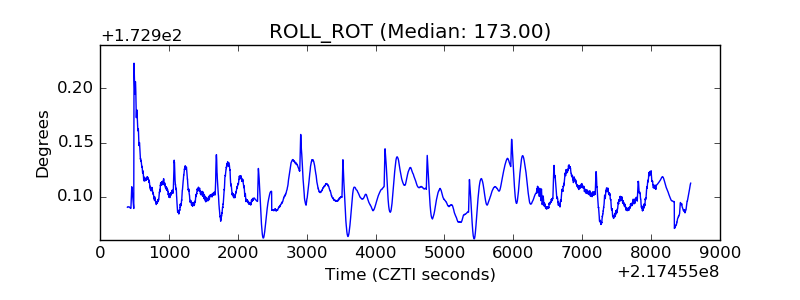 |
| _Roll_DEC |  |
| _Roll_RA | 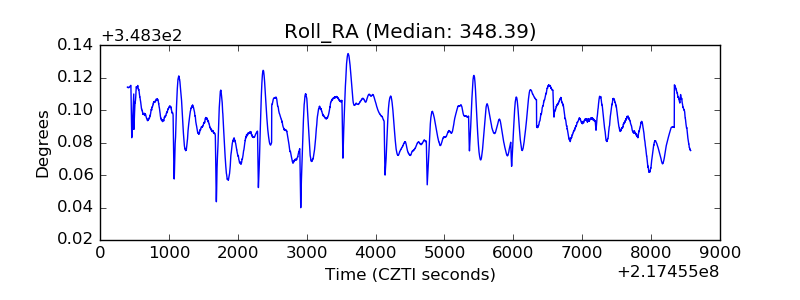 |
| Veto Counter | 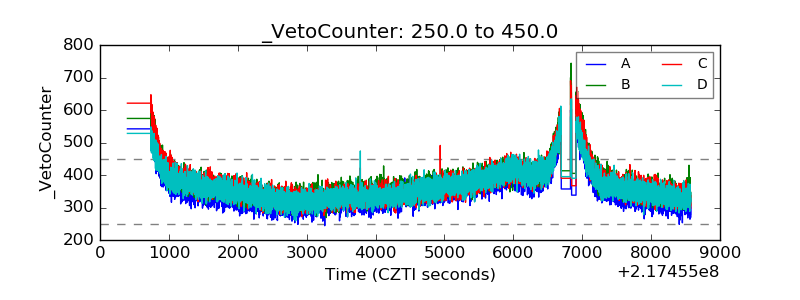 |