| Param | Original file | Final file |
|---|---|---|
| Filename | modeM0/AS1A02_151T01_9000000818cztM0_level2.fits | modeM0/AS1A02_151T01_9000000818cztM0_level2_quad_clean.evt |
| Size (bytes) | 980,320,320 | 1,069,577,280 |
| Size | 934.9 MB | 1020.0 MB |
| Events in quadrant A | 5,867,106 | 6,563,308 |
| Events in quadrant B | 5,670,516 | 6,466,126 |
| Events in quadrant C | 5,812,892 | 6,250,134 |
| Events in quadrant D | 4,972,436 | 5,750,541 |
| Mode SS | |||
|---|---|---|---|
| Quadrant | BADHDUFLAG | Total packets | Discarded packets |
| A | 0 | 2190 | 0 |
| B | 0 | 2194 | 0 |
| C | 0 | 2192 | 0 |
| D | 0 | 2194 | 0 |
| Mode M9 | |||
|---|---|---|---|
| Quadrant | BADHDUFLAG | Total packets | Discarded packets |
| A | 0 | 171 | 0 |
| B | 0 | 173 | 0 |
| C | 0 | 173 | 0 |
| D | 0 | 173 | 0 |
| Mode M0 | |||
|---|---|---|---|
| Quadrant | BADHDUFLAG | Total packets | Discarded packets |
| A | 0 | 224669 | 0 |
| B | 0 | 239031 | 0 |
| C | 0 | 219390 | 0 |
| D | 0 | 255540 | 0 |
| Quadrant | Total seconds | Saturated seconds | Saturation percentage |
|---|---|---|---|
| A | 107461 | 1300 | 1.209741% |
| B | 107450 | 2669 | 2.483946% |
| C | 107467 | 788 | 0.733248% |
| D | 107381 | 2435 | 2.267626% |
Noise dominated data is calculated using 1-second bins in cleaned event files. If a bin has >2000 counts, and if more than 50% of those come from <1% of pixels, then it is considered to be noise-dominated and hence unusable.
| Quadrant | # 1 sec bins | Bins with >0 counts | Bins with >2000 counts | High rate bins dominated by noise | Noise dominated (total time) | Noise dominated (detector-on time) | Marked lightcurve |
|---|---|---|---|---|---|---|---|
| A | 157954 | 107704 | 0 | 0 | 0.00% | 0.00% |  |
| B | 157955 | 107633 | 0 | 0 | 0.00% | 0.00% | 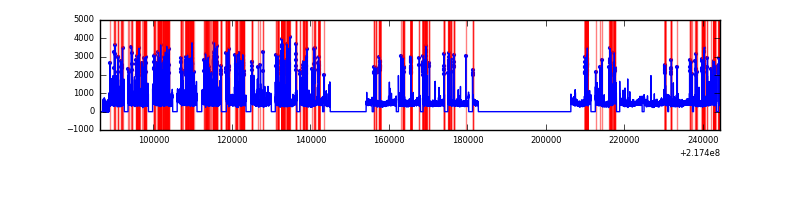 |
| C | 157954 | 107701 | 0 | 0 | 0.00% | 0.00% |  |
| D | 157955 | 107578 | 0 | 0 | 0.00% | 0.00% | 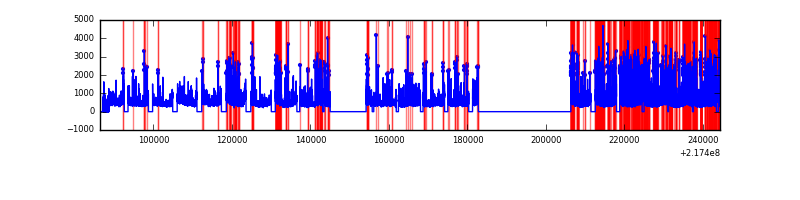 |
Top three noisy pixels from each quadrant. If the there are fewer than three noisy pixels in the level2.evt file, extra rows are filled as -1
| Pixel properties | Quadrant properties | ||||||
|---|---|---|---|---|---|---|---|
| Quadrant | DetID | PixID | Counts | Sigma | Mean | Median | Sigma |
| A | 0 | 29 | 5721 | 11.27 | 1526 | 1427 | 380.9 |
| A | 7 | 110 | 5062 | 9.54 | 1526 | 1427 | 380.9 |
| A | 0 | 30 | 4452 | 7.94 | 1526 | 1427 | 380.9 |
| B | 2 | 9 | 4866 | 11.7 | 1493 | 1419 | 294.6 |
| B | 12 | 226 | 3934 | 8.54 | 1493 | 1419 | 294.6 |
| B | 14 | 254 | 3858 | 8.28 | 1493 | 1419 | 294.6 |
| C | 1 | 80 | 4267 | 7.07 | 1532 | 1415 | 403.7 |
| C | 1 | 81 | 4191 | 6.88 | 1532 | 1415 | 403.7 |
| C | 12 | 241 | 4114 | 6.69 | 1532 | 1415 | 403.7 |
| D | 6 | 231 | 3812 | 6.62 | 1418 | 1289 | 380.8 |
| D | 3 | 14 | 3753 | 6.47 | 1418 | 1289 | 380.8 |
| D | 3 | 31 | 3674 | 6.26 | 1418 | 1289 | 380.8 |
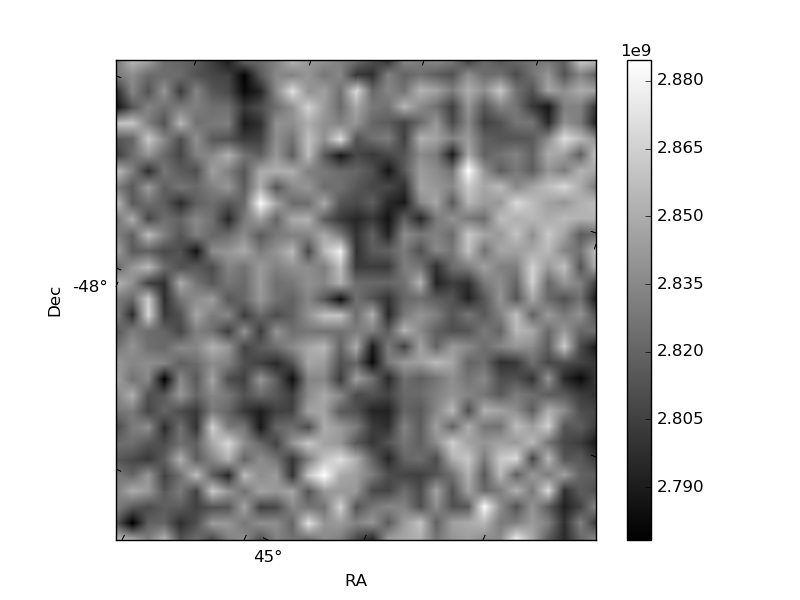
Histogram calculated using DETX and DETY for each event in the final _common_clean file
| Quadrant A | 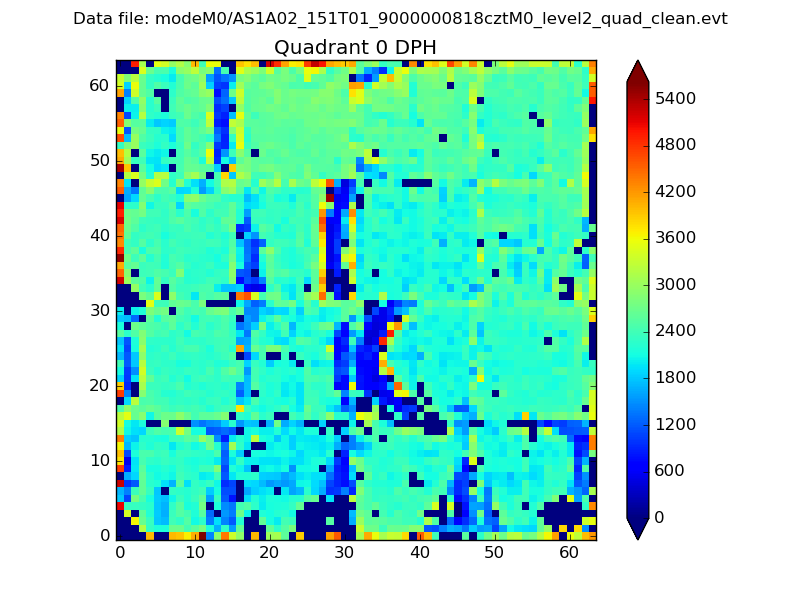 |
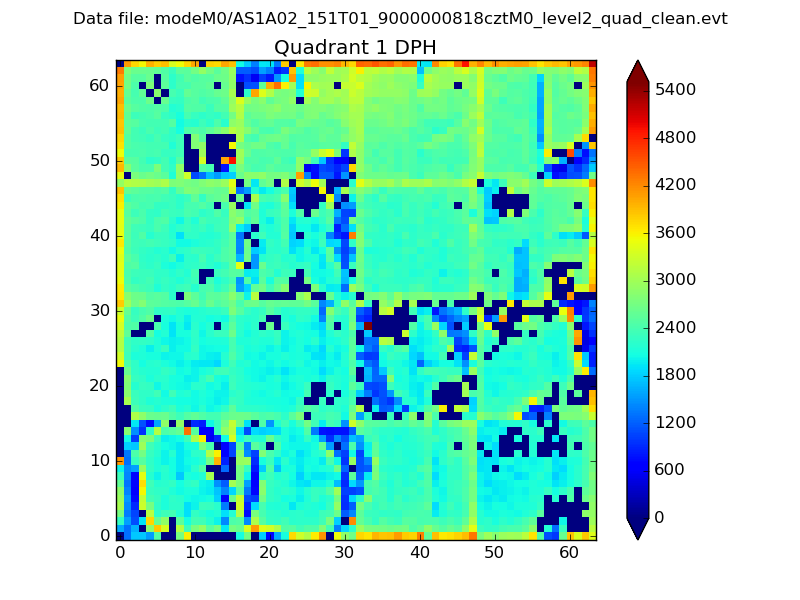 |
Quadrant B |
|---|---|---|---|
| Quadrant D |  |
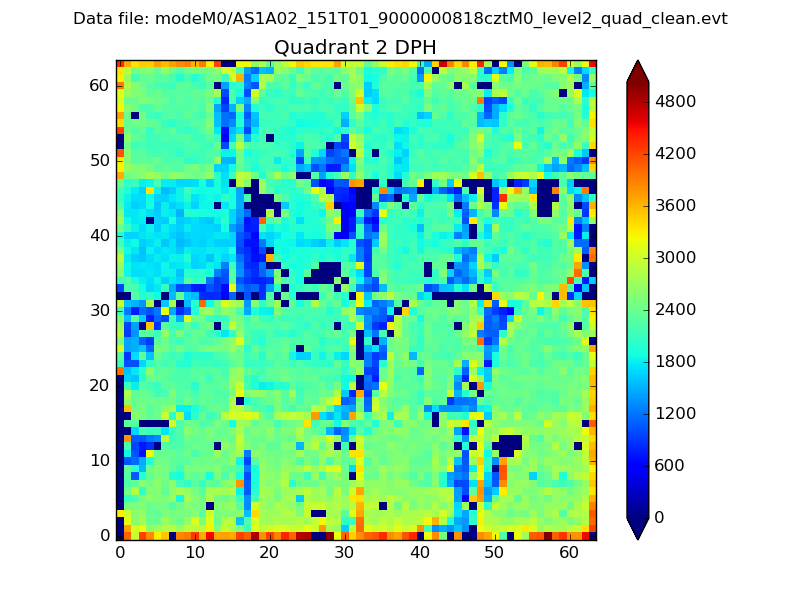 |
Quadrant C |
| Plot type | Count rate plots | Images |
|---|---|---|
| Comparison with Poisson distribution Blue bars denote a histogram of data divided into 1 sec bins. Red curve is a Poisson curve with rate = median count rate of data. |
 |
 |
| Quadrant-wise count rates Data is divided into 100 sec bins |
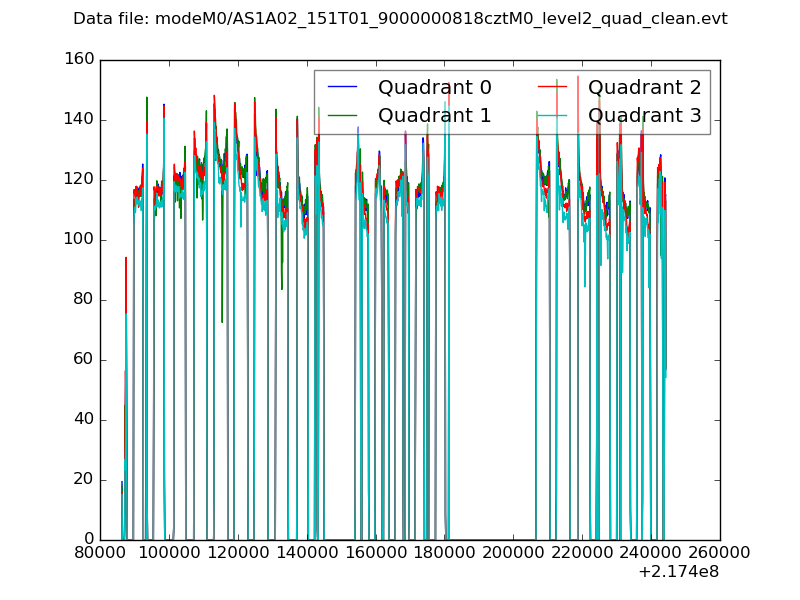 |
|
| Module-wise count rates for Quadrant A Data is divided into 100 sec bins |
 |
 |
| Module-wise count rates for Quadrant B Data is divided into 100 sec bins |
 |
 |
| Module-wise count rates for Quadrant C Data is divided into 100 sec bins |
 |
 |
| Module-wise count rates for Quadrant D Data is divided into 100 sec bins |
 |
 |
| Parameter | Plot |
|---|---|
| CZT HV Monitor |  |
| D_VDD | 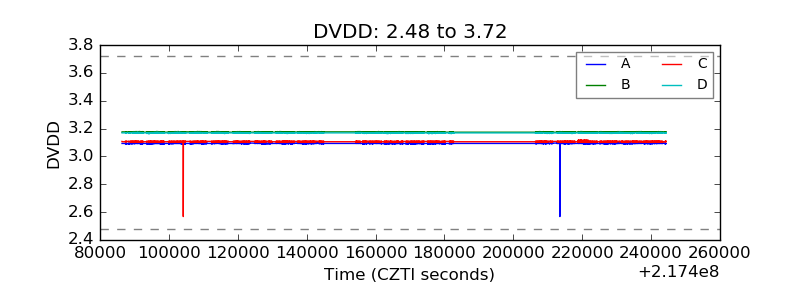 |
| Temperature 1 |  |
| Veto HV Monitor |  |
| Veto LLD |  |
| Alpha Counter |  |
| _CPM_Rate | 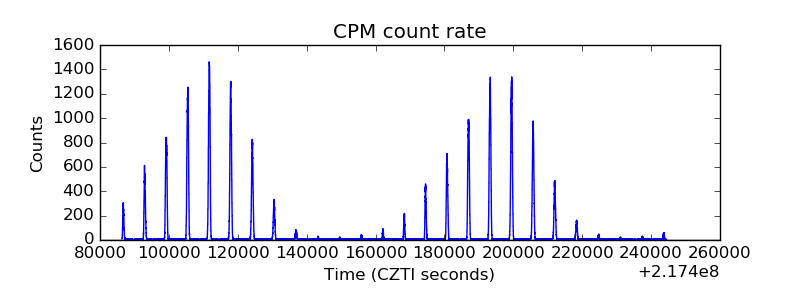 |
| CZT Counter |  |
| +2.5 Volts monitor |  |
| +5 Volts monitor |  |
| _ROLL_ROT |  |
| _Roll_DEC |  |
| _Roll_RA |  |
| Veto Counter |  |