| Param | Original file | Final file |
|---|---|---|
| Filename | modeM0/AS1A02_151T01_9000000818_06235cztM0_level2.evt | modeM0/AS1A02_151T01_9000000818_06235cztM0_level2_quad_clean.evt |
| Size (bytes) | 451,589,760 | 65,643,840 |
| Size | 430.7 MB | 62.6 MB |
| Events in quadrant A | 3,253,808 | 383,802 |
| Events in quadrant B | 3,589,416 | 383,191 |
| Events in quadrant C | 2,995,221 | 387,378 |
| Events in quadrant D | 3,390,837 | 374,468 |
| Mode SS | |||
|---|---|---|---|
| Quadrant | BADHDUFLAG | Total packets | Discarded packets |
| A | 0 | 134 | 0 |
| B | 0 | 134 | 0 |
| C | 0 | 134 | 0 |
| D | 0 | 134 | 0 |
| Mode M9 | |||
|---|---|---|---|
| Quadrant | BADHDUFLAG | Total packets | Discarded packets |
| A | 0 | 15 | 0 |
| B | 0 | 15 | 0 |
| C | 0 | 15 | 0 |
| D | 0 | 16 | 0 |
| Mode M0 | |||
|---|---|---|---|
| Quadrant | BADHDUFLAG | Total packets | Discarded packets |
| A | 0 | 13951 | 3 |
| B | 0 | 14948 | 2 |
| C | 0 | 13486 | 2 |
| D | 0 | 14290 | 2 |
| Quadrant | Total seconds | Saturated seconds | Saturation percentage |
|---|---|---|---|
| A | 6576 | 98 | 1.490268% |
| B | 6576 | 164 | 2.493917% |
| C | 6576 | 43 | 0.653893% |
| D | 6576 | 62 | 0.942822% |
Noise dominated data is calculated using 1-second bins in cleaned event files. If a bin has >2000 counts, and if more than 50% of those come from <1% of pixels, then it is considered to be noise-dominated and hence unusable.
| Quadrant | # 1 sec bins | Bins with >0 counts | Bins with >2000 counts | High rate bins dominated by noise | Noise dominated (total time) | Noise dominated (detector-on time) | Marked lightcurve |
|---|---|---|---|---|---|---|---|
| A | 7656 | 6576 | 28 | 28 | 0.37% | 0.43% | 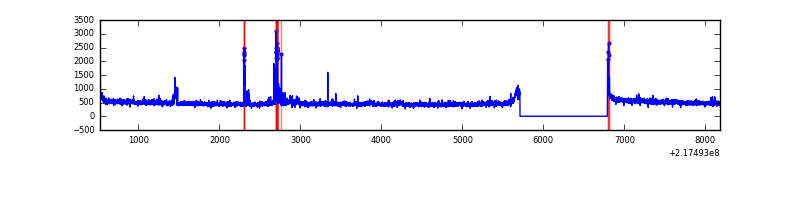 |
| B | 7656 | 6576 | 69 | 69 | 0.90% | 1.05% | 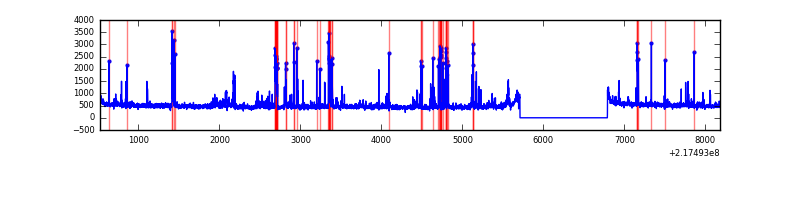 |
| C | 7656 | 6576 | 0 | 0 | 0.00% | 0.00% | 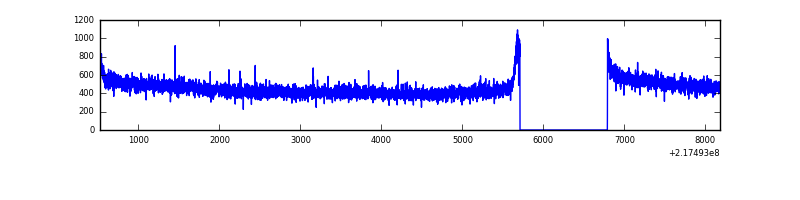 |
| D | 7656 | 6576 | 6 | 6 | 0.08% | 0.09% | 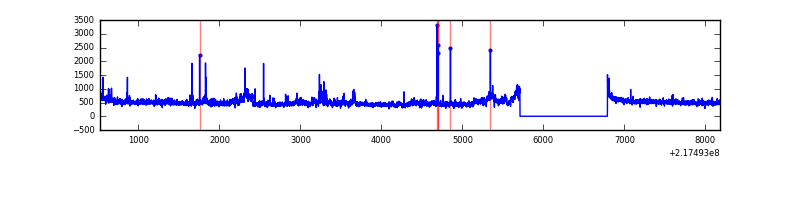 |
Top three noisy pixels from each quadrant. If the there are fewer than three noisy pixels in the level2.evt file, extra rows are filled as -1
| Pixel properties | Quadrant properties | ||||||
|---|---|---|---|---|---|---|---|
| Quadrant | DetID | PixID | Counts | Sigma | Mean | Median | Sigma |
| A | 15 | 239 | 83415 | 520.39 | 779 | 762 | 158.8 |
| A | 15 | 236 | 72136 | 449.37 | 779 | 762 | 158.8 |
| A | 8 | 15 | 71709 | 446.69 | 779 | 762 | 158.8 |
| B | 3 | 64 | 437037 | 2914.88 | 782 | 764 | 149.7 |
| B | 0 | 219 | 48707 | 320.32 | 782 | 764 | 149.7 |
| B | 4 | 81 | 30949 | 201.68 | 782 | 764 | 149.7 |
| C | 13 | 61 | 5974 | 29.26 | 767 | 772 | 177.8 |
| C | 8 | 222 | 1971 | 6.74 | 767 | 772 | 177.8 |
| C | 3 | 202 | 1940 | 6.57 | 767 | 772 | 177.8 |
| D | 11 | 241 | 258317 | 1391.33 | 764 | 740 | 185.1 |
| D | 2 | 63 | 153549 | 825.42 | 764 | 740 | 185.1 |
| D | 14 | 173 | 29160 | 153.51 | 764 | 740 | 185.1 |
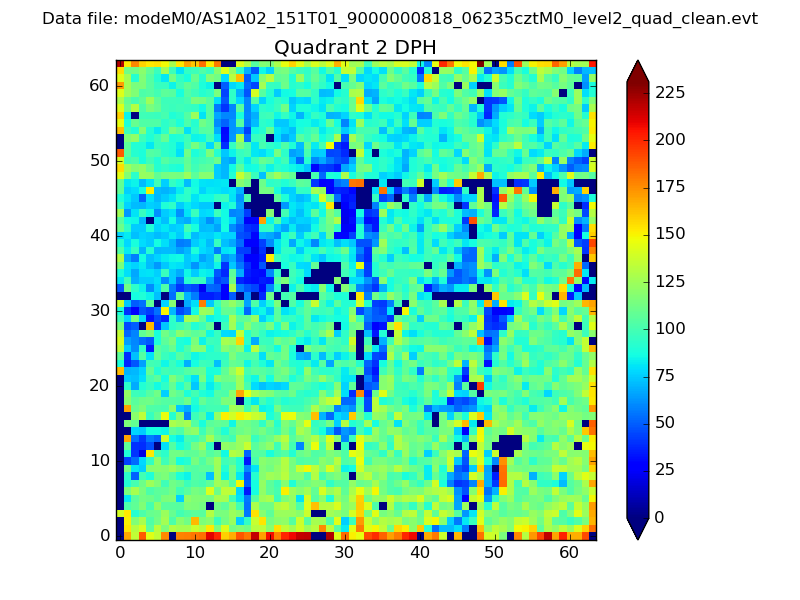
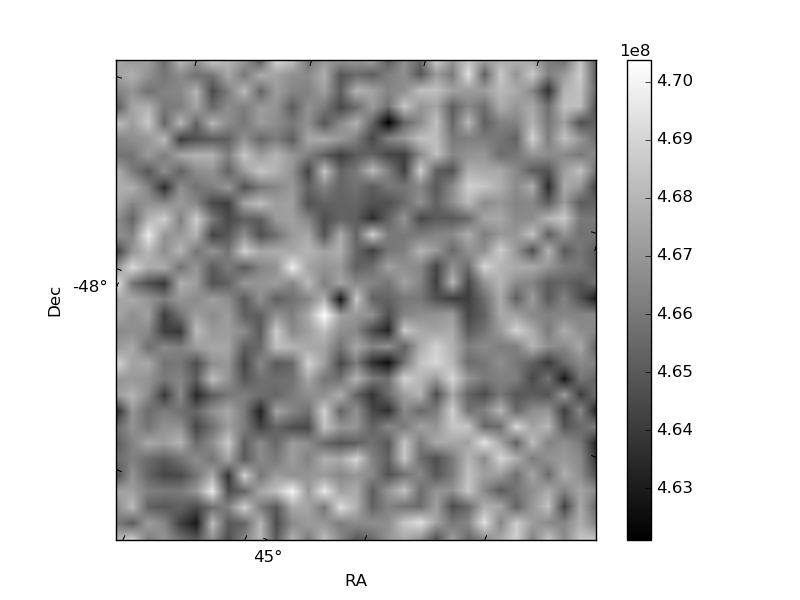
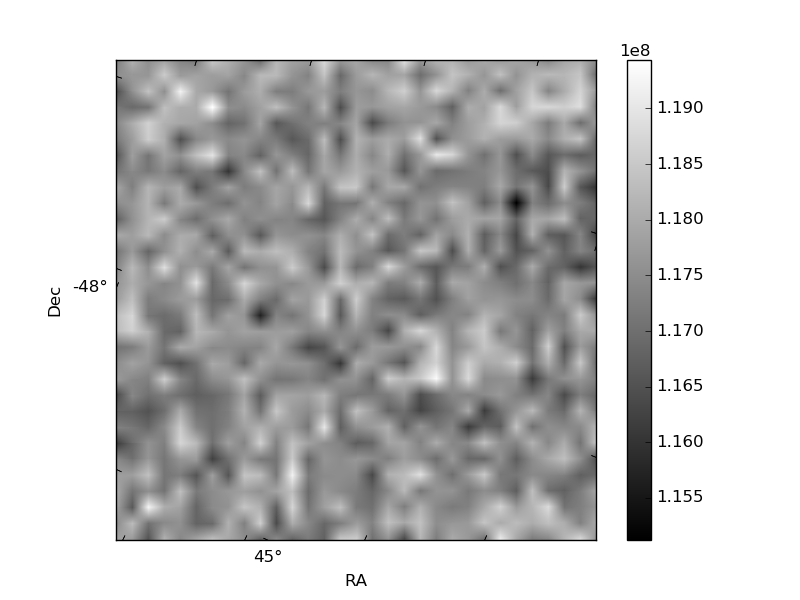
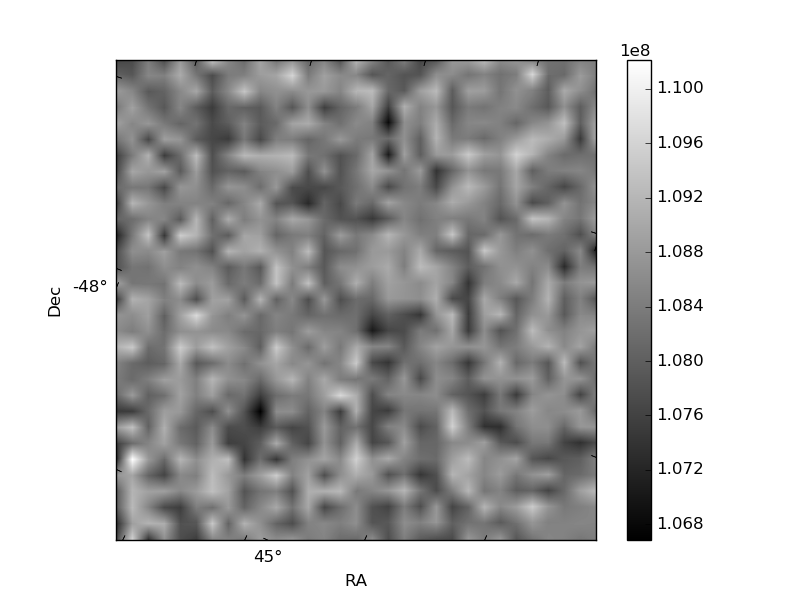
Histogram calculated using DETX and DETY for each event in the final _common_clean file
| Quadrant A | 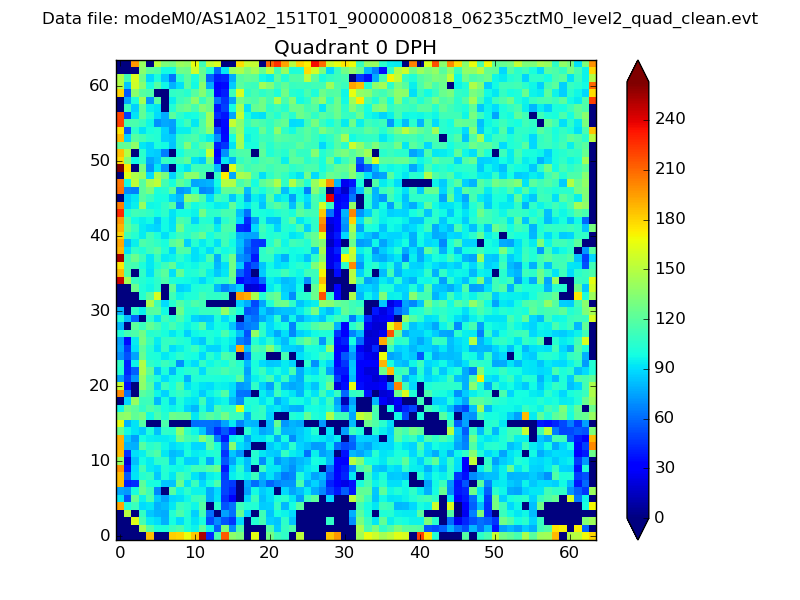 |
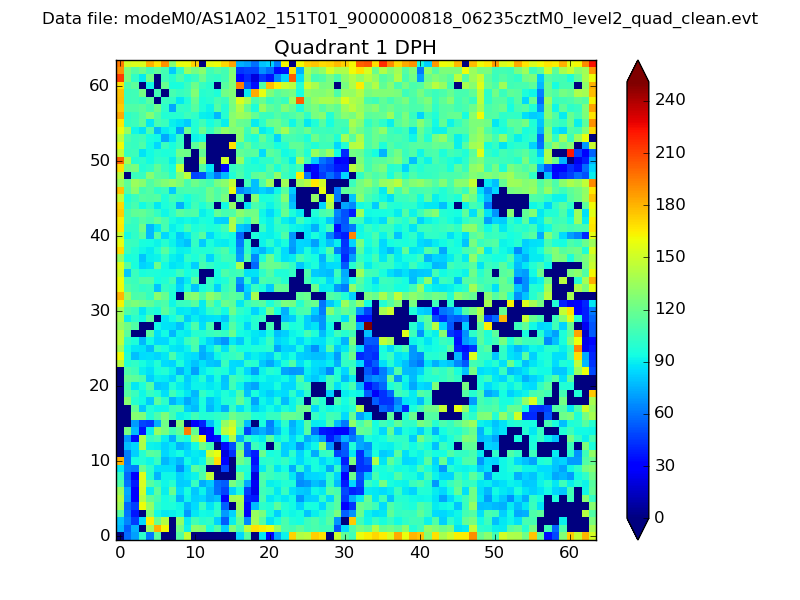 |
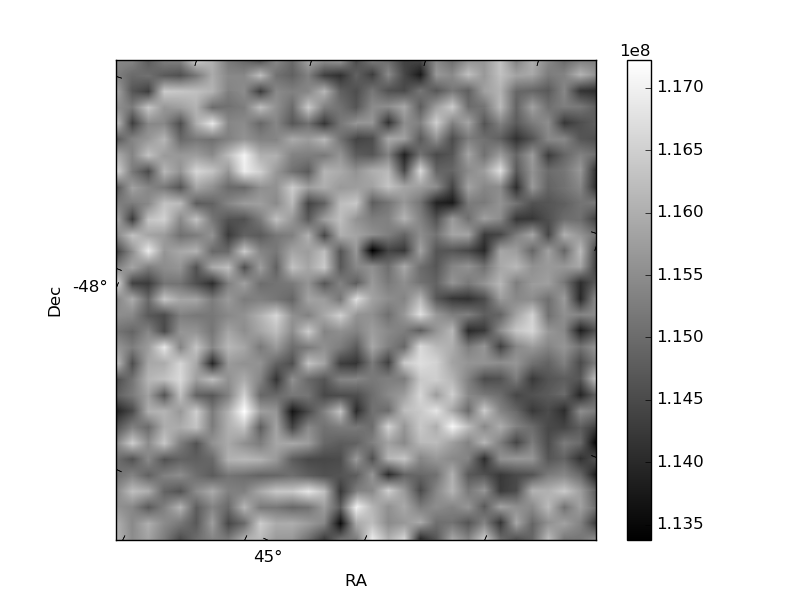
Quadrant B |
|---|---|---|---|
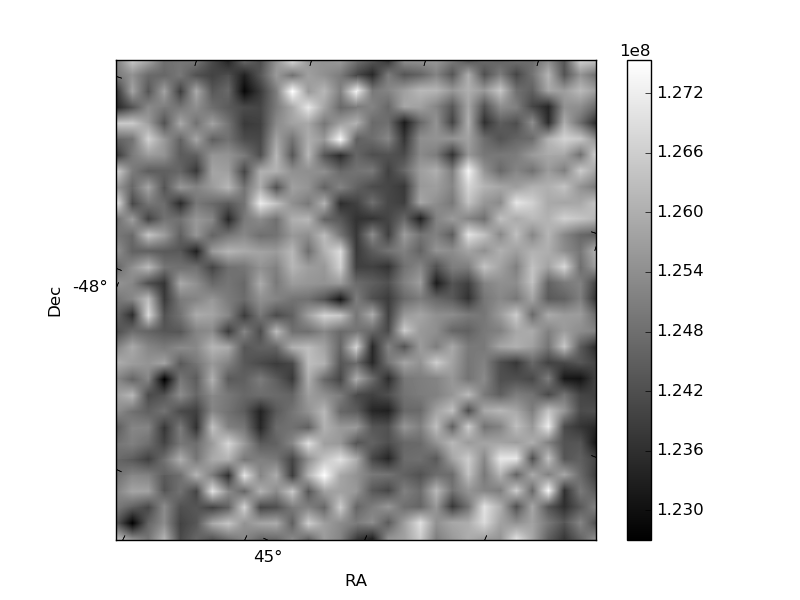
| Quadrant D | 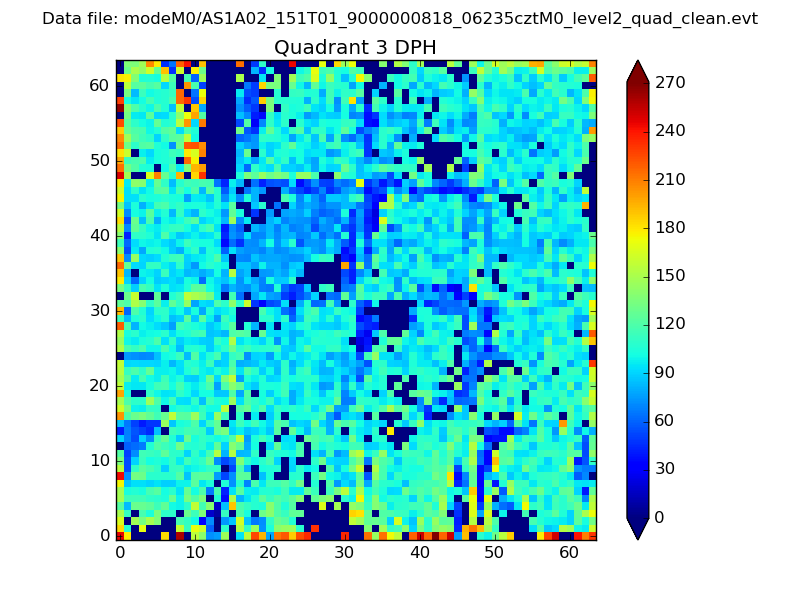 |
 |
Quadrant C |
| Plot type | Count rate plots | Images |
|---|---|---|
| Comparison with Poisson distribution Blue bars denote a histogram of data divided into 1 sec bins. Red curve is a Poisson curve with rate = median count rate of data. |
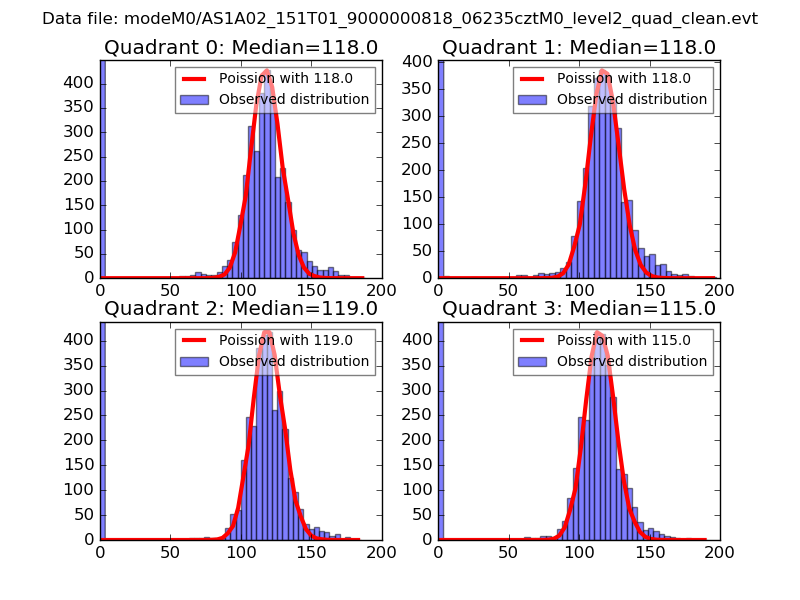 |
 |
| Quadrant-wise count rates Data is divided into 100 sec bins |
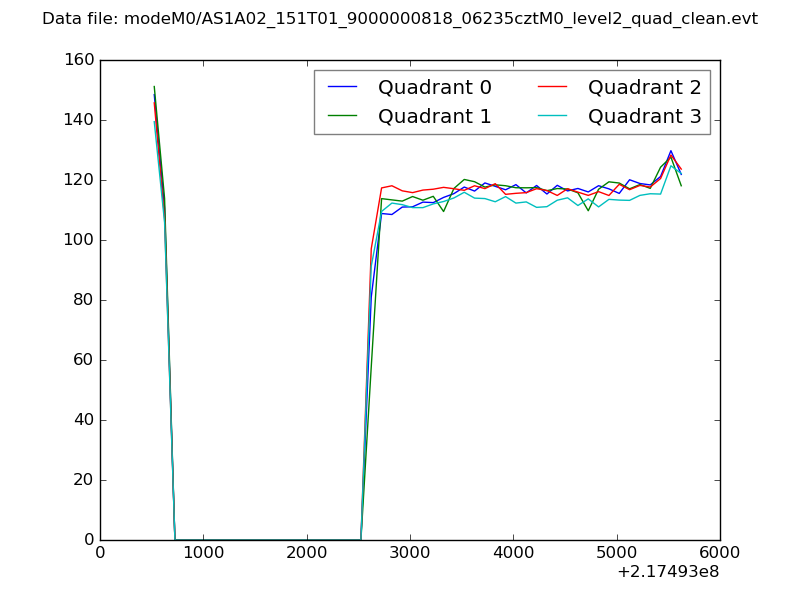 |
|
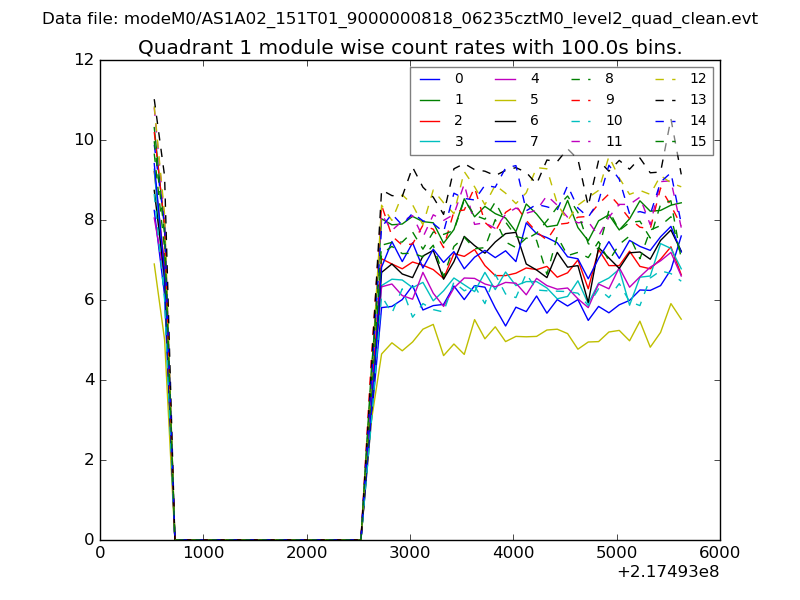
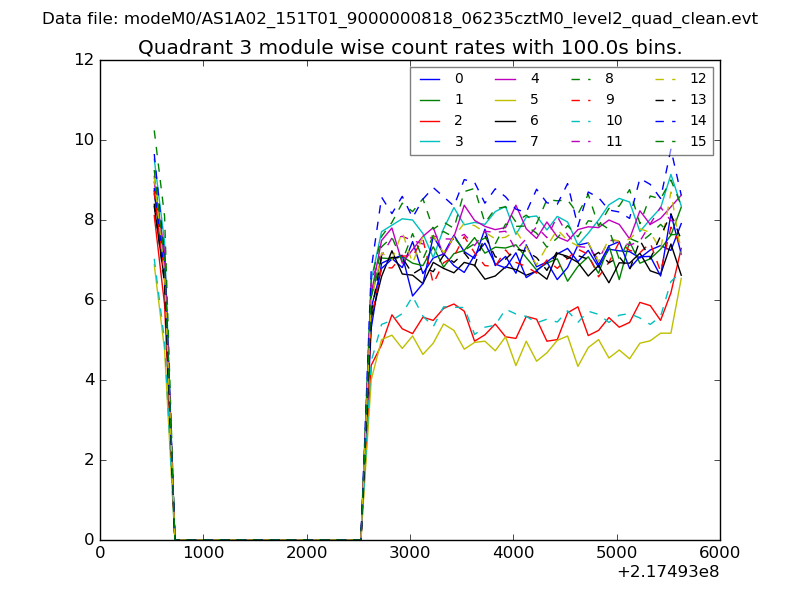
| Module-wise count rates for Quadrant A Data is divided into 100 sec bins |
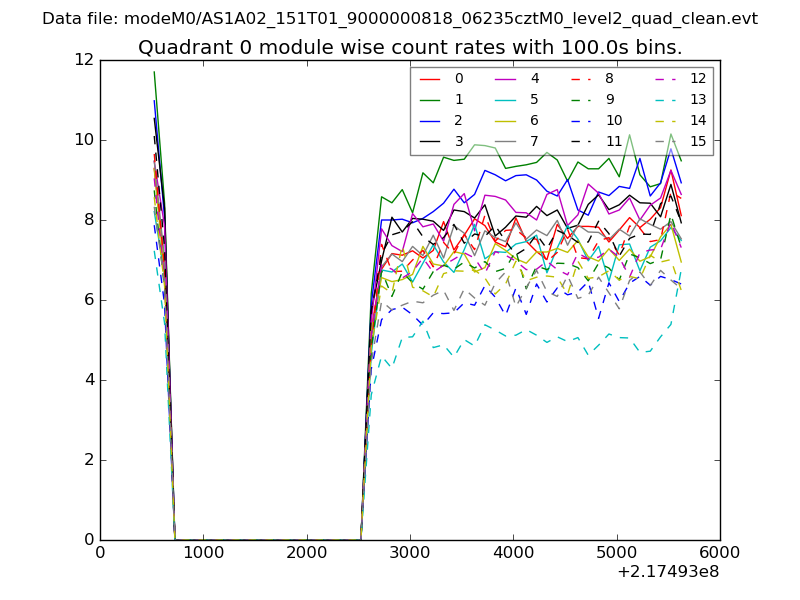 |
 |
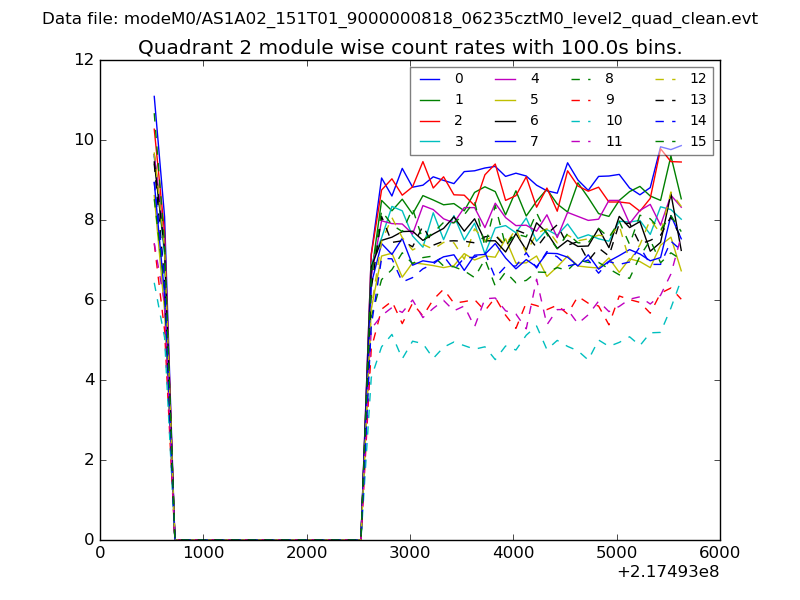
| Module-wise count rates for Quadrant B Data is divided into 100 sec bins |
 |
 |
| Module-wise count rates for Quadrant C Data is divided into 100 sec bins |
 |
 |
| Module-wise count rates for Quadrant D Data is divided into 100 sec bins |
 |
 |
| Parameter | Plot |
|---|---|
| CZT HV Monitor | 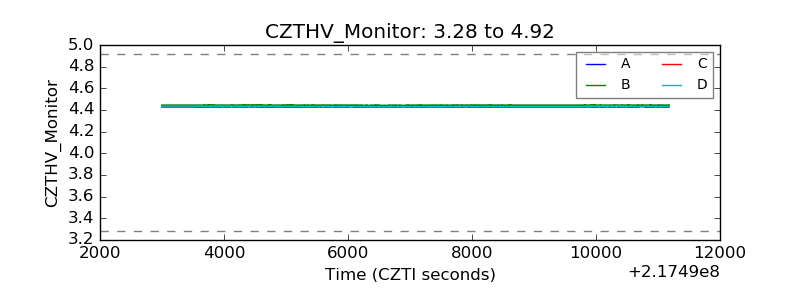 |
| D_VDD | 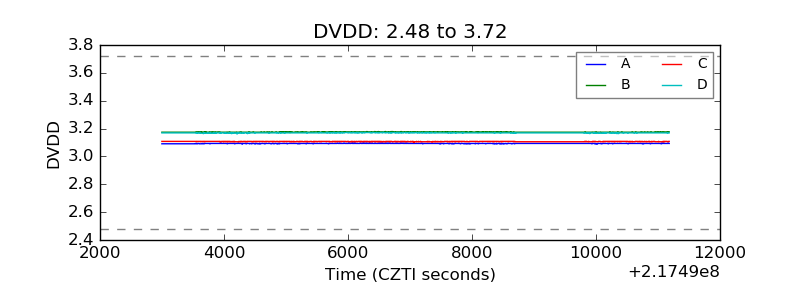 |
| Temperature 1 | 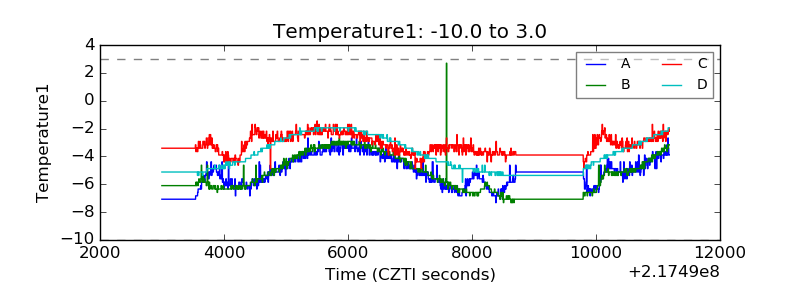 |
| Veto HV Monitor | 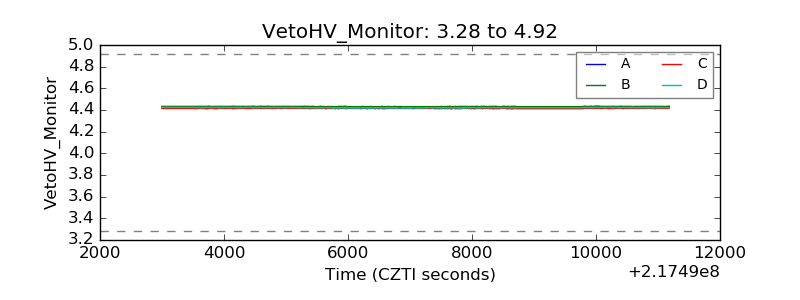 |
| Veto LLD | 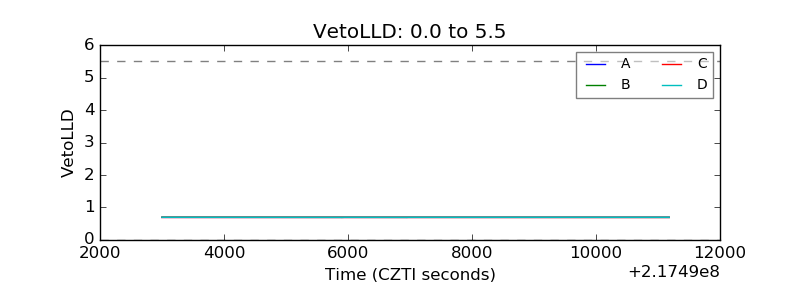 |
| Alpha Counter | 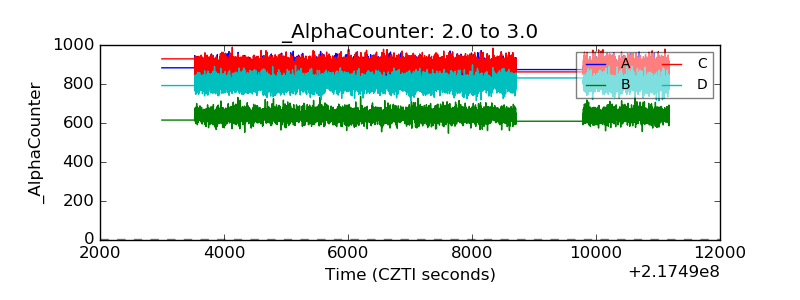 |
| _CPM_Rate | 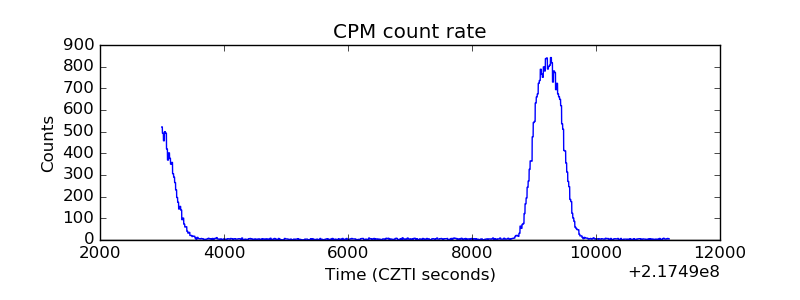 |
| CZT Counter | 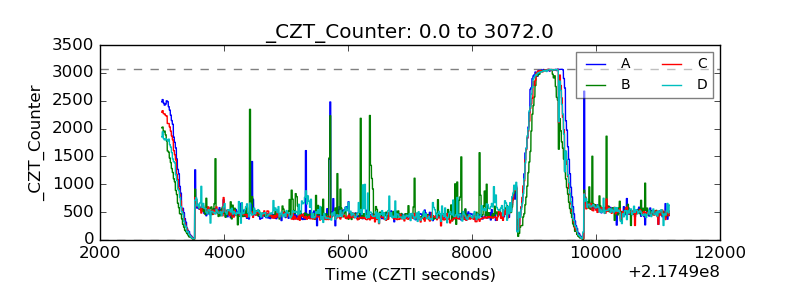 |
| +2.5 Volts monitor |  |
| +5 Volts monitor |  |
| _ROLL_ROT | 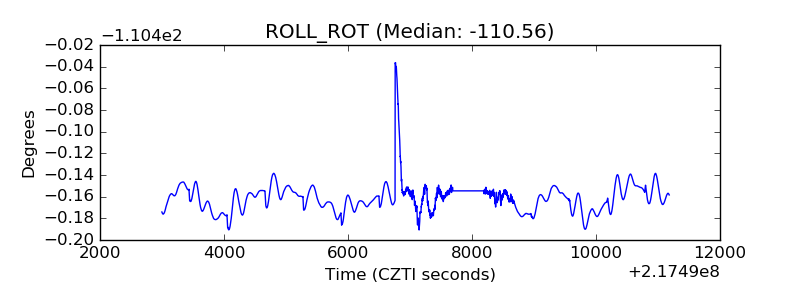 |
| _Roll_DEC | 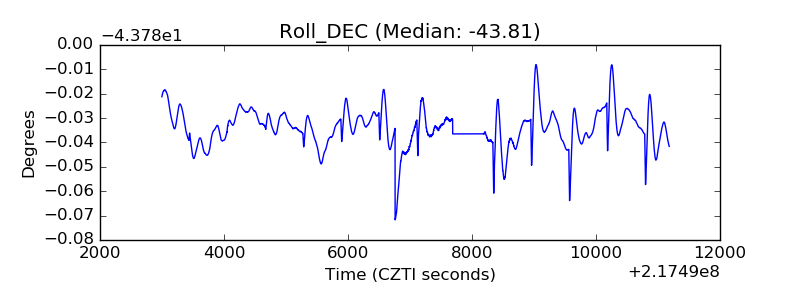 |
| _Roll_RA | 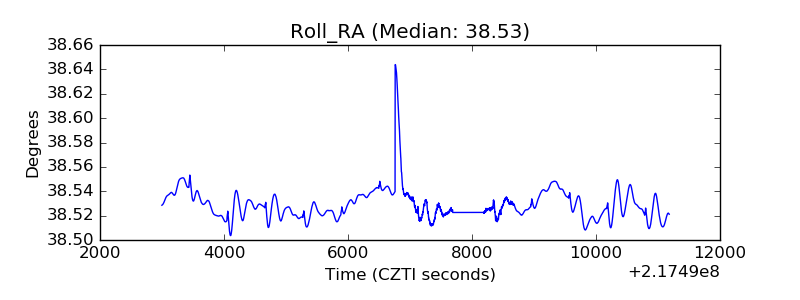 |
| Veto Counter | 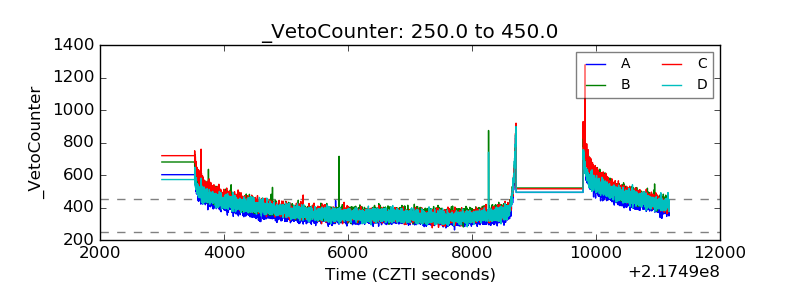 |