| Param | Original file | Final file |
|---|---|---|
| Filename | modeM0/AS1A02_151T01_9000000818_06236cztM0_level2.evt | modeM0/AS1A02_151T01_9000000818_06236cztM0_level2_quad_clean.evt |
| Size (bytes) | 507,291,840 | 80,009,280 |
| Size | 483.8 MB | 76.3 MB |
| Events in quadrant A | 3,496,581 | 487,391 |
| Events in quadrant B | 4,229,120 | 483,899 |
| Events in quadrant C | 3,313,368 | 489,753 |
| Events in quadrant D | 3,848,411 | 473,508 |
| Mode SS | |||
|---|---|---|---|
| Quadrant | BADHDUFLAG | Total packets | Discarded packets |
| A | 0 | 146 | 0 |
| B | 0 | 146 | 0 |
| C | 0 | 146 | 0 |
| D | 0 | 146 | 0 |
| Mode M9 | |||
|---|---|---|---|
| Quadrant | BADHDUFLAG | Total packets | Discarded packets |
| A | 0 | 22 | 0 |
| B | 0 | 22 | 0 |
| C | 0 | 22 | 0 |
| D | 0 | 22 | 0 |
| Mode M0 | |||
|---|---|---|---|
| Quadrant | BADHDUFLAG | Total packets | Discarded packets |
| A | 0 | 14923 | 3 |
| B | 0 | 17212 | 2 |
| C | 0 | 14641 | 2 |
| D | 0 | 16345 | 2 |
| Quadrant | Total seconds | Saturated seconds | Saturation percentage |
|---|---|---|---|
| A | 7002 | 147 | 2.099400% |
| B | 7002 | 288 | 4.113111% |
| C | 7002 | 112 | 1.599543% |
| D | 7002 | 135 | 1.928021% |
Noise dominated data is calculated using 1-second bins in cleaned event files. If a bin has >2000 counts, and if more than 50% of those come from <1% of pixels, then it is considered to be noise-dominated and hence unusable.
| Quadrant | # 1 sec bins | Bins with >0 counts | Bins with >2000 counts | High rate bins dominated by noise | Noise dominated (total time) | Noise dominated (detector-on time) | Marked lightcurve |
|---|---|---|---|---|---|---|---|
| A | 9242 | 7002 | 4 | 4 | 0.04% | 0.06% | 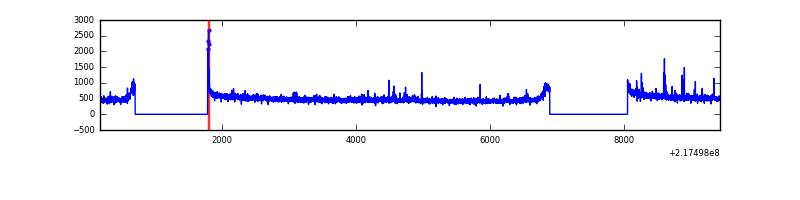 |
| B | 9242 | 7002 | 121 | 121 | 1.31% | 1.73% | 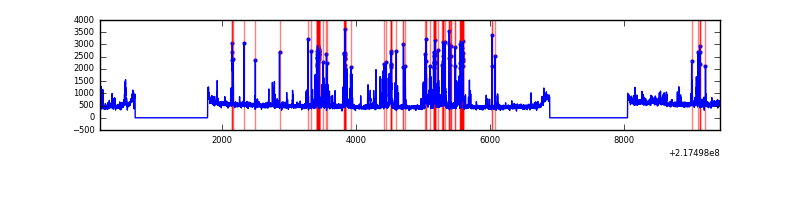 |
| C | 9242 | 7002 | 0 | 0 | 0.00% | 0.00% | 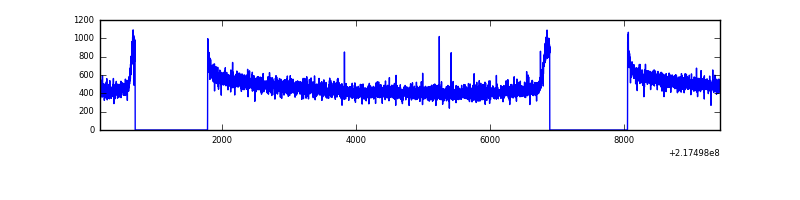 |
| D | 9242 | 7002 | 3 | 3 | 0.03% | 0.04% |  |
Top three noisy pixels from each quadrant. If the there are fewer than three noisy pixels in the level2.evt file, extra rows are filled as -1
| Pixel properties | Quadrant properties | ||||||
|---|---|---|---|---|---|---|---|
| Quadrant | DetID | PixID | Counts | Sigma | Mean | Median | Sigma |
| A | 8 | 15 | 82892 | 468.44 | 866 | 849 | 175.1 |
| A | 15 | 236 | 54968 | 309.01 | 866 | 849 | 175.1 |
| A | 10 | 253 | 16760 | 90.85 | 866 | 849 | 175.1 |
| B | 3 | 64 | 729251 | 4456.96 | 865 | 844 | 163.4 |
| B | 0 | 219 | 67208 | 406.07 | 865 | 844 | 163.4 |
| B | 15 | 204 | 32715 | 195.01 | 865 | 844 | 163.4 |
| C | 13 | 61 | 6690 | 29.98 | 847 | 851 | 194.8 |
| C | 1 | 16 | 3805 | 15.17 | 847 | 851 | 194.8 |
| C | 8 | 222 | 3454 | 13.36 | 847 | 851 | 194.8 |
| D | 2 | 63 | 439233 | 2139.76 | 847 | 821 | 204.9 |
| D | 11 | 241 | 82228 | 397.32 | 847 | 821 | 204.9 |
| D | 14 | 173 | 41491 | 198.5 | 847 | 821 | 204.9 |
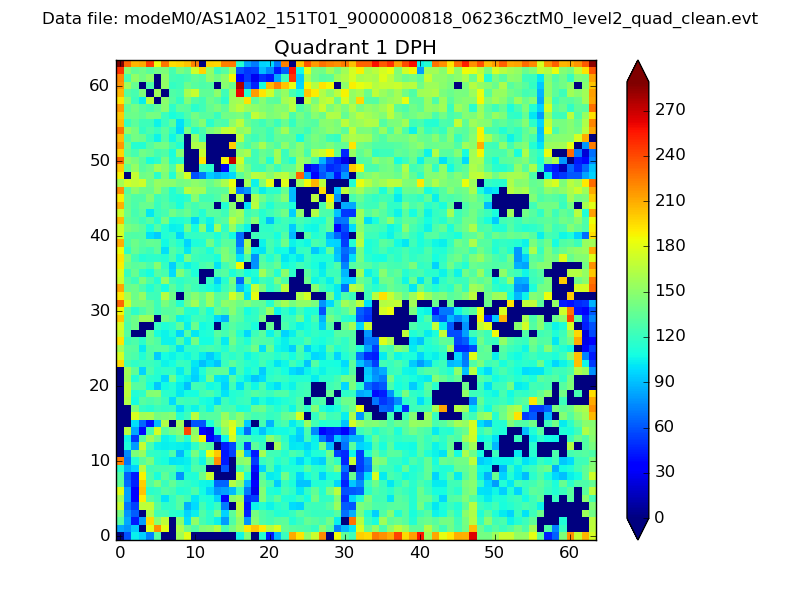
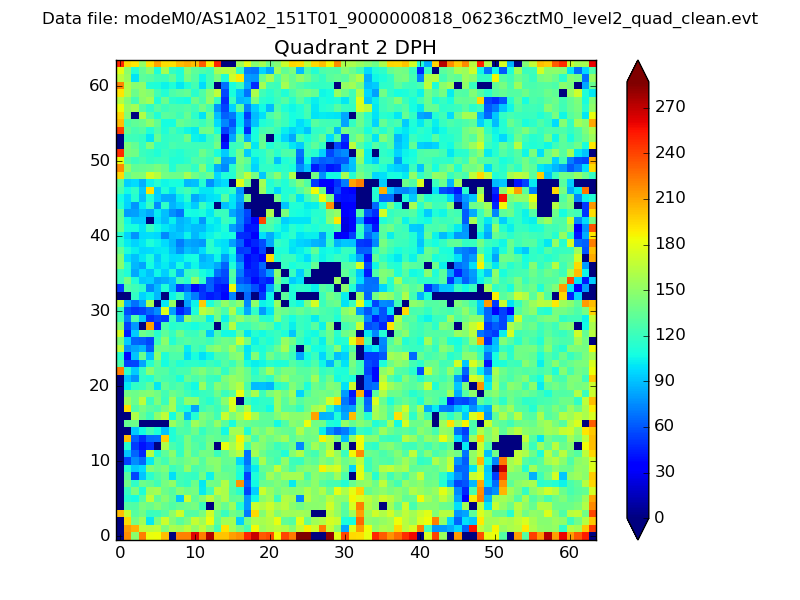
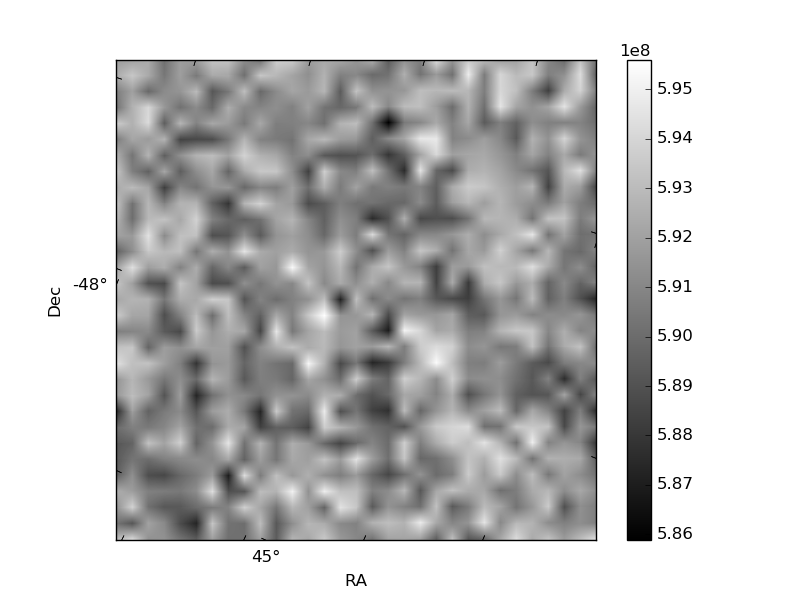
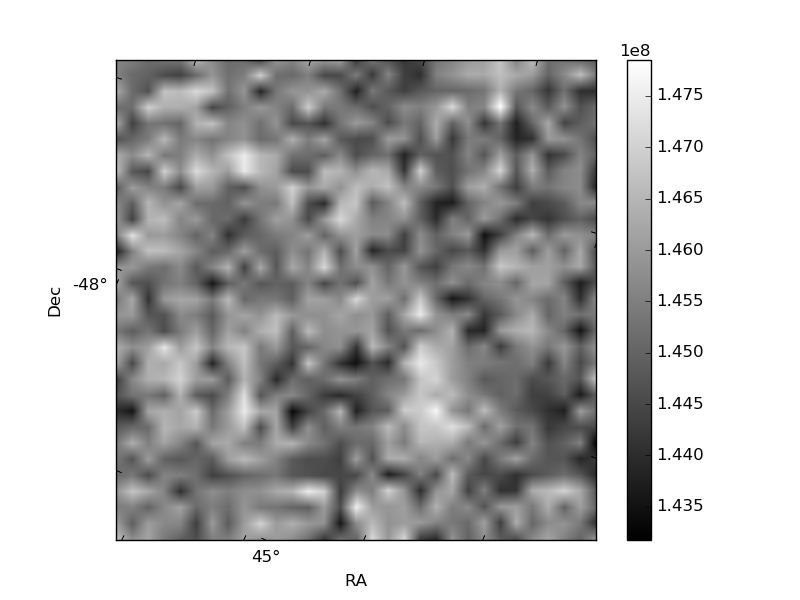
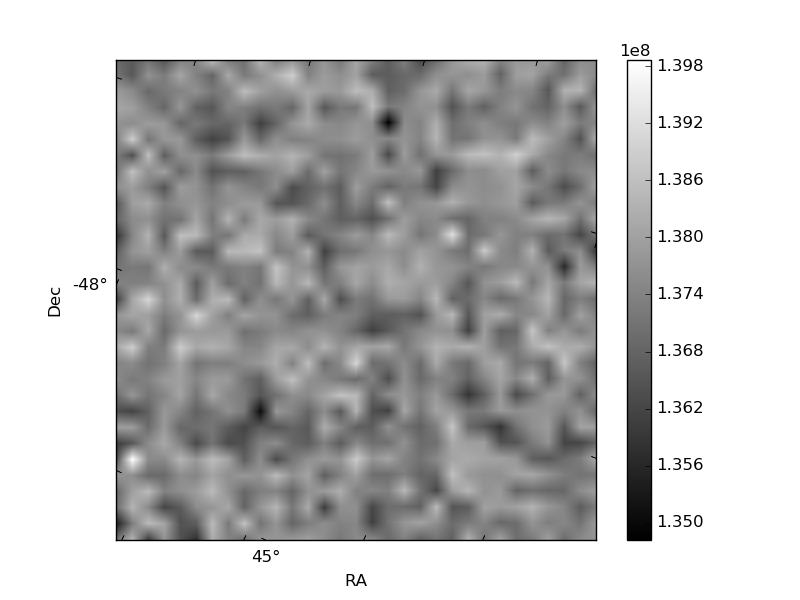
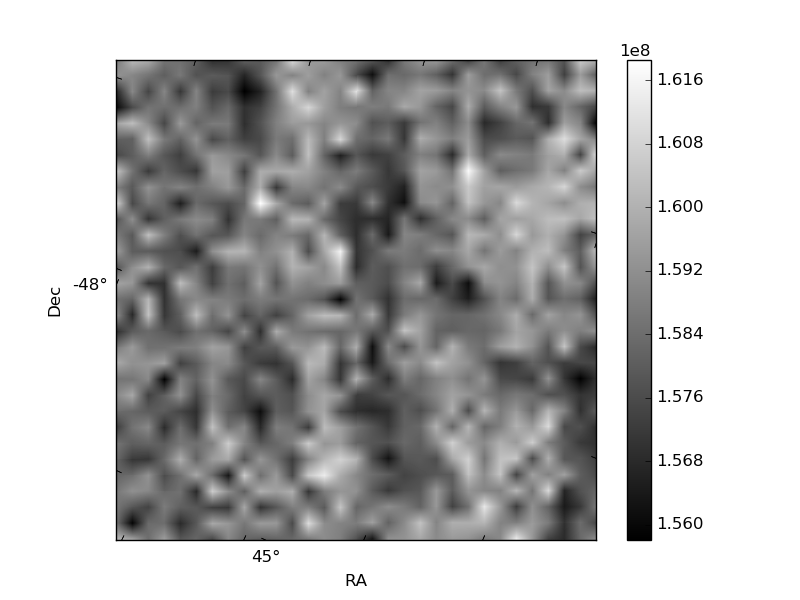
Histogram calculated using DETX and DETY for each event in the final _common_clean file
| Quadrant A | 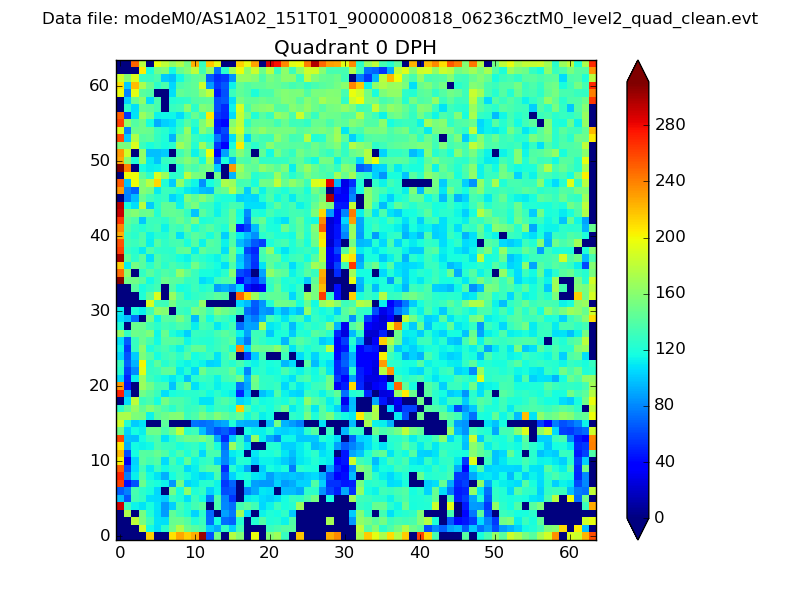 |
 |
Quadrant B |
|---|---|---|---|
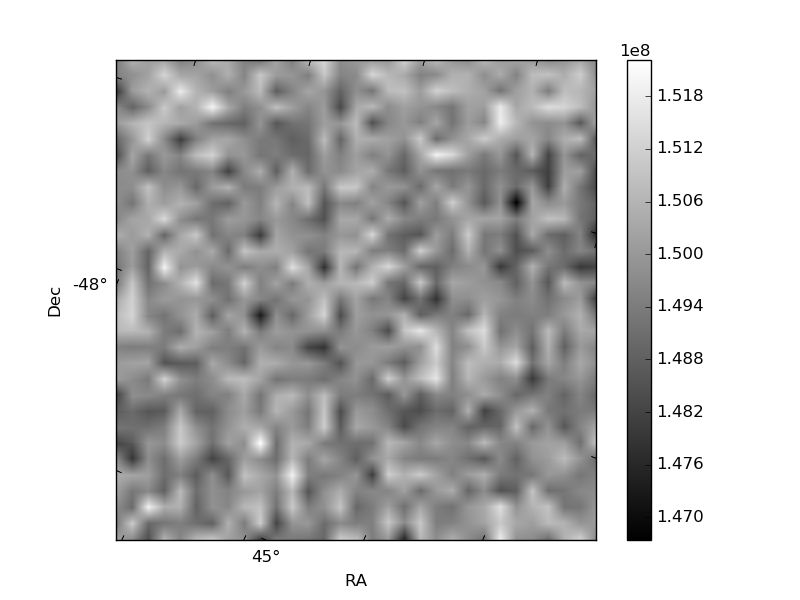
| Quadrant D | 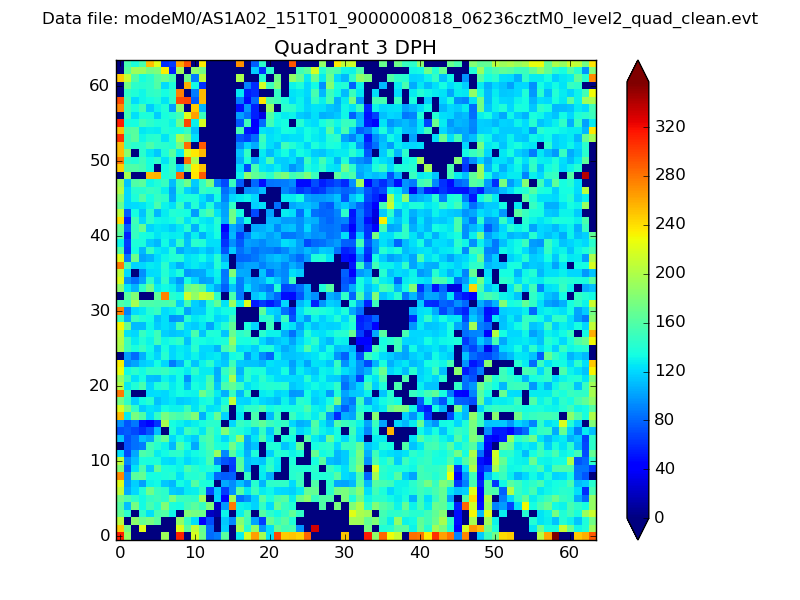 |
 |
Quadrant C |
| Plot type | Count rate plots | Images |
|---|---|---|
| Comparison with Poisson distribution Blue bars denote a histogram of data divided into 1 sec bins. Red curve is a Poisson curve with rate = median count rate of data. |
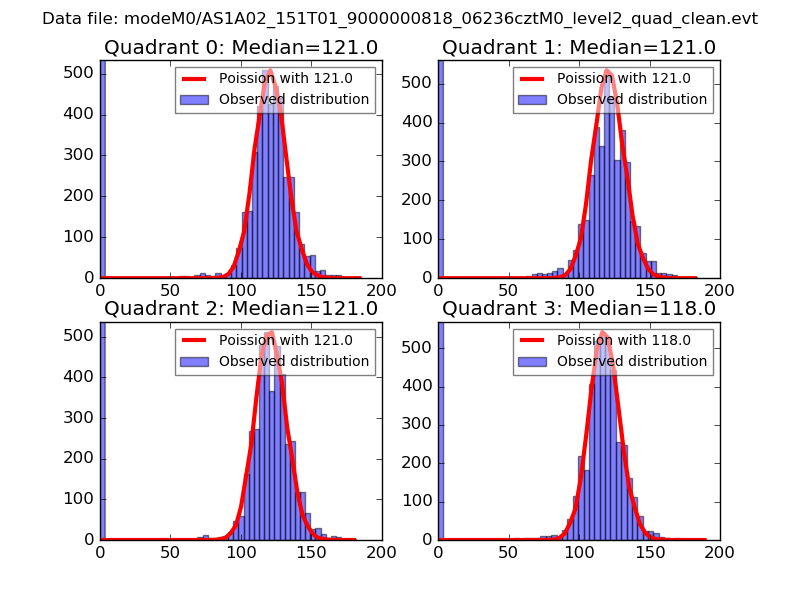 |
 |
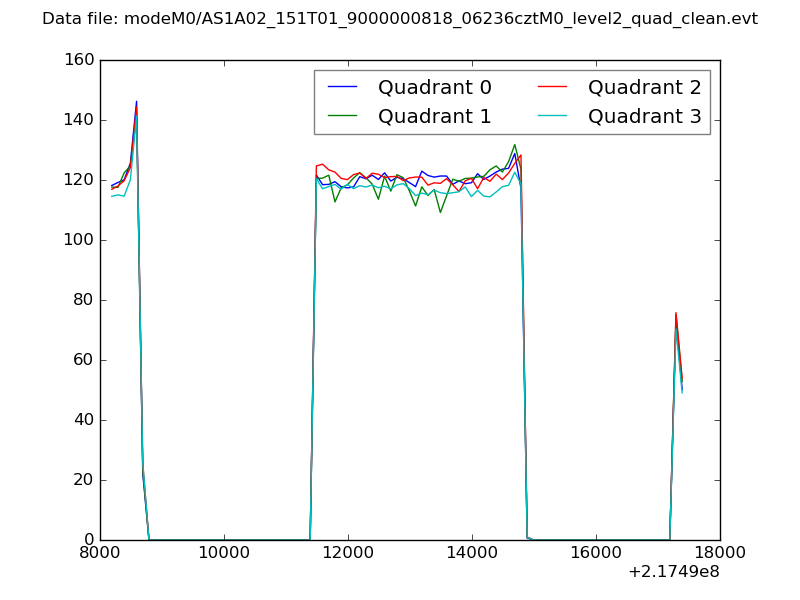
| Quadrant-wise count rates Data is divided into 100 sec bins |
 |
|
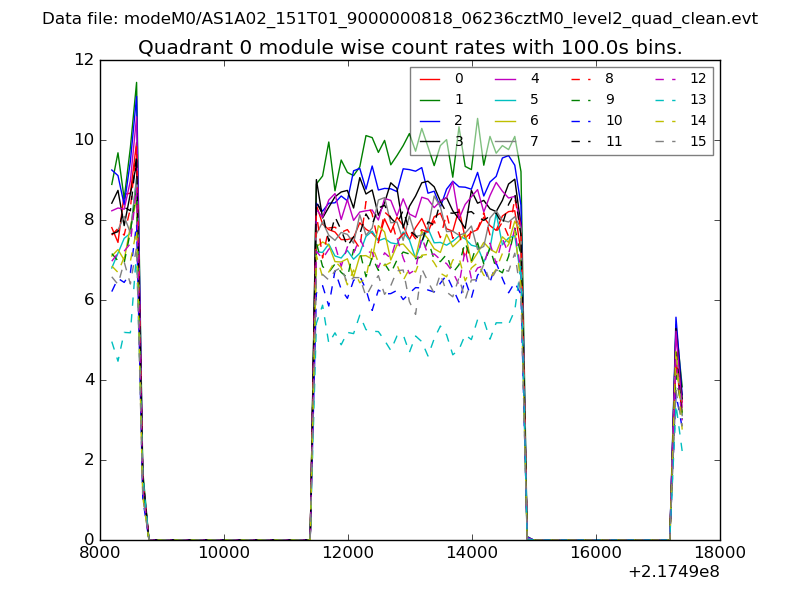
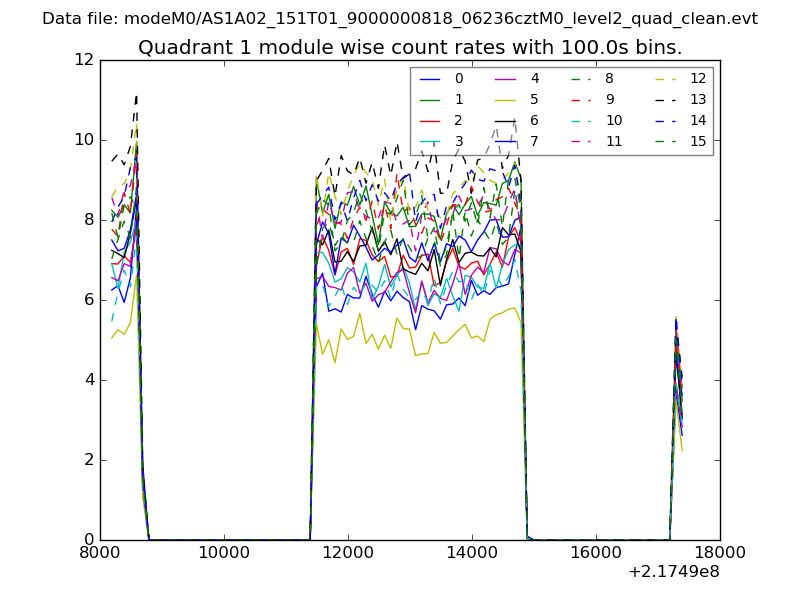
| Module-wise count rates for Quadrant A Data is divided into 100 sec bins |
 |
 |
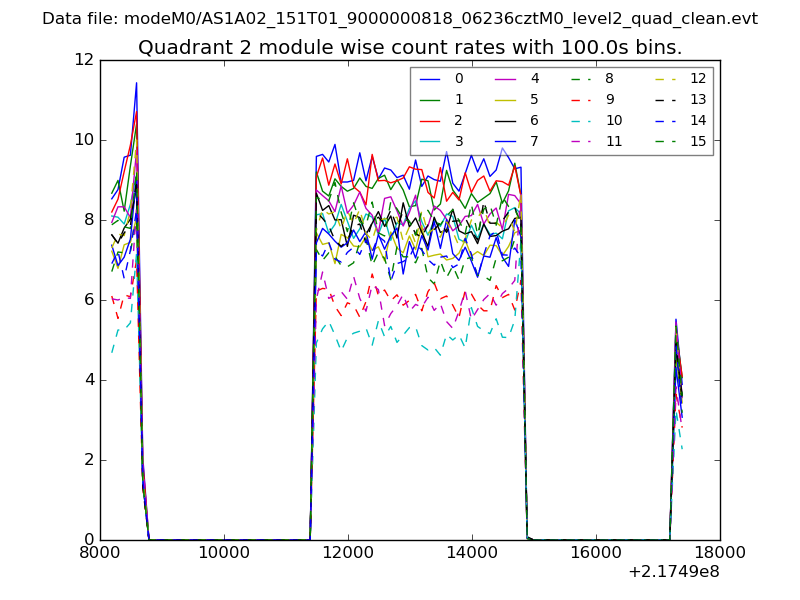
| Module-wise count rates for Quadrant B Data is divided into 100 sec bins |
 |
 |
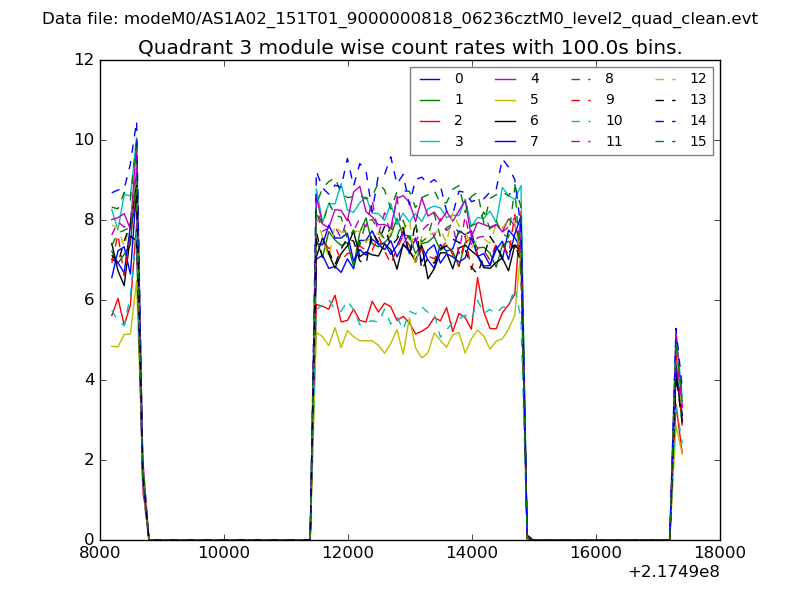
| Module-wise count rates for Quadrant C Data is divided into 100 sec bins |
 |
 |
| Module-wise count rates for Quadrant D Data is divided into 100 sec bins |
 |
 |
| Parameter | Plot |
|---|---|
| CZT HV Monitor | 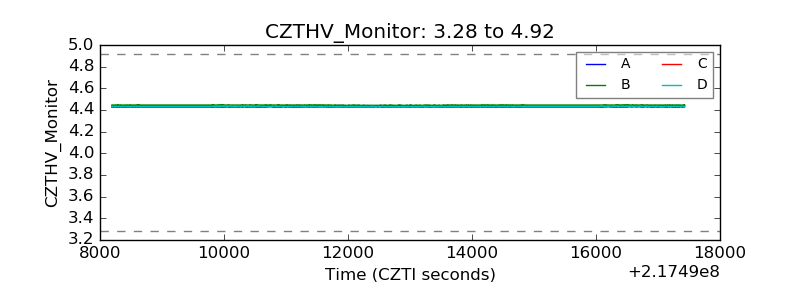 |
| D_VDD | 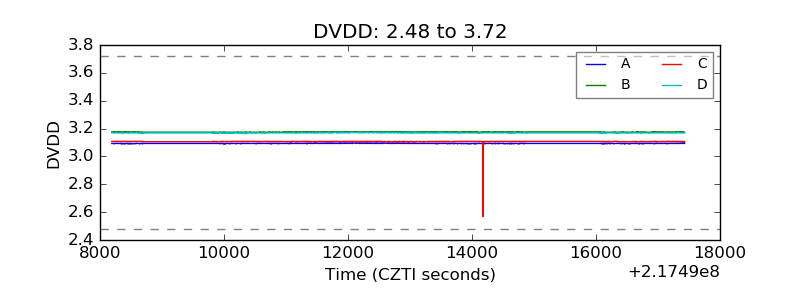 |
| Temperature 1 | 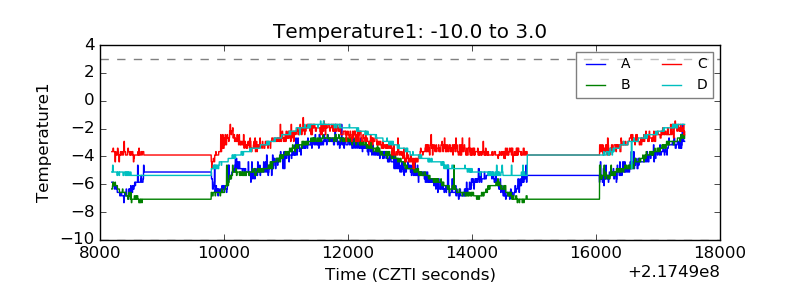 |
| Veto HV Monitor | 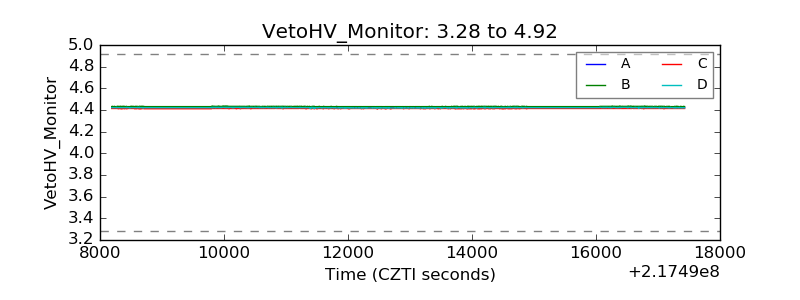 |
| Veto LLD | 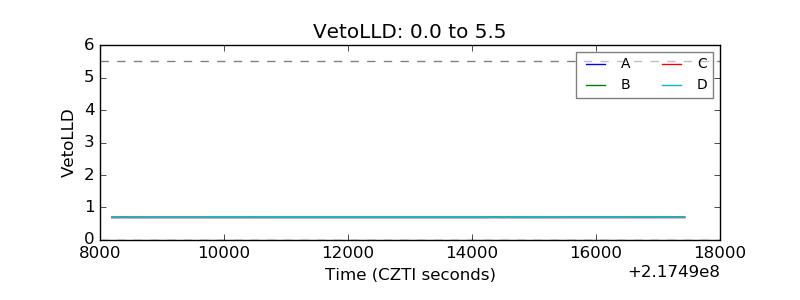 |
| Alpha Counter | 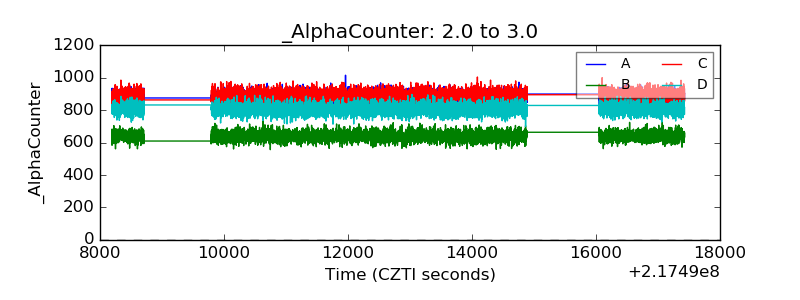 |
| _CPM_Rate | 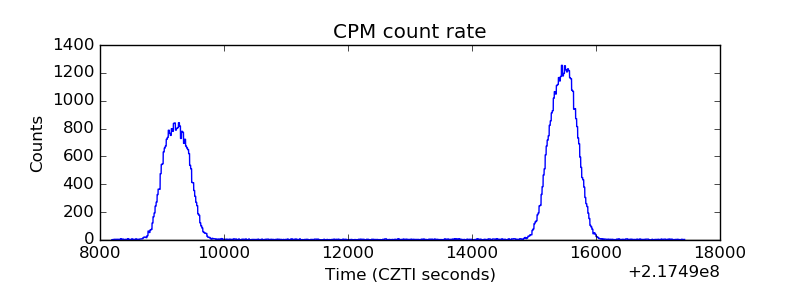 |
| CZT Counter | 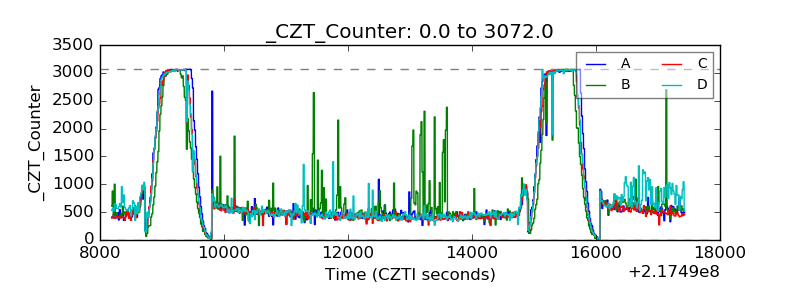 |
| +2.5 Volts monitor |  |
| +5 Volts monitor |  |
| _ROLL_ROT | 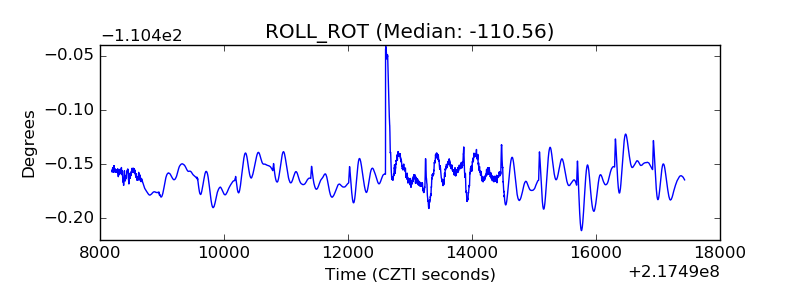 |
| _Roll_DEC | 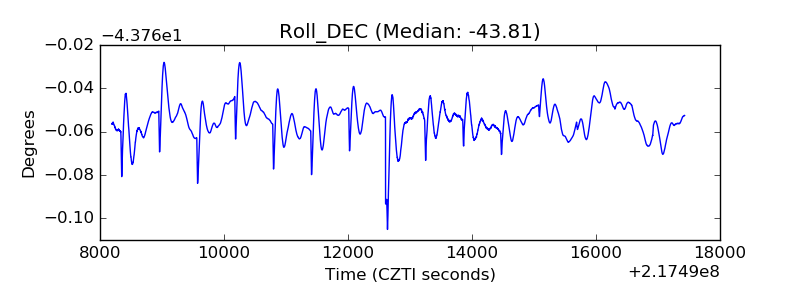 |
| _Roll_RA | 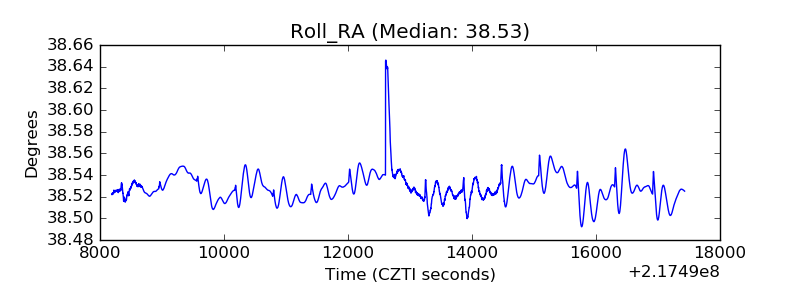 |
| Veto Counter | 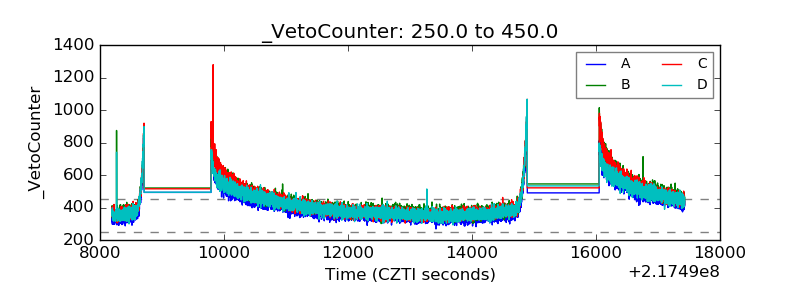 |