| Param | Original file | Final file |
|---|---|---|
| Filename | modeM0/AS1A02_151T01_9000000818_06237cztM0_level2.evt | modeM0/AS1A02_151T01_9000000818_06237cztM0_level2_quad_clean.evt |
| Size (bytes) | 485,038,080 | 84,625,920 |
| Size | 462.6 MB | 80.7 MB |
| Events in quadrant A | 3,327,957 | 535,556 |
| Events in quadrant B | 4,005,242 | 534,395 |
| Events in quadrant C | 3,053,845 | 535,782 |
| Events in quadrant D | 3,870,535 | 512,953 |
| Mode SS | |||
|---|---|---|---|
| Quadrant | BADHDUFLAG | Total packets | Discarded packets |
| A | 0 | 128 | 0 |
| B | 0 | 128 | 0 |
| C | 0 | 128 | 0 |
| D | 0 | 128 | 0 |
| Mode M9 | |||
|---|---|---|---|
| Quadrant | BADHDUFLAG | Total packets | Discarded packets |
| A | 0 | 20 | 0 |
| B | 0 | 20 | 0 |
| C | 0 | 20 | 0 |
| D | 0 | 21 | 0 |
| Mode M0 | |||
|---|---|---|---|
| Quadrant | BADHDUFLAG | Total packets | Discarded packets |
| A | 0 | 13938 | 3 |
| B | 0 | 16040 | 2 |
| C | 0 | 13387 | 2 |
| D | 0 | 15966 | 2 |
| Quadrant | Total seconds | Saturated seconds | Saturation percentage |
|---|---|---|---|
| A | 6365 | 125 | 1.963865% |
| B | 6365 | 283 | 4.446190% |
| C | 6365 | 98 | 1.539670% |
| D | 6365 | 122 | 1.916732% |
Noise dominated data is calculated using 1-second bins in cleaned event files. If a bin has >2000 counts, and if more than 50% of those come from <1% of pixels, then it is considered to be noise-dominated and hence unusable.
| Quadrant | # 1 sec bins | Bins with >0 counts | Bins with >2000 counts | High rate bins dominated by noise | Noise dominated (total time) | Noise dominated (detector-on time) | Marked lightcurve |
|---|---|---|---|---|---|---|---|
| A | 7590 | 6365 | 0 | 0 | 0.00% | 0.00% | 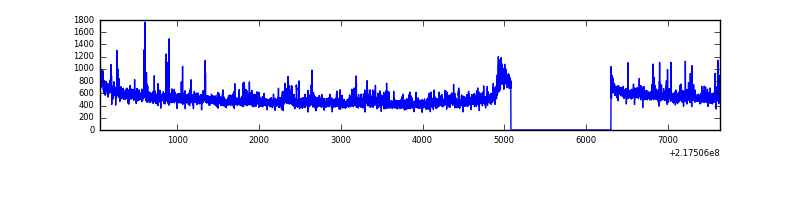 |
| B | 7590 | 6365 | 130 | 130 | 1.71% | 2.04% | 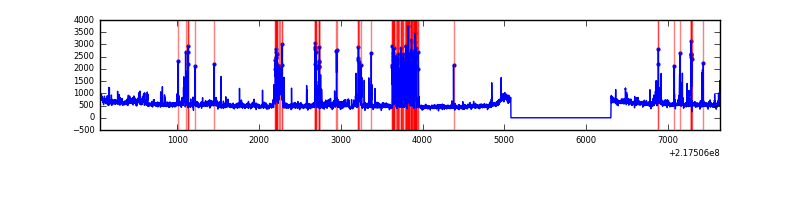 |
| C | 7590 | 6365 | 0 | 0 | 0.00% | 0.00% | 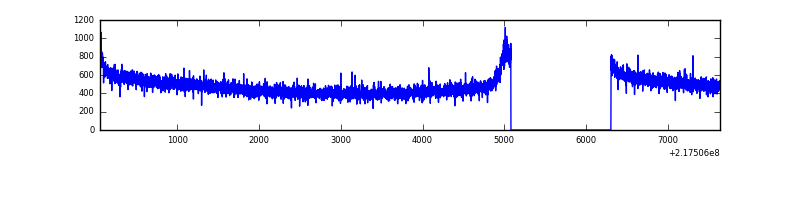 |
| D | 7590 | 6365 | 3 | 3 | 0.04% | 0.05% | 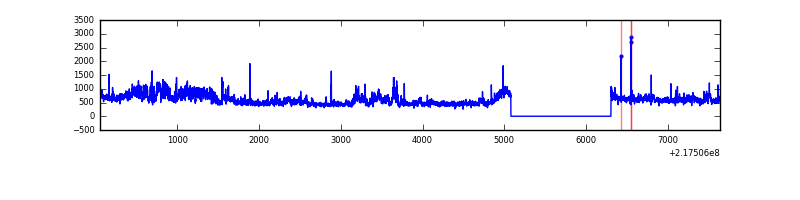 |
Top three noisy pixels from each quadrant. If the there are fewer than three noisy pixels in the level2.evt file, extra rows are filled as -1
| Pixel properties | Quadrant properties | ||||||
|---|---|---|---|---|---|---|---|
| Quadrant | DetID | PixID | Counts | Sigma | Mean | Median | Sigma |
| A | 15 | 236 | 149858 | 923.57 | 808 | 791 | 161.4 |
| A | 8 | 15 | 54766 | 334.41 | 808 | 791 | 161.4 |
| A | 0 | 226 | 7832 | 43.62 | 808 | 791 | 161.4 |
| B | 3 | 64 | 644052 | 4247.08 | 805 | 786 | 151.5 |
| B | 15 | 204 | 145876 | 957.94 | 805 | 786 | 151.5 |
| B | 0 | 219 | 75423 | 492.78 | 805 | 786 | 151.5 |
| C | 13 | 61 | 6160 | 30.1 | 781 | 785 | 178.5 |
| C | 1 | 16 | 3519 | 15.31 | 781 | 785 | 178.5 |
| C | 3 | 202 | 2008 | 6.85 | 781 | 785 | 178.5 |
| D | 2 | 63 | 612178 | 3227.09 | 785 | 762 | 189.5 |
| D | 11 | 241 | 158125 | 830.57 | 785 | 762 | 189.5 |
| D | 5 | 97 | 49911 | 259.41 | 785 | 762 | 189.5 |
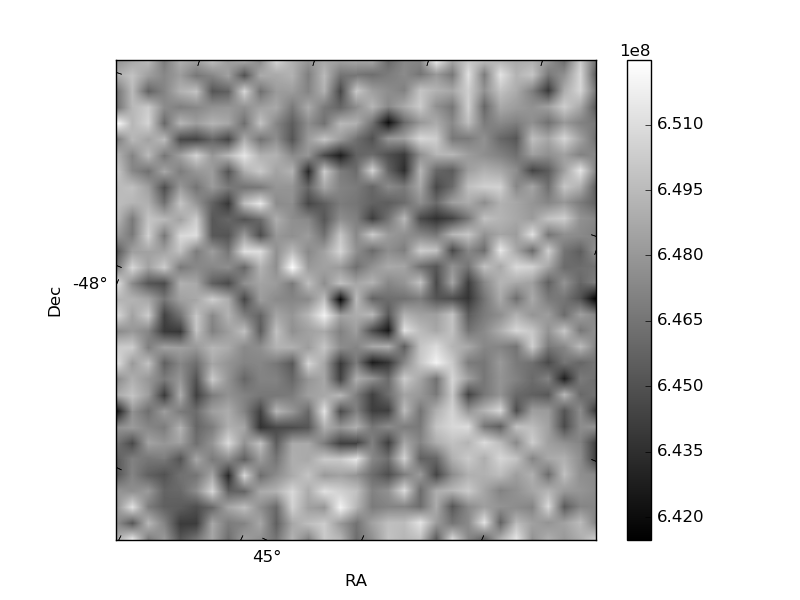
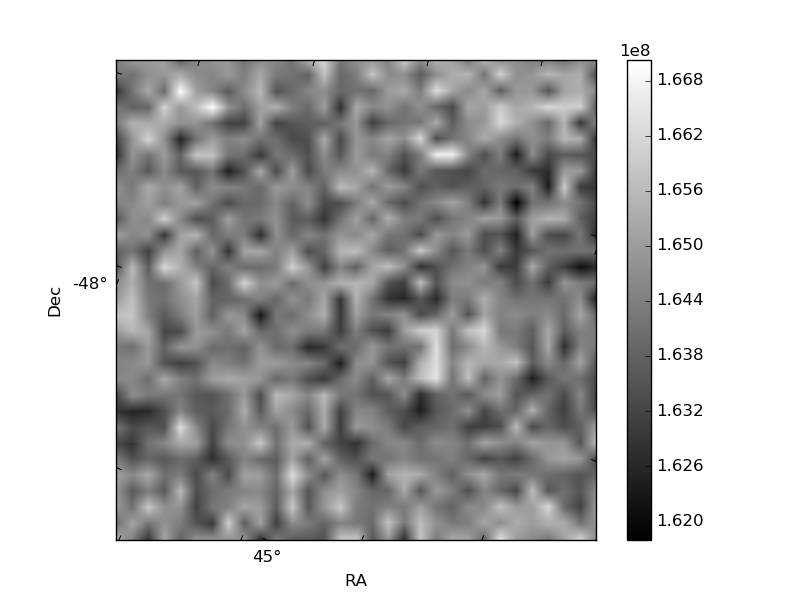
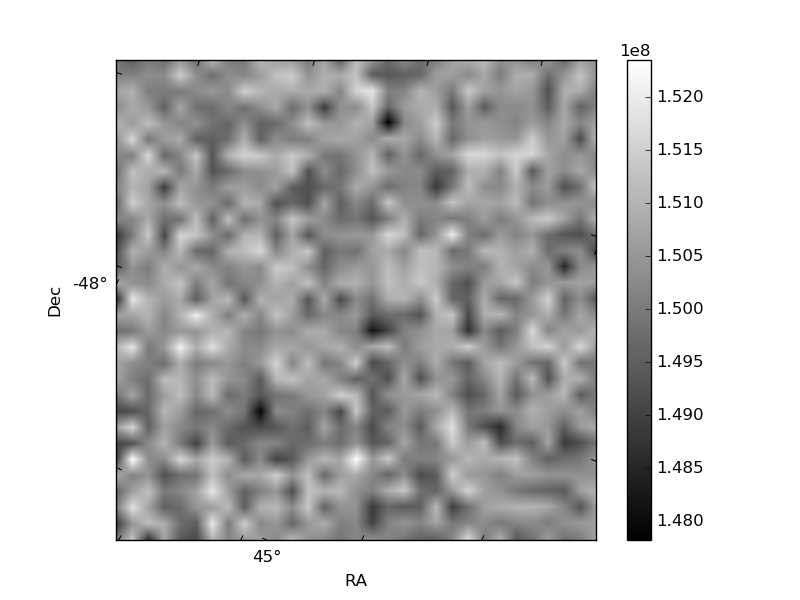
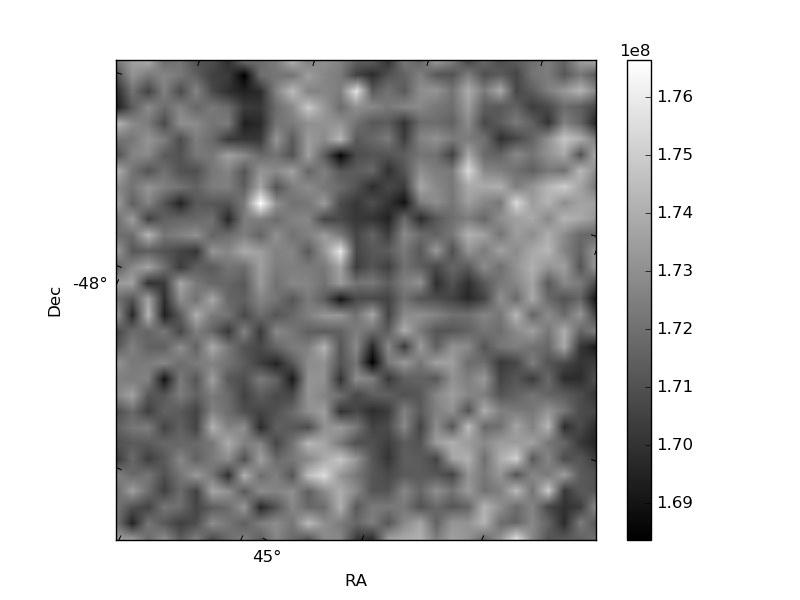
Histogram calculated using DETX and DETY for each event in the final _common_clean file
| Quadrant A | 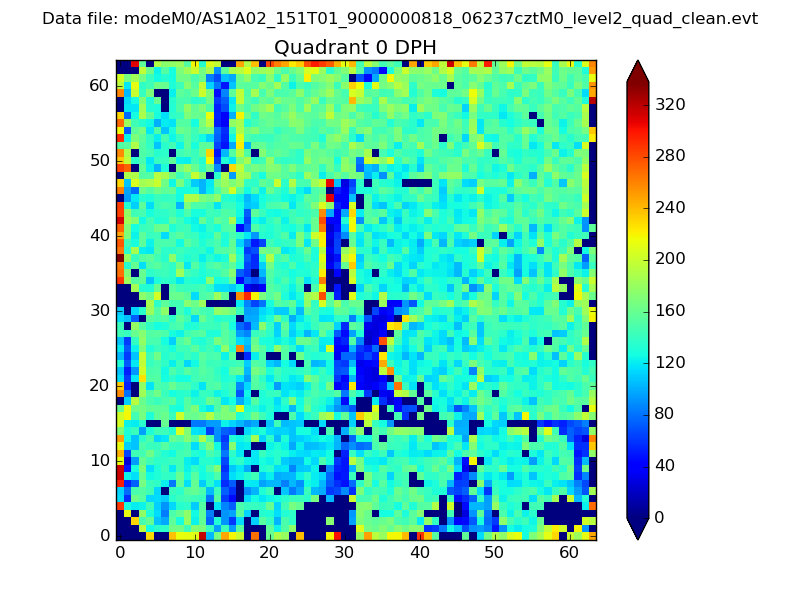 |
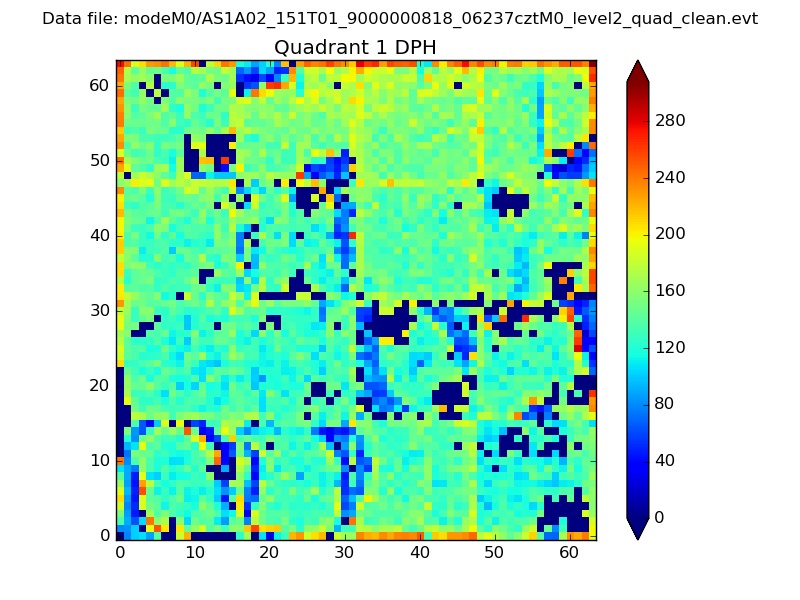 |
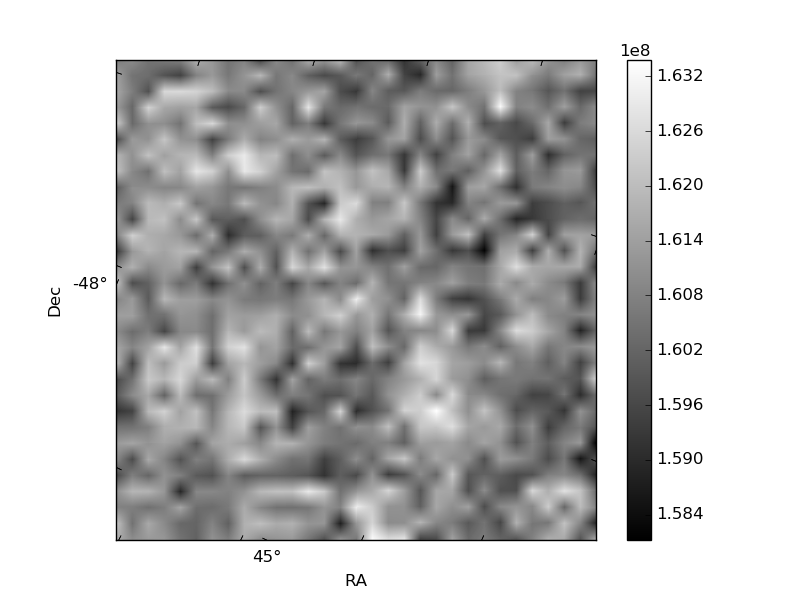
Quadrant B |
|---|---|---|---|
| Quadrant D | 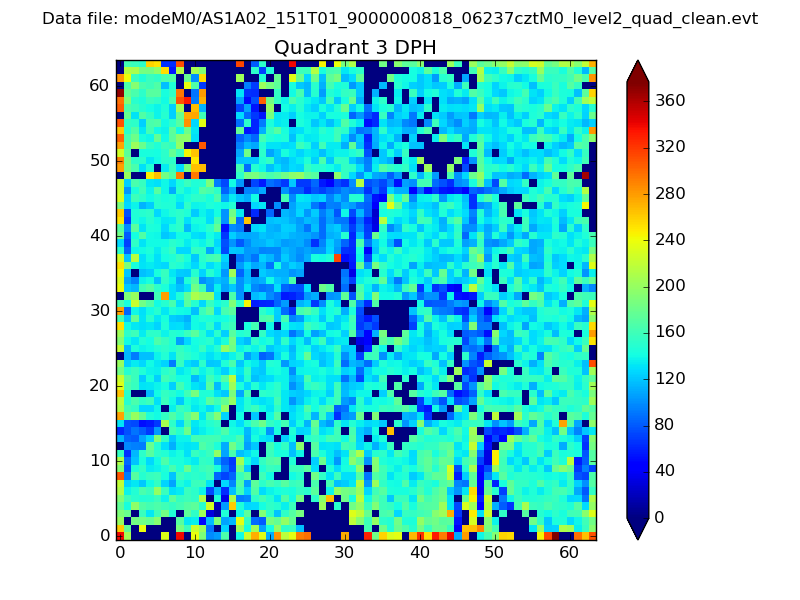 |
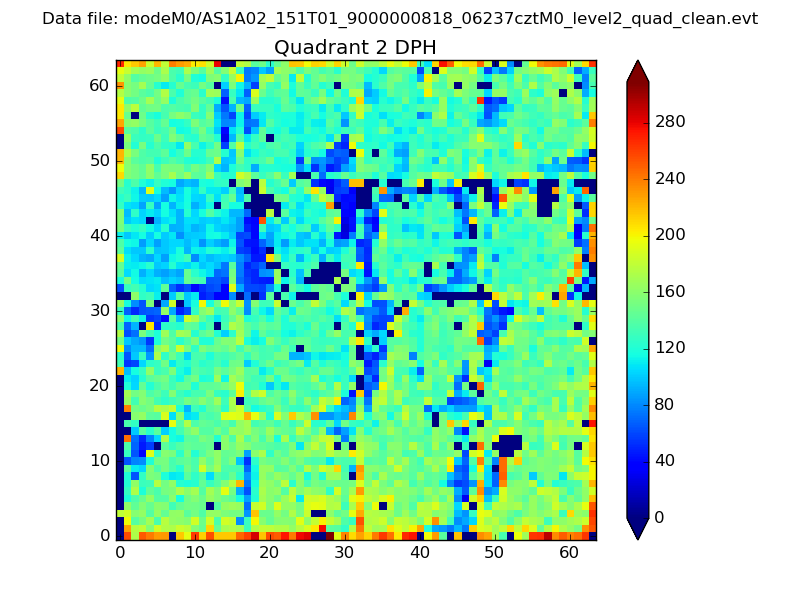 |
Quadrant C |
| Plot type | Count rate plots | Images |
|---|---|---|
| Comparison with Poisson distribution Blue bars denote a histogram of data divided into 1 sec bins. Red curve is a Poisson curve with rate = median count rate of data. |
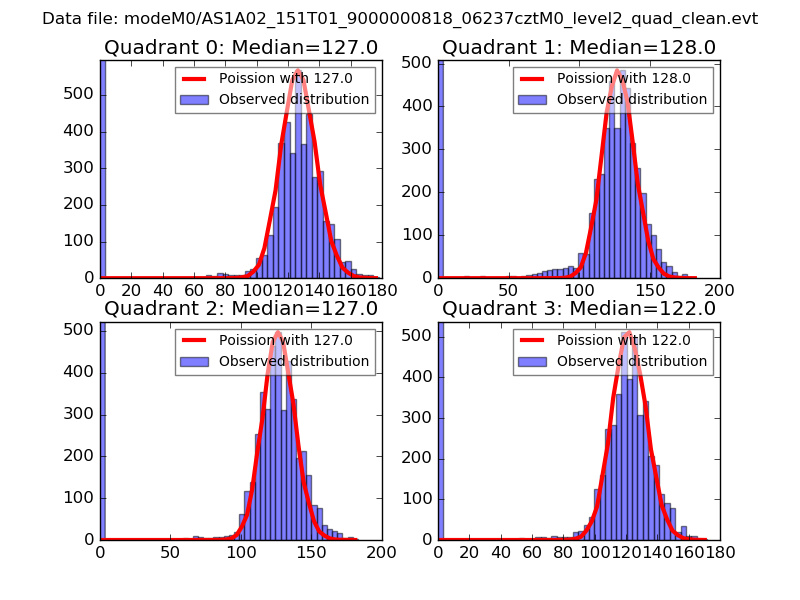 |
 |
| Quadrant-wise count rates Data is divided into 100 sec bins |
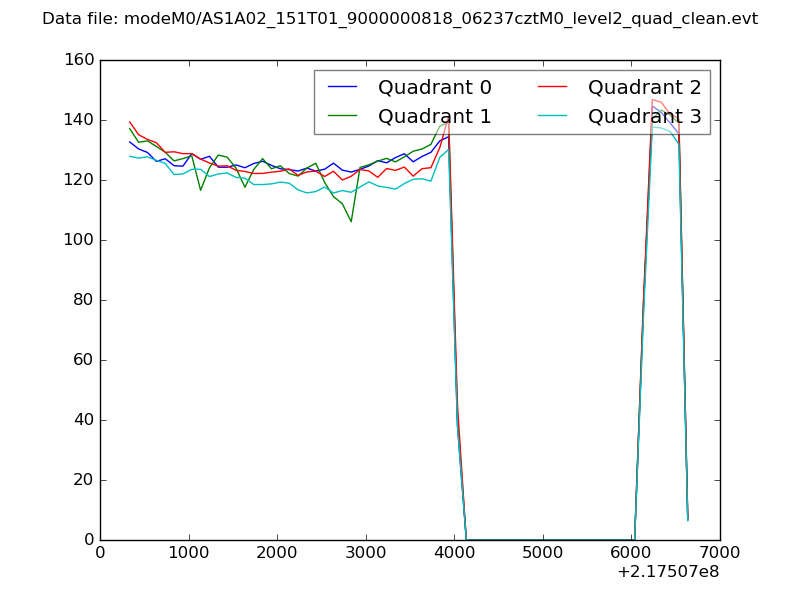 |
|
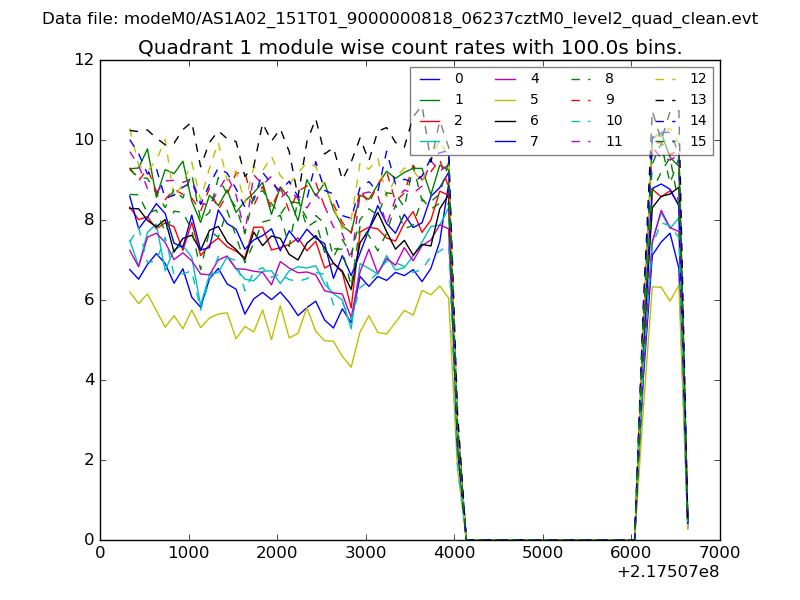
| Module-wise count rates for Quadrant A Data is divided into 100 sec bins |
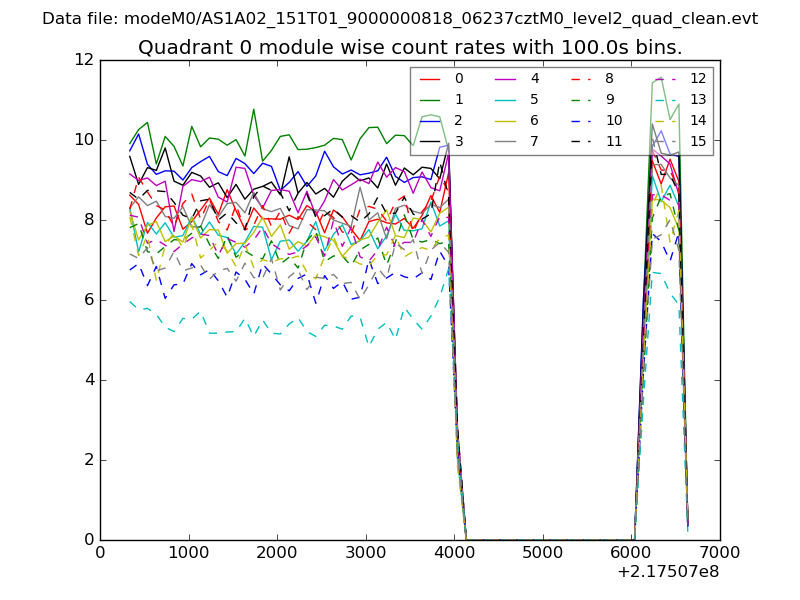 |
 |
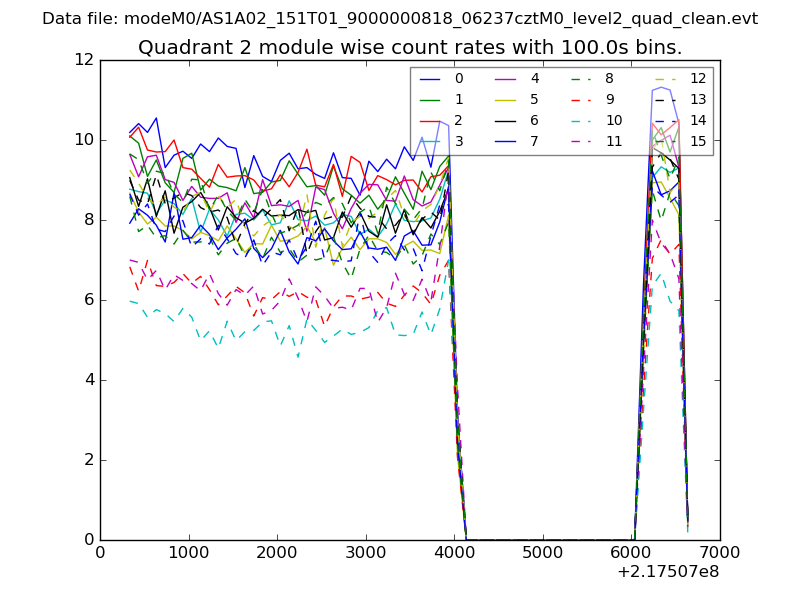
| Module-wise count rates for Quadrant B Data is divided into 100 sec bins |
 |
 |
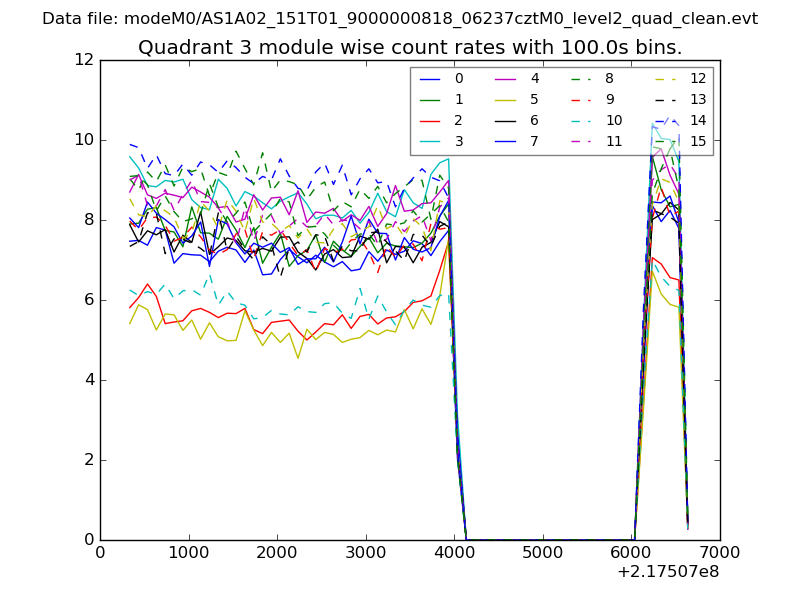
| Module-wise count rates for Quadrant C Data is divided into 100 sec bins |
 |
 |
| Module-wise count rates for Quadrant D Data is divided into 100 sec bins |
 |
 |
| Parameter | Plot |
|---|---|
| CZT HV Monitor | 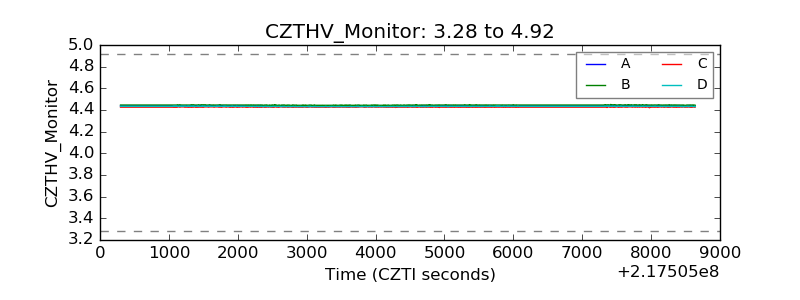 |
| D_VDD | 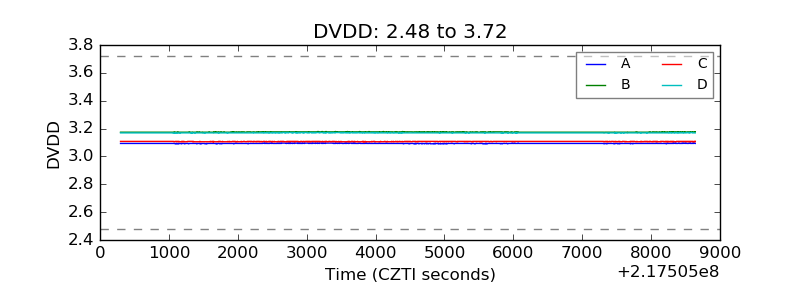 |
| Temperature 1 |  |
| Veto HV Monitor | 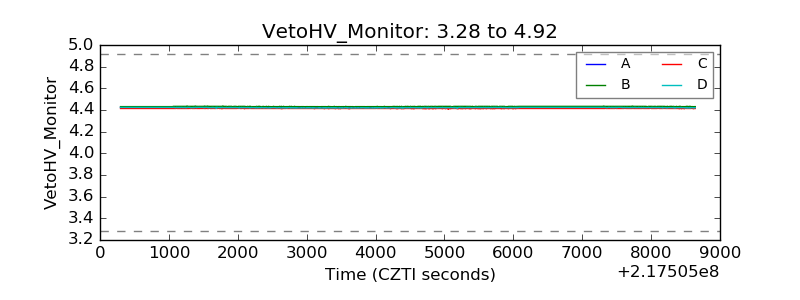 |
| Veto LLD | 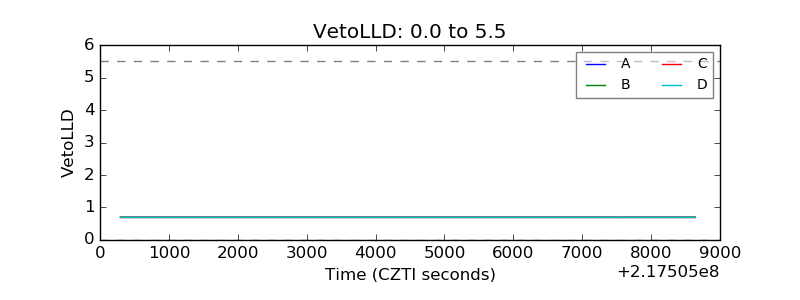 |
| Alpha Counter | 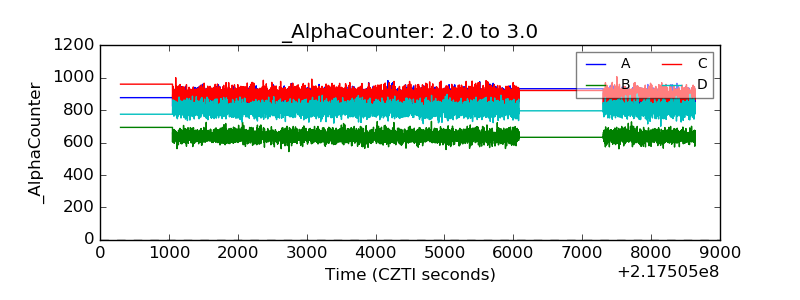 |
| _CPM_Rate | 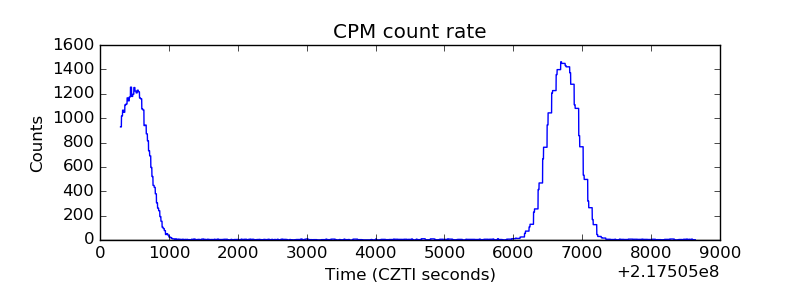 |
| CZT Counter | 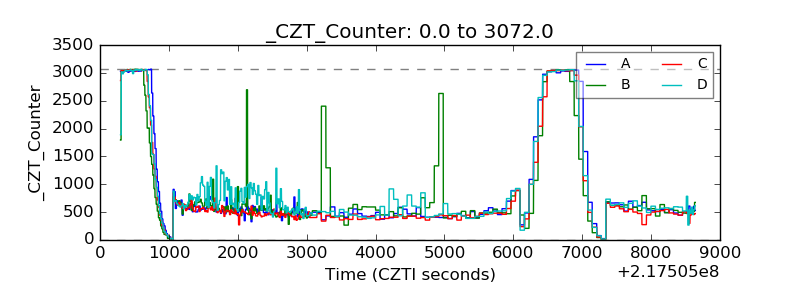 |
| +2.5 Volts monitor |  |
| +5 Volts monitor |  |
| _ROLL_ROT | 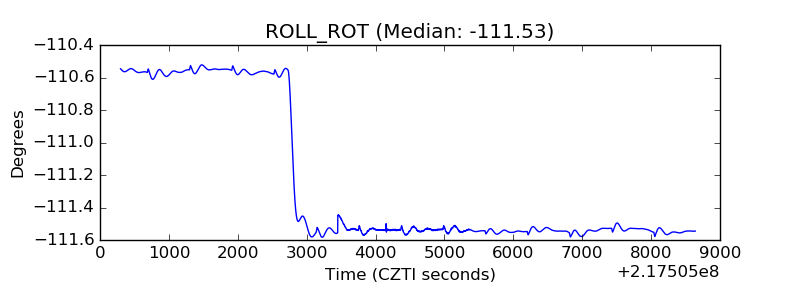 |
| _Roll_DEC | 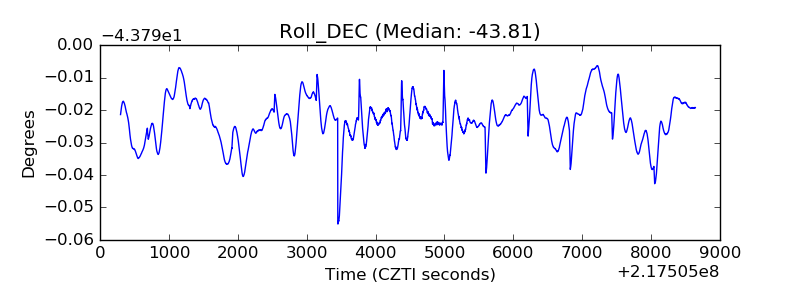 |
| _Roll_RA | 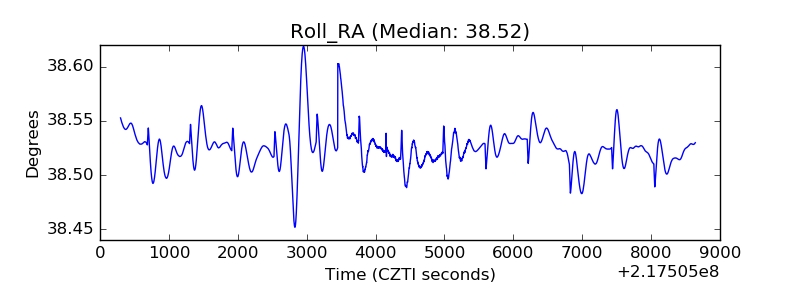 |
| Veto Counter | 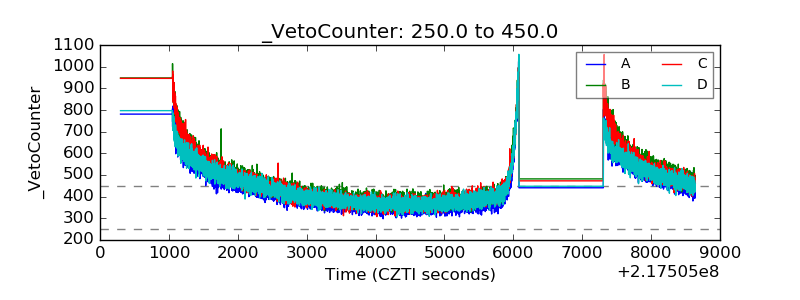 |