| Param | Original file | Final file |
|---|---|---|
| Filename | modeM0/AS1A02_151T01_9000000818_06239cztM0_level2.evt | modeM0/AS1A02_151T01_9000000818_06239cztM0_level2_quad_clean.evt |
| Size (bytes) | 475,974,720 | 105,088,320 |
| Size | 453.9 MB | 100.2 MB |
| Events in quadrant A | 3,284,260 | 691,707 |
| Events in quadrant B | 3,681,762 | 696,799 |
| Events in quadrant C | 2,981,738 | 683,813 |
| Events in quadrant D | 4,023,224 | 654,619 |
| Mode SS | |||
|---|---|---|---|
| Quadrant | BADHDUFLAG | Total packets | Discarded packets |
| A | 0 | 132 | 0 |
| B | 0 | 132 | 0 |
| C | 0 | 132 | 0 |
| D | 0 | 132 | 0 |
| Mode M9 | |||
|---|---|---|---|
| Quadrant | BADHDUFLAG | Total packets | Discarded packets |
| A | 0 | 19 | 0 |
| B | 0 | 19 | 0 |
| C | 0 | 19 | 0 |
| D | 0 | 20 | 0 |
| Mode M0 | |||
|---|---|---|---|
| Quadrant | BADHDUFLAG | Total packets | Discarded packets |
| A | 0 | 13992 | 3 |
| B | 0 | 15167 | 2 |
| C | 0 | 13461 | 2 |
| D | 0 | 16320 | 2 |
| Quadrant | Total seconds | Saturated seconds | Saturation percentage |
|---|---|---|---|
| A | 6538 | 104 | 1.590701% |
| B | 6538 | 233 | 3.563781% |
| C | 6538 | 59 | 0.902417% |
| D | 6538 | 143 | 2.187213% |
Noise dominated data is calculated using 1-second bins in cleaned event files. If a bin has >2000 counts, and if more than 50% of those come from <1% of pixels, then it is considered to be noise-dominated and hence unusable.
| Quadrant | # 1 sec bins | Bins with >0 counts | Bins with >2000 counts | High rate bins dominated by noise | Noise dominated (total time) | Noise dominated (detector-on time) | Marked lightcurve |
|---|---|---|---|---|---|---|---|
| A | 7773 | 6538 | 7 | 7 | 0.09% | 0.11% | 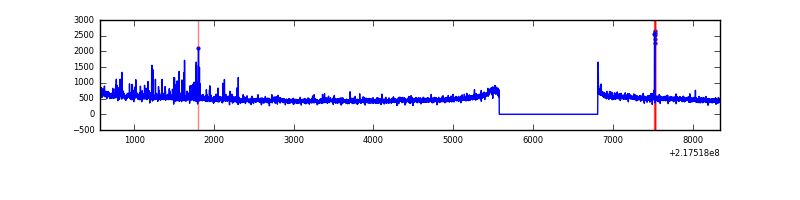 |
| B | 7773 | 6538 | 95 | 95 | 1.22% | 1.45% | 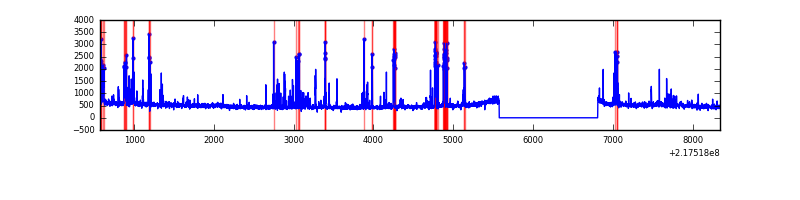 |
| C | 7773 | 6539 | 0 | 0 | 0.00% | 0.00% |  |
| D | 7773 | 6539 | 50 | 50 | 0.64% | 0.76% | 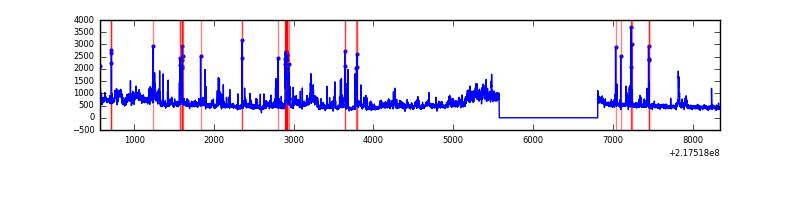 |
Top three noisy pixels from each quadrant. If the there are fewer than three noisy pixels in the level2.evt file, extra rows are filled as -1
| Pixel properties | Quadrant properties | ||||||
|---|---|---|---|---|---|---|---|
| Quadrant | DetID | PixID | Counts | Sigma | Mean | Median | Sigma |
| A | 8 | 15 | 93912 | 577.52 | 798 | 779 | 161.3 |
| A | 15 | 236 | 66463 | 407.31 | 798 | 779 | 161.3 |
| A | 14 | 111 | 46269 | 282.08 | 798 | 779 | 161.3 |
| B | 3 | 64 | 311600 | 2068.44 | 797 | 778 | 150.3 |
| B | 0 | 219 | 216463 | 1435.33 | 797 | 778 | 150.3 |
| B | 0 | 199 | 20508 | 131.3 | 797 | 778 | 150.3 |
| C | 13 | 61 | 6032 | 30.16 | 763 | 767 | 174.6 |
| C | 3 | 202 | 2061 | 7.41 | 763 | 767 | 174.6 |
| C | 8 | 222 | 2030 | 7.24 | 763 | 767 | 174.6 |
| D | 2 | 63 | 529847 | 2819.05 | 763 | 739 | 187.7 |
| D | 13 | 169 | 309627 | 1645.73 | 763 | 739 | 187.7 |
| D | 11 | 241 | 107884 | 570.86 | 763 | 739 | 187.7 |
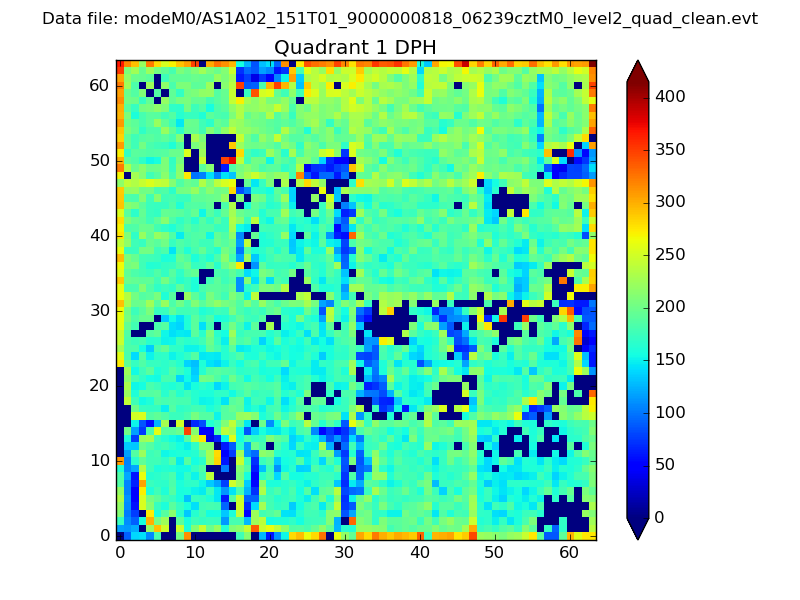
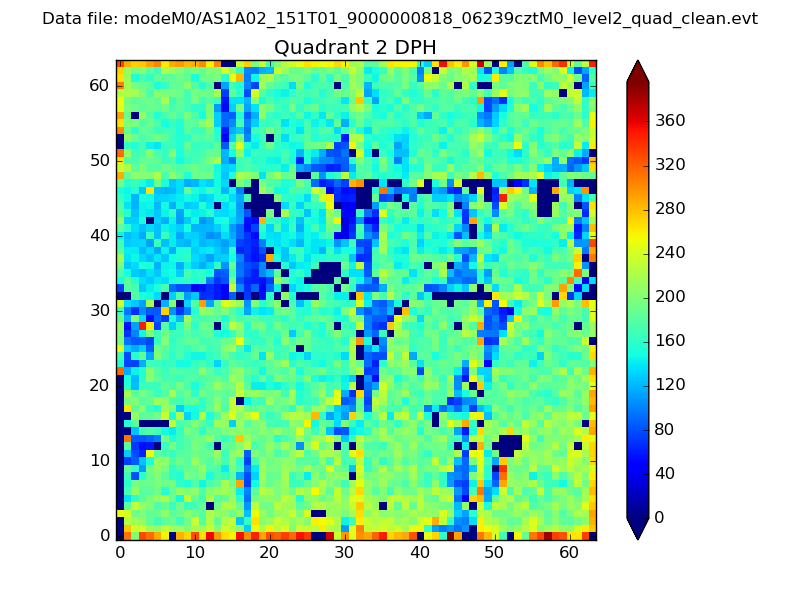
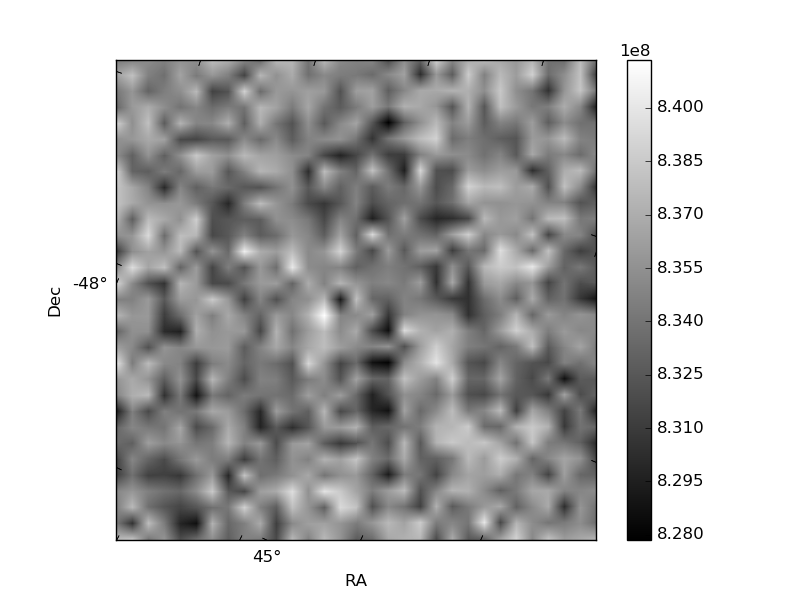
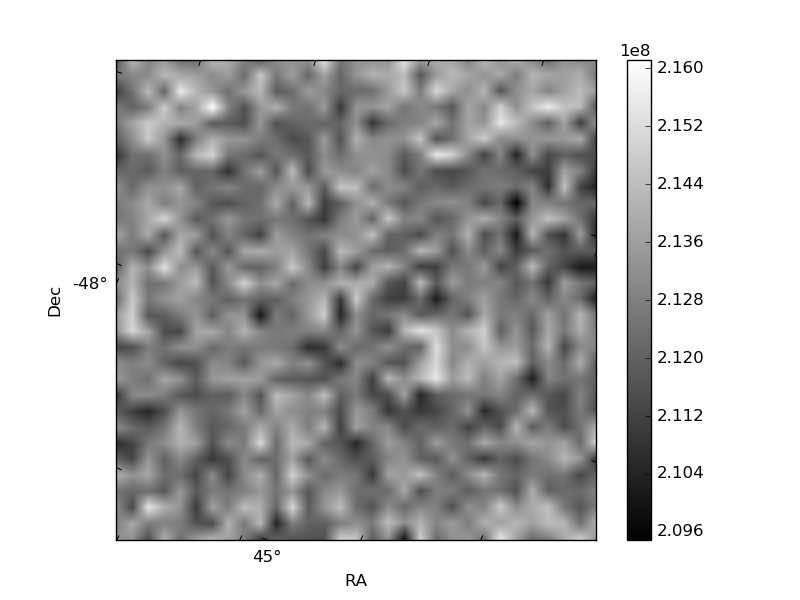
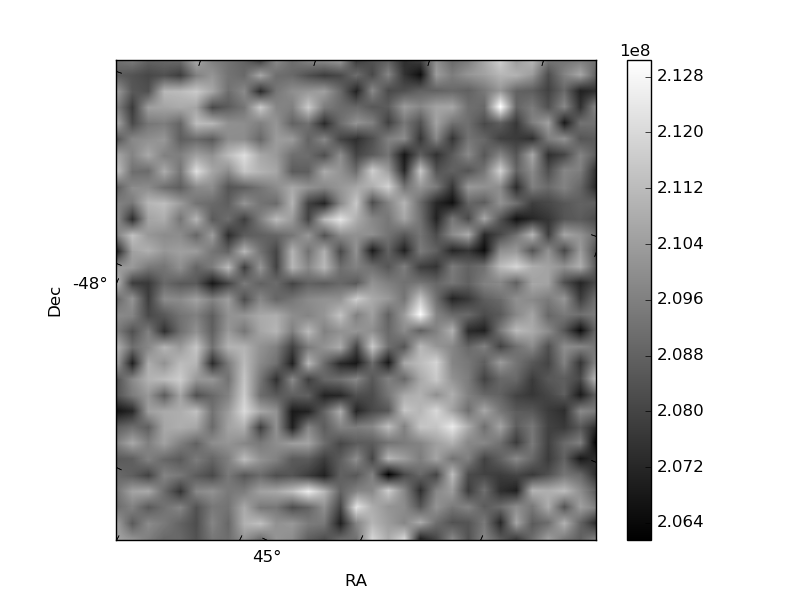
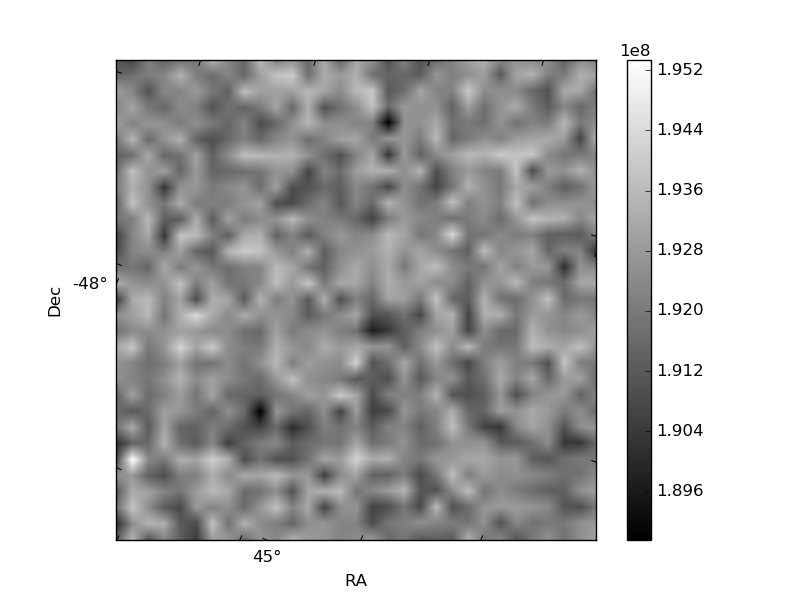
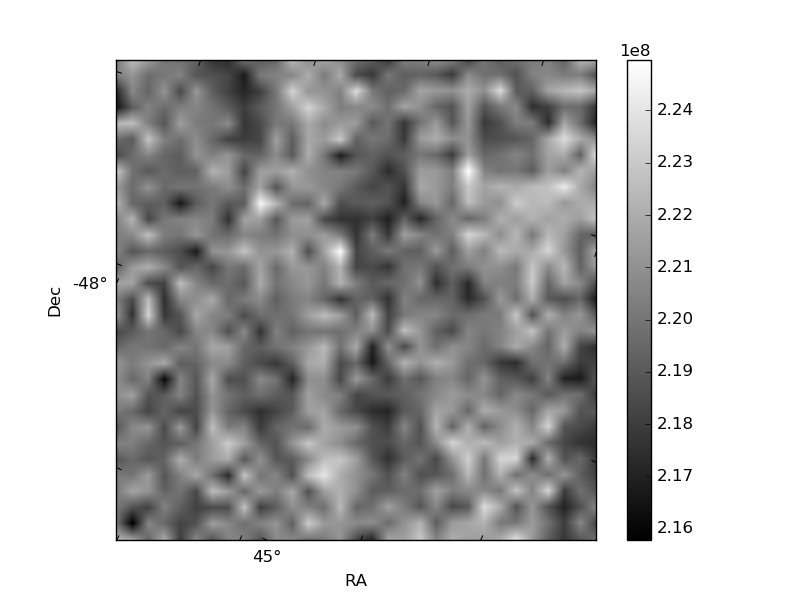
Histogram calculated using DETX and DETY for each event in the final _common_clean file
| Quadrant A | 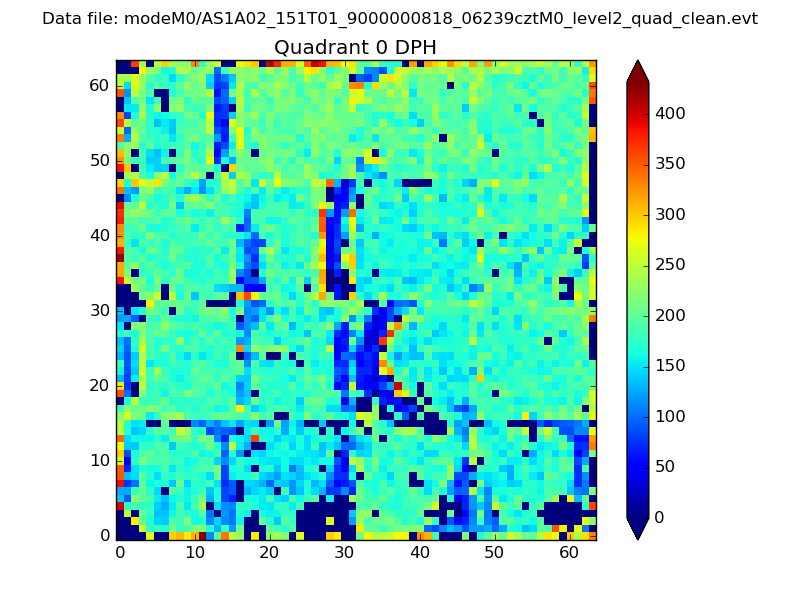 |
 |
Quadrant B |
|---|---|---|---|
| Quadrant D | 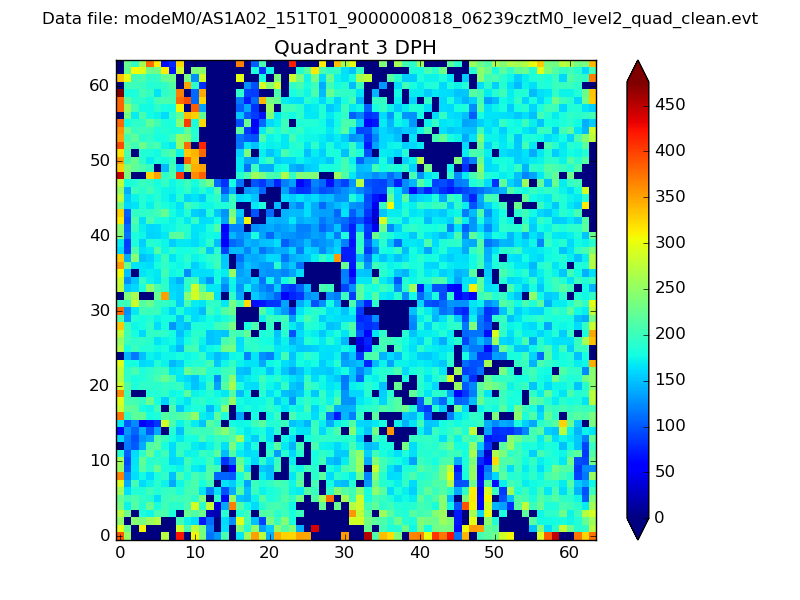 |
 |
Quadrant C |
| Plot type | Count rate plots | Images |
|---|---|---|
| Comparison with Poisson distribution Blue bars denote a histogram of data divided into 1 sec bins. Red curve is a Poisson curve with rate = median count rate of data. |
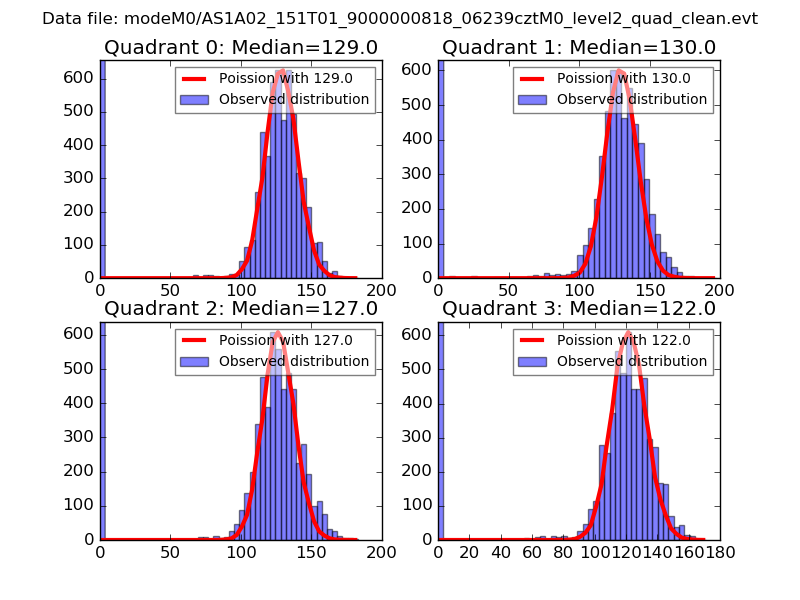 |
 |
| Quadrant-wise count rates Data is divided into 100 sec bins |
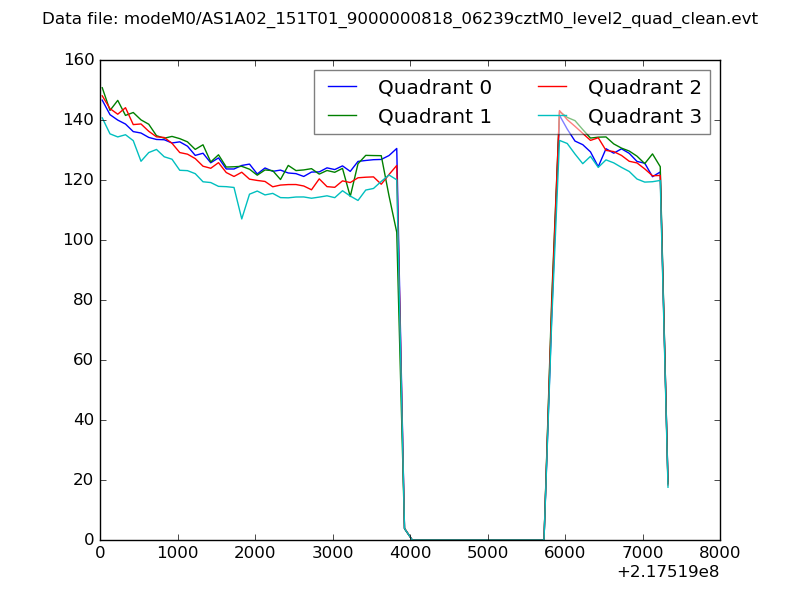 |
|
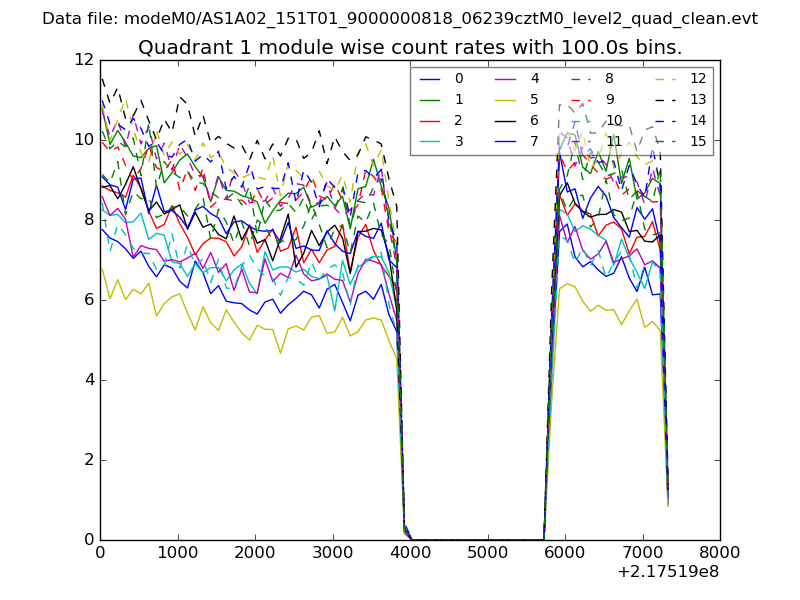
| Module-wise count rates for Quadrant A Data is divided into 100 sec bins |
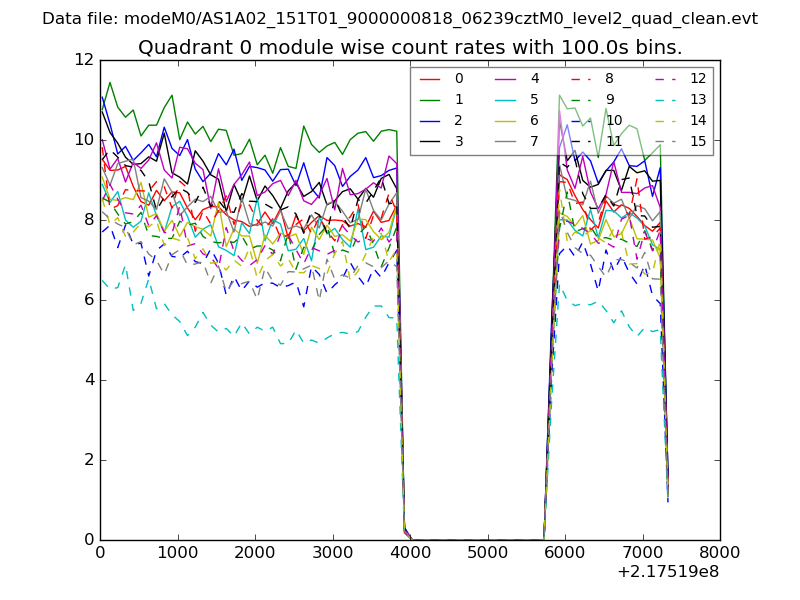 |
 |
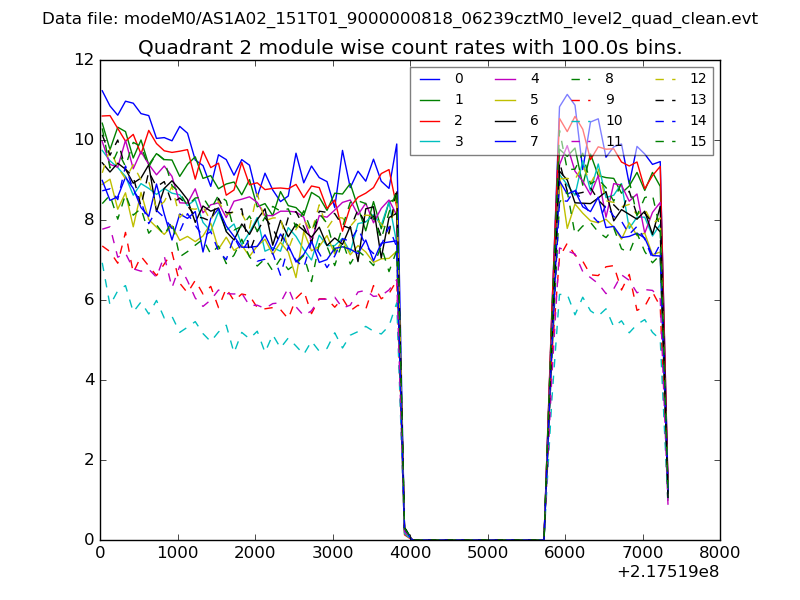
| Module-wise count rates for Quadrant B Data is divided into 100 sec bins |
 |
 |
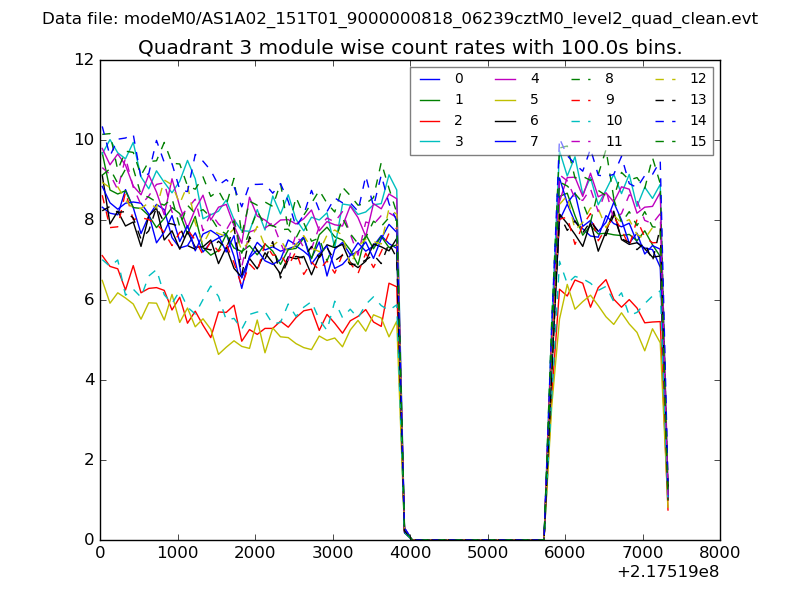
| Module-wise count rates for Quadrant C Data is divided into 100 sec bins |
 |
 |
| Module-wise count rates for Quadrant D Data is divided into 100 sec bins |
 |
 |
| Parameter | Plot |
|---|---|
| CZT HV Monitor | 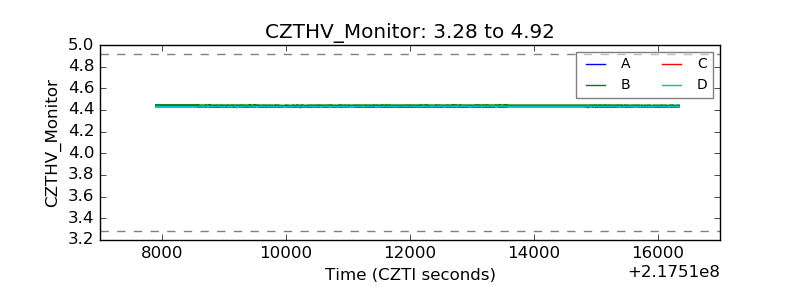 |
| D_VDD | 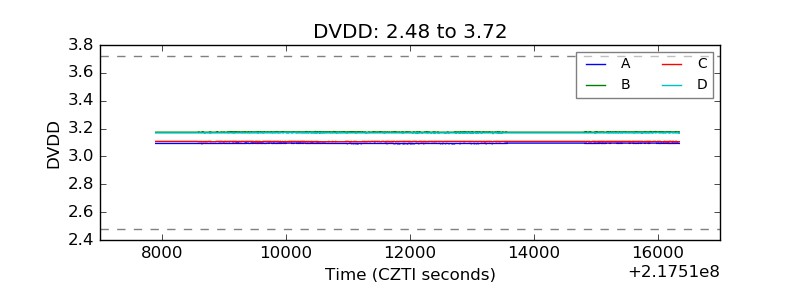 |
| Temperature 1 | 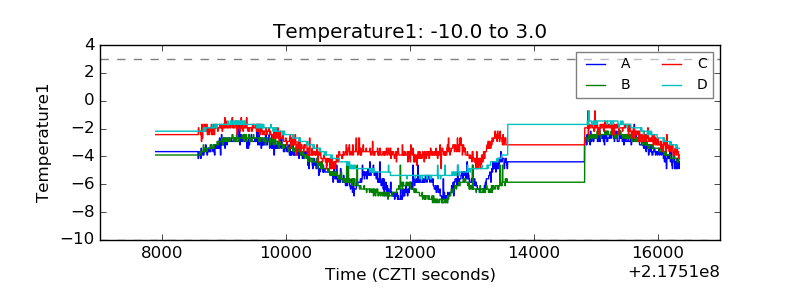 |
| Veto HV Monitor | 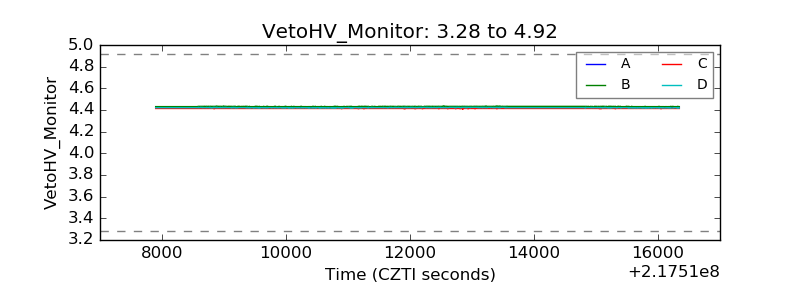 |
| Veto LLD | 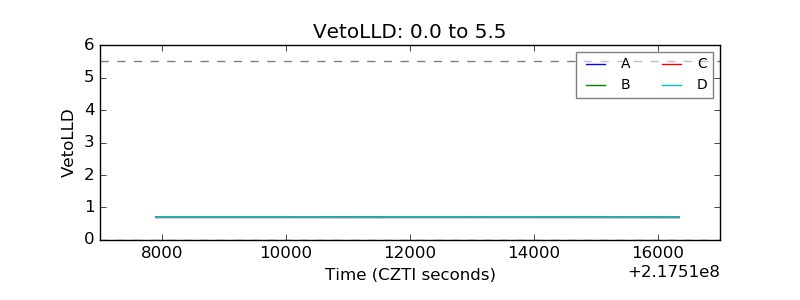 |
| Alpha Counter | 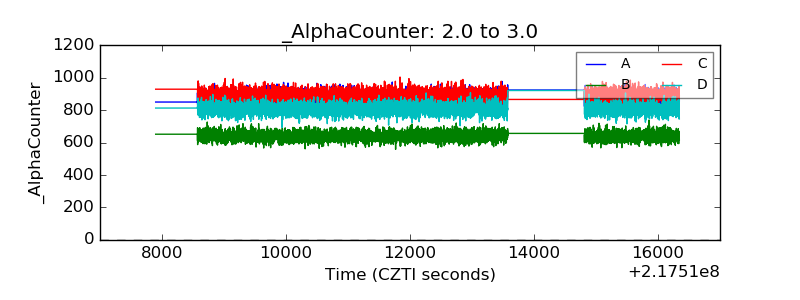 |
| _CPM_Rate | 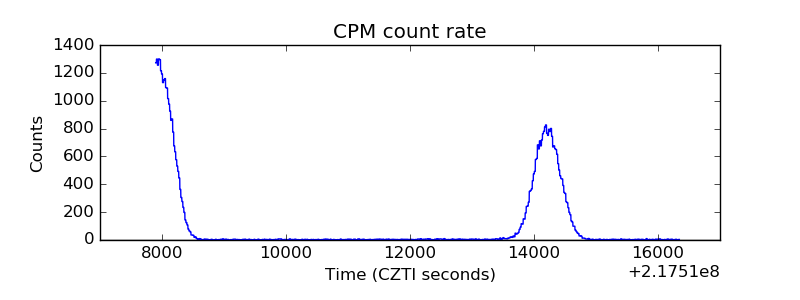 |
| CZT Counter | 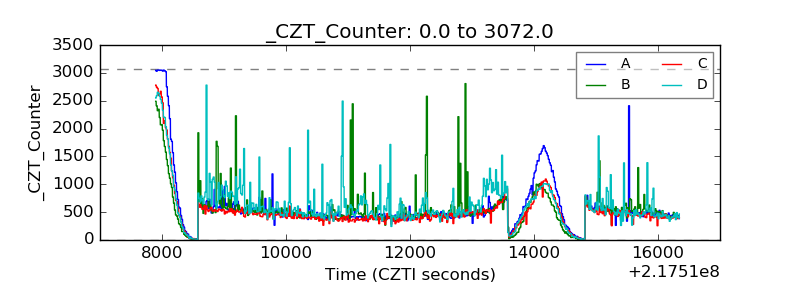 |
| +2.5 Volts monitor |  |
| +5 Volts monitor |  |
| _ROLL_ROT | 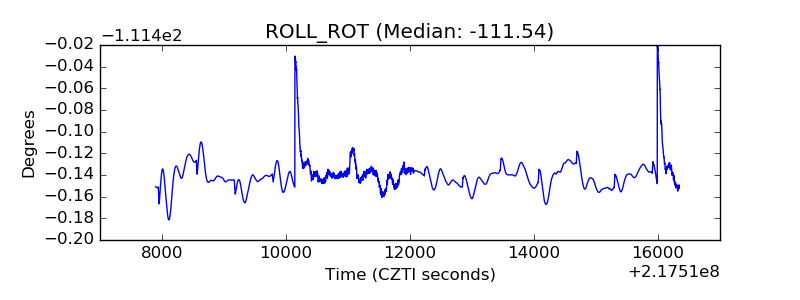 |
| _Roll_DEC | 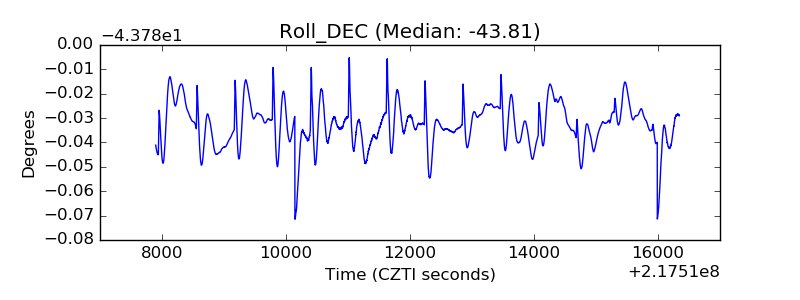 |
| _Roll_RA | 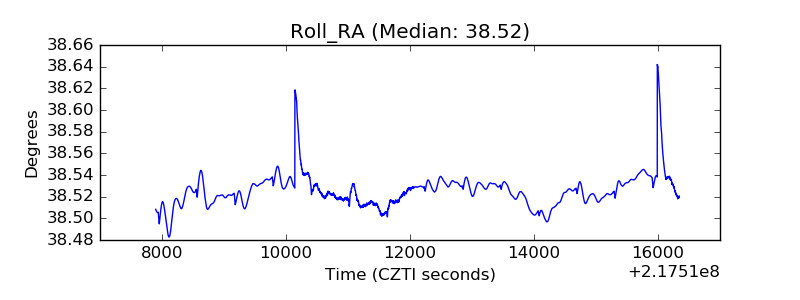 |
| Veto Counter | 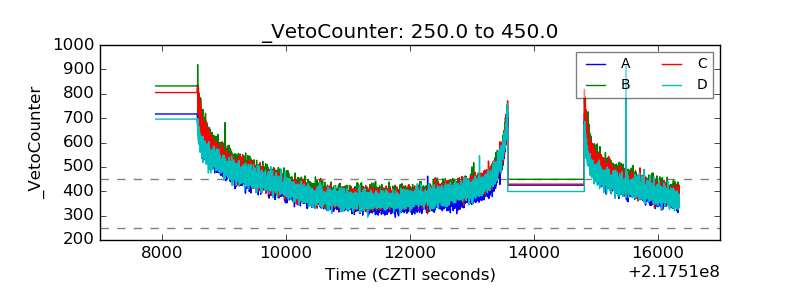 |