| Param | Original file | Final file |
|---|---|---|
| Filename | modeM0/AS1A02_151T01_9000000818_06240cztM0_level2.evt | modeM0/AS1A02_151T01_9000000818_06240cztM0_level2_quad_clean.evt |
| Size (bytes) | 453,648,960 | 100,209,600 |
| Size | 432.6 MB | 95.6 MB |
| Events in quadrant A | 3,004,629 | 654,277 |
| Events in quadrant B | 3,459,483 | 657,579 |
| Events in quadrant C | 2,861,657 | 646,019 |
| Events in quadrant D | 3,963,463 | 616,032 |
| Mode SS | |||
|---|---|---|---|
| Quadrant | BADHDUFLAG | Total packets | Discarded packets |
| A | 0 | 136 | 0 |
| B | 0 | 136 | 0 |
| C | 0 | 136 | 0 |
| D | 0 | 136 | 0 |
| Mode M9 | |||
|---|---|---|---|
| Quadrant | BADHDUFLAG | Total packets | Discarded packets |
| A | 0 | 10 | 0 |
| B | 0 | 10 | 0 |
| C | 0 | 10 | 0 |
| D | 0 | 10 | 0 |
| Mode M0 | |||
|---|---|---|---|
| Quadrant | BADHDUFLAG | Total packets | Discarded packets |
| A | 0 | 13561 | 2 |
| B | 0 | 14763 | 1 |
| C | 0 | 13473 | 1 |
| D | 0 | 16462 | 1 |
| Quadrant | Total seconds | Saturated seconds | Saturation percentage |
|---|---|---|---|
| A | 6606 | 79 | 1.195883% |
| B | 6606 | 158 | 2.391765% |
| C | 6606 | 40 | 0.605510% |
| D | 6606 | 143 | 2.164699% |
Noise dominated data is calculated using 1-second bins in cleaned event files. If a bin has >2000 counts, and if more than 50% of those come from <1% of pixels, then it is considered to be noise-dominated and hence unusable.
| Quadrant | # 1 sec bins | Bins with >0 counts | Bins with >2000 counts | High rate bins dominated by noise | Noise dominated (total time) | Noise dominated (detector-on time) | Marked lightcurve |
|---|---|---|---|---|---|---|---|
| A | 7636 | 6606 | 6 | 6 | 0.08% | 0.09% | 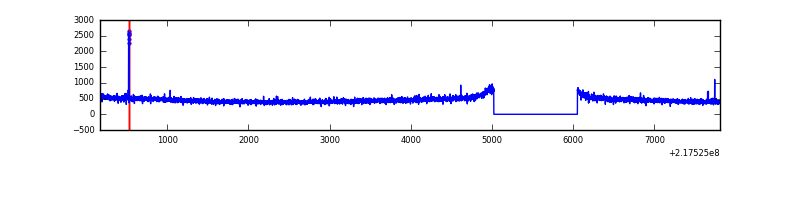 |
| B | 7635 | 6606 | 73 | 73 | 0.96% | 1.11% |  |
| C | 7636 | 6607 | 0 | 0 | 0.00% | 0.00% | 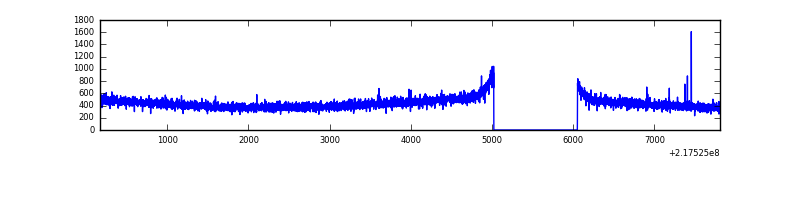 |
| D | 7636 | 6607 | 107 | 107 | 1.40% | 1.62% | 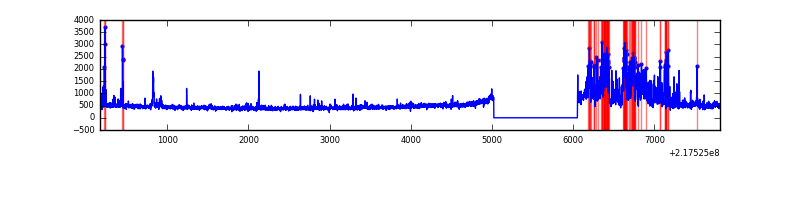 |
Top three noisy pixels from each quadrant. If the there are fewer than three noisy pixels in the level2.evt file, extra rows are filled as -1
| Pixel properties | Quadrant properties | ||||||
|---|---|---|---|---|---|---|---|
| Quadrant | DetID | PixID | Counts | Sigma | Mean | Median | Sigma |
| A | 15 | 236 | 28143 | 176.57 | 762 | 745 | 155.2 |
| A | 14 | 111 | 27542 | 172.7 | 762 | 745 | 155.2 |
| A | 8 | 15 | 11315 | 68.12 | 762 | 745 | 155.2 |
| B | 3 | 64 | 386921 | 2640.88 | 766 | 748 | 146.2 |
| B | 0 | 219 | 54446 | 367.22 | 766 | 748 | 146.2 |
| B | 4 | 81 | 17733 | 116.15 | 766 | 748 | 146.2 |
| C | 13 | 61 | 5665 | 29.02 | 732 | 736 | 169.9 |
| C | 8 | 222 | 2593 | 10.93 | 732 | 736 | 169.9 |
| C | 5 | 175 | 2283 | 9.11 | 732 | 736 | 169.9 |
| D | 11 | 241 | 877782 | 4944.3 | 729 | 707 | 177.4 |
| D | 2 | 63 | 177976 | 999.31 | 729 | 707 | 177.4 |
| D | 13 | 169 | 82308 | 460.01 | 729 | 707 | 177.4 |
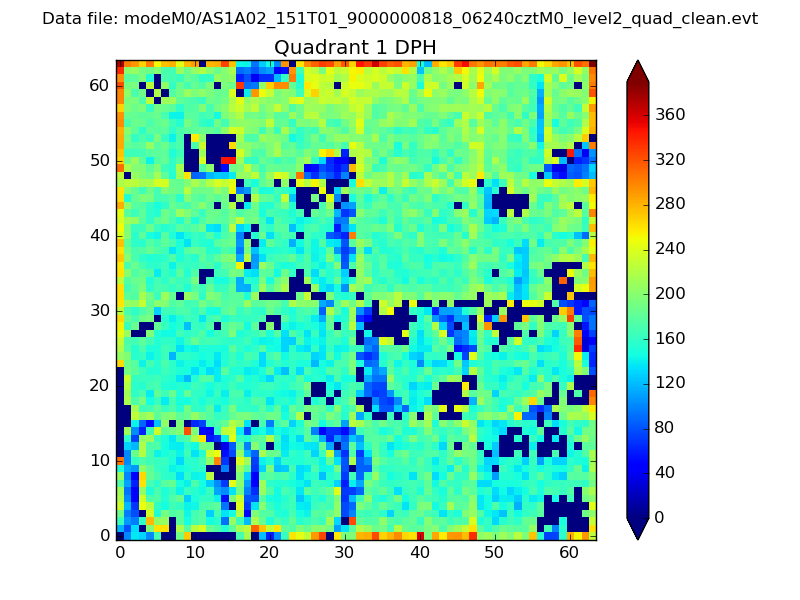
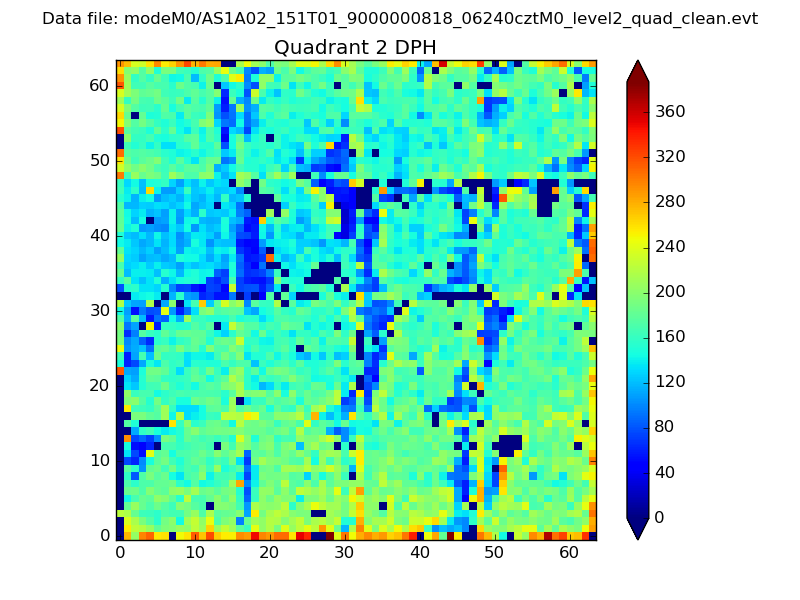
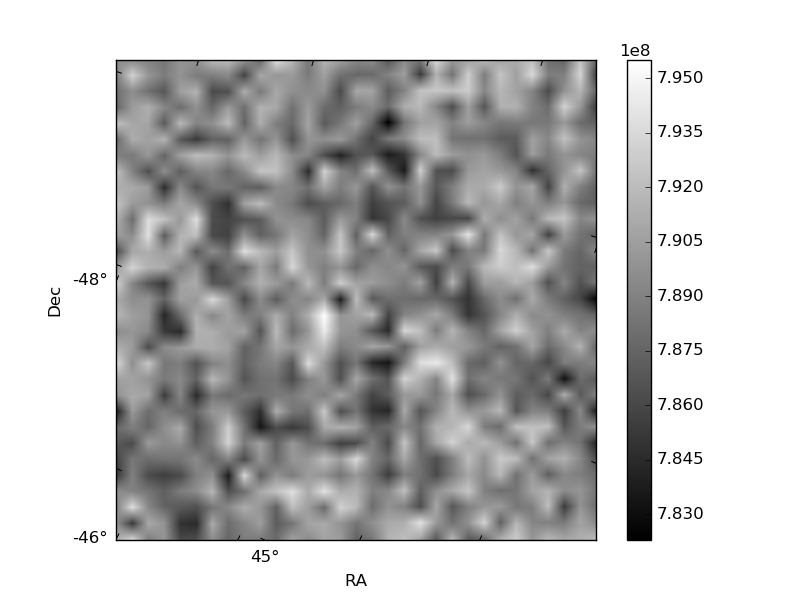
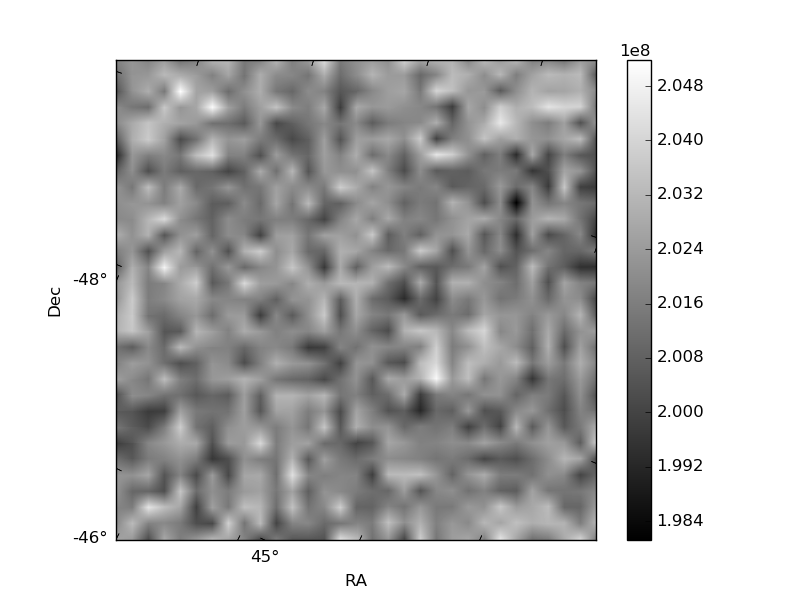
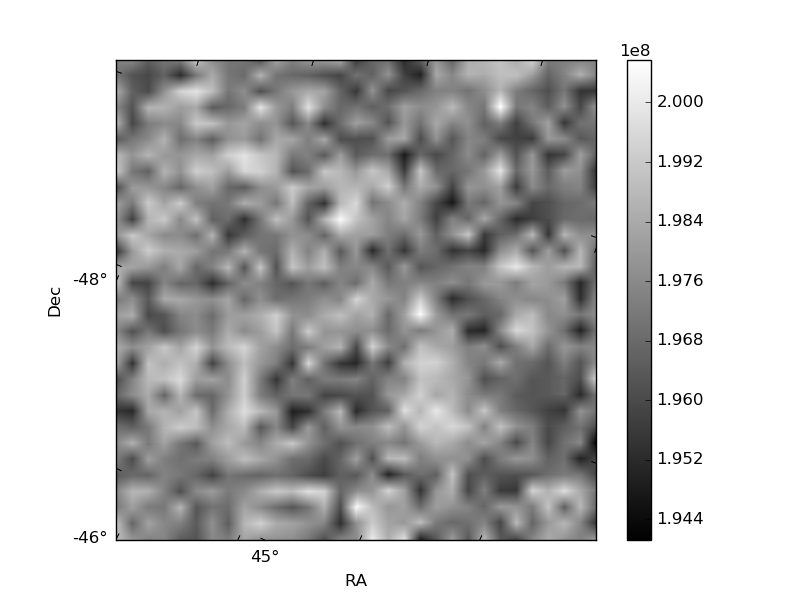
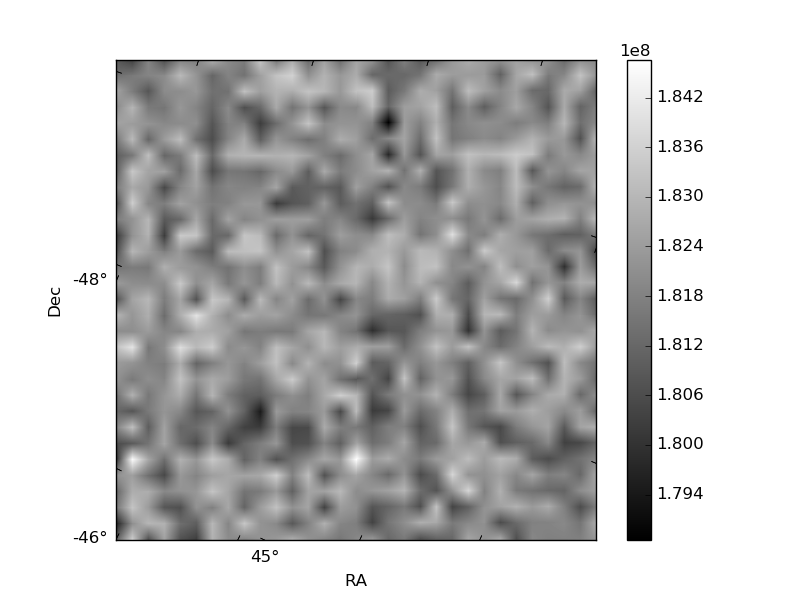
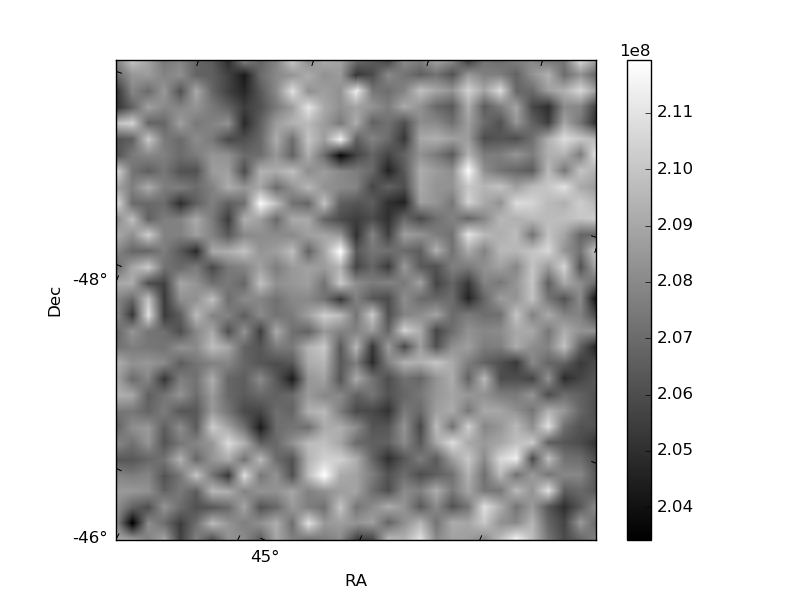
Histogram calculated using DETX and DETY for each event in the final _common_clean file
| Quadrant A | 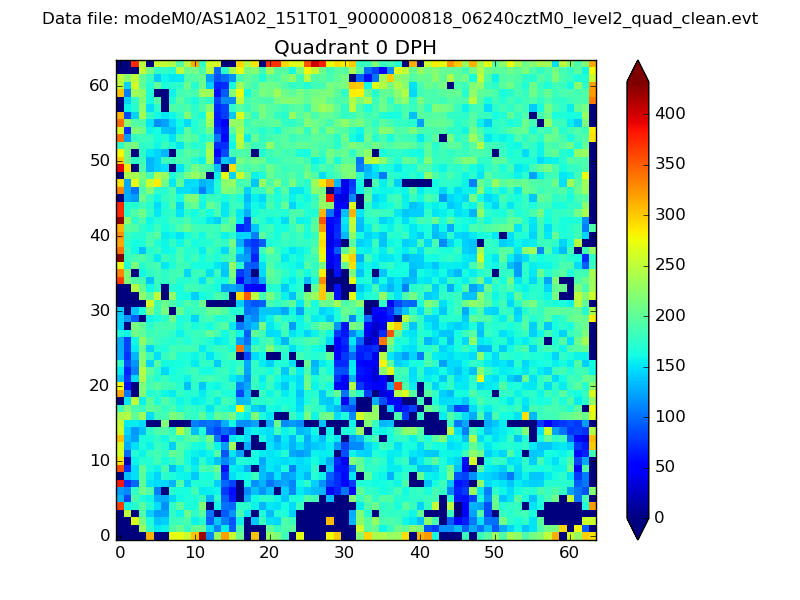 |
 |
Quadrant B |
|---|---|---|---|
| Quadrant D | 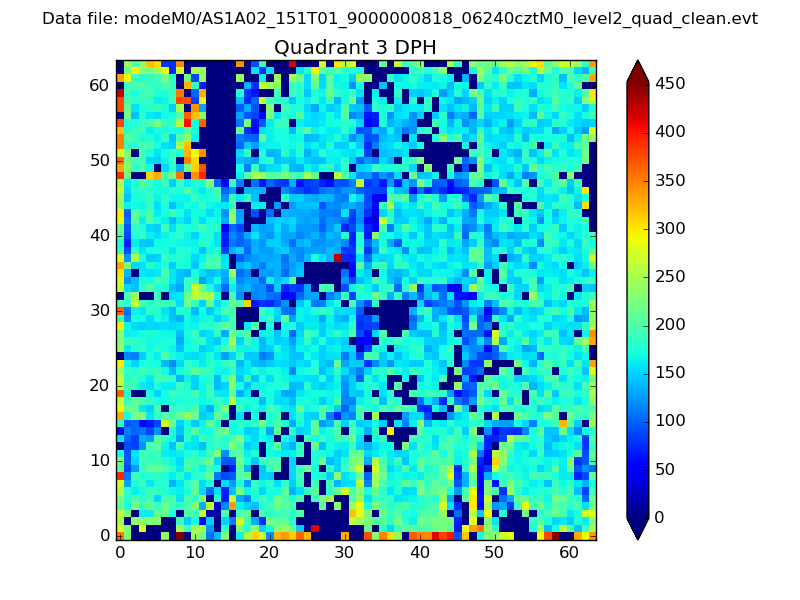 |
 |
Quadrant C |
| Plot type | Count rate plots | Images |
|---|---|---|
| Comparison with Poisson distribution Blue bars denote a histogram of data divided into 1 sec bins. Red curve is a Poisson curve with rate = median count rate of data. |
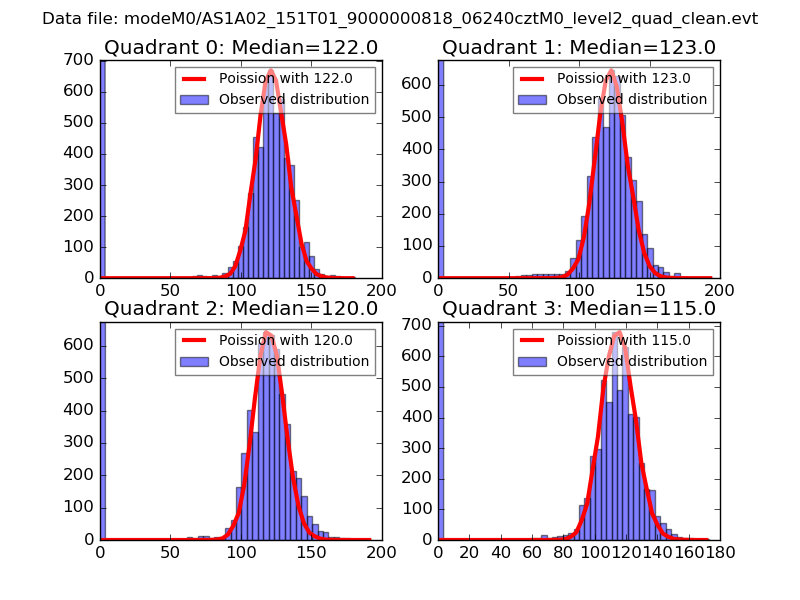 |
 |
| Quadrant-wise count rates Data is divided into 100 sec bins |
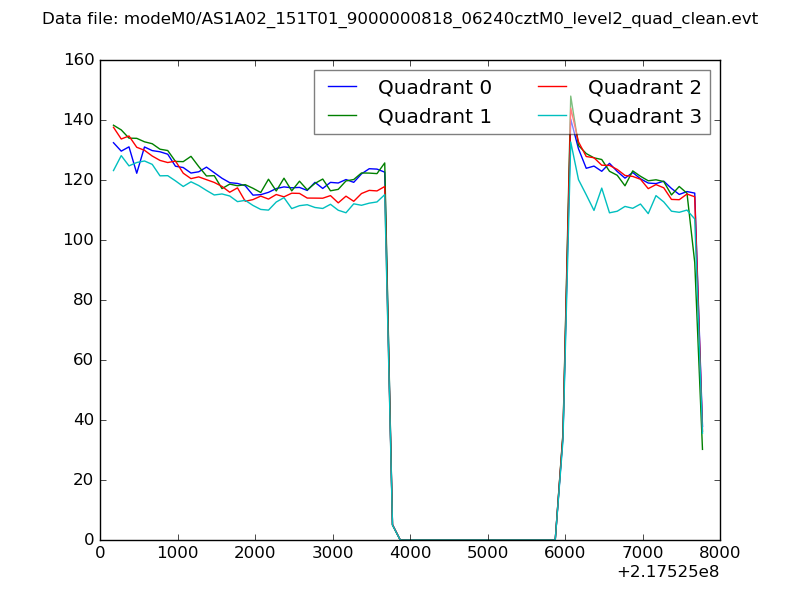 |
|
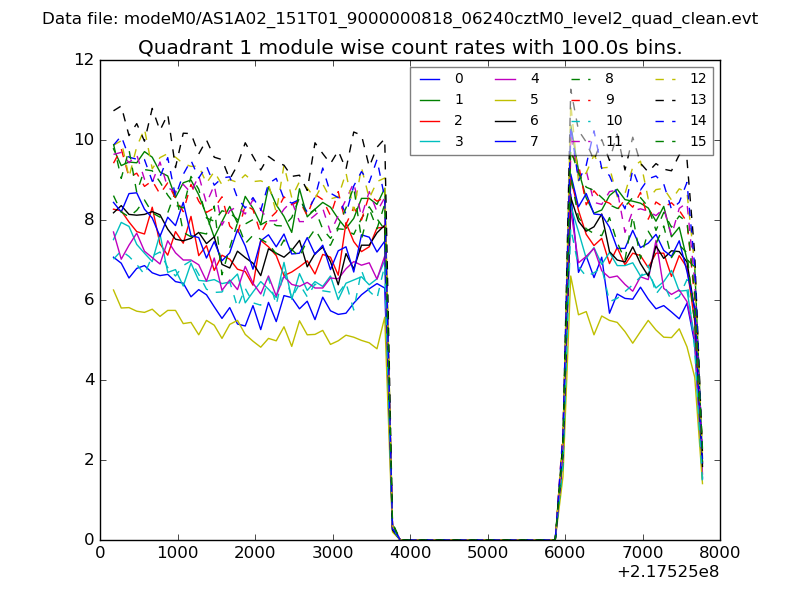
| Module-wise count rates for Quadrant A Data is divided into 100 sec bins |
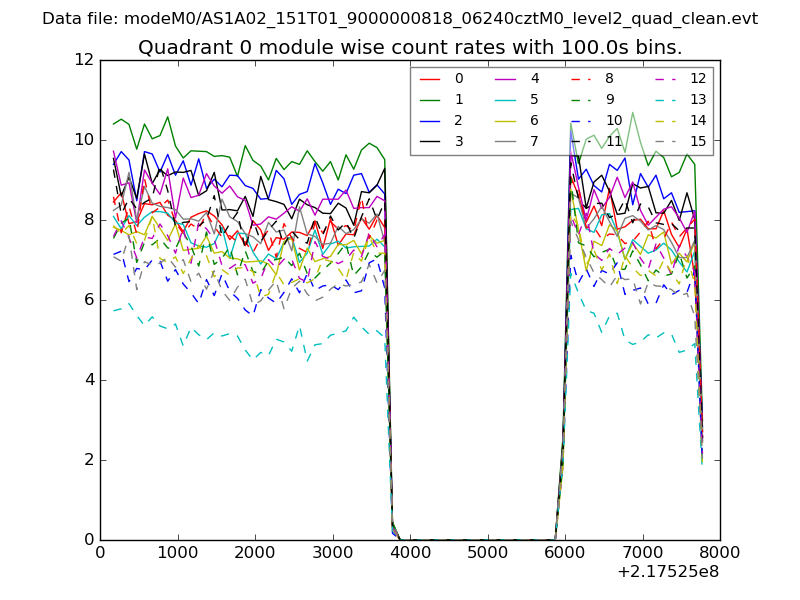 |
 |
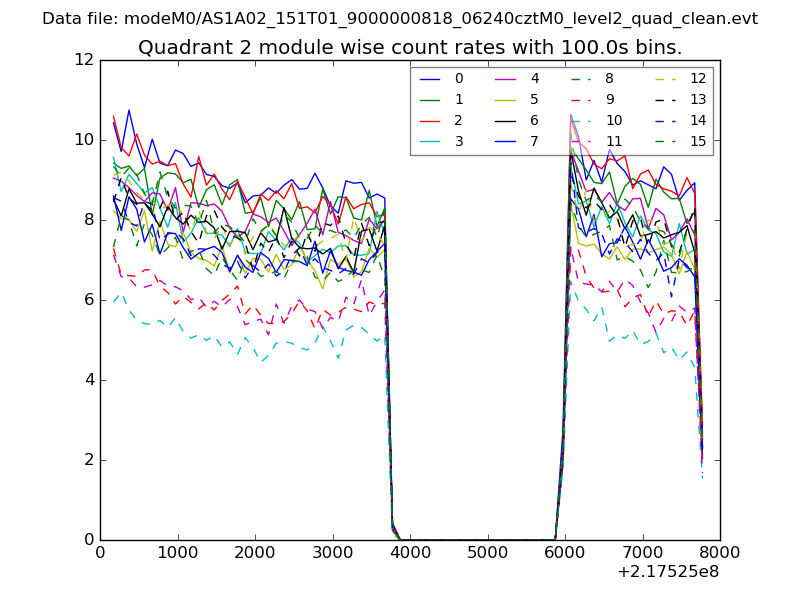
| Module-wise count rates for Quadrant B Data is divided into 100 sec bins |
 |
 |
| Module-wise count rates for Quadrant C Data is divided into 100 sec bins |
 |
 |
| Module-wise count rates for Quadrant D Data is divided into 100 sec bins |
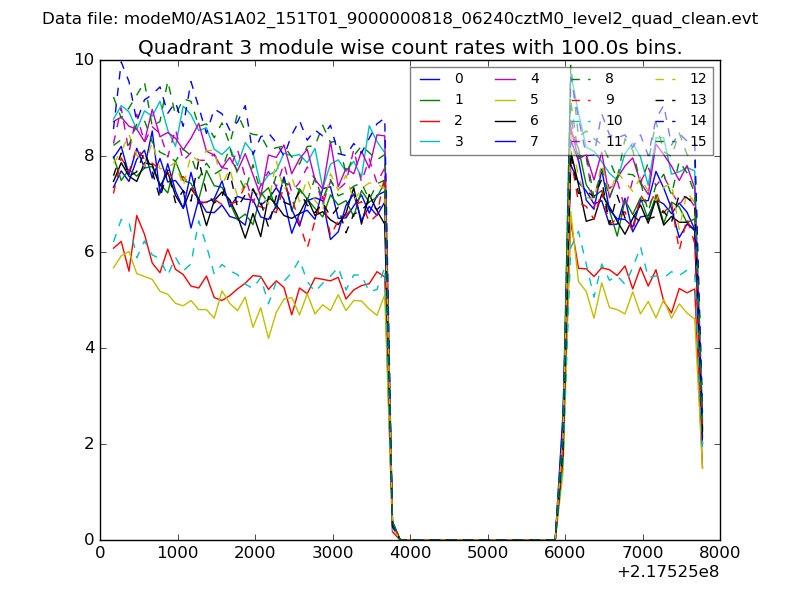 |
 |
| Parameter | Plot |
|---|---|
| CZT HV Monitor | 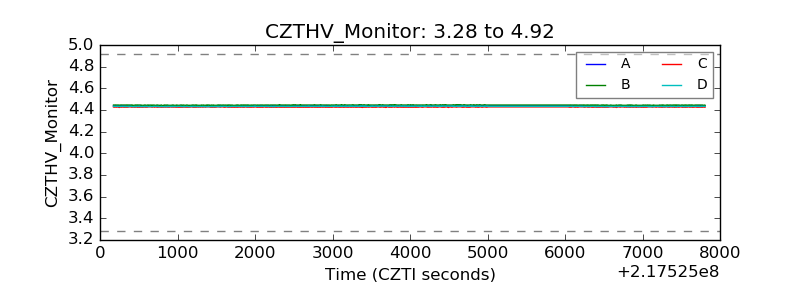 |
| D_VDD | 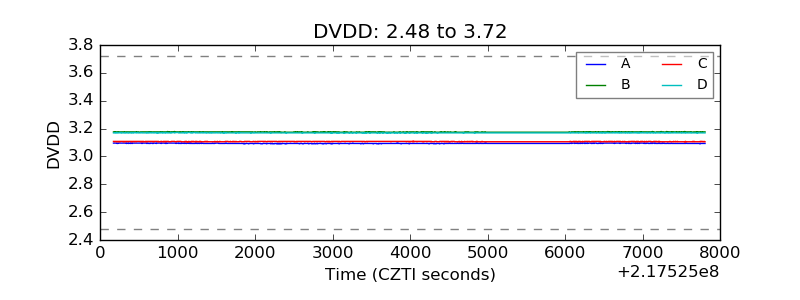 |
| Temperature 1 | 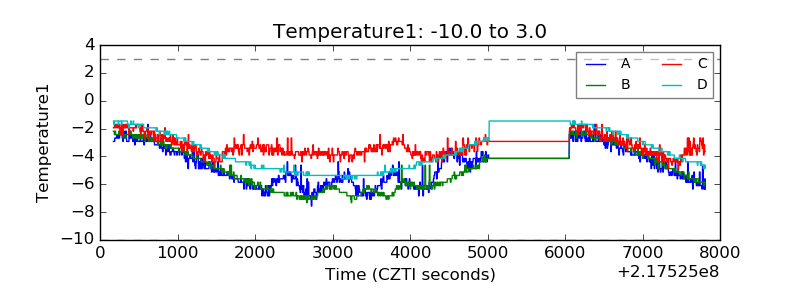 |
| Veto HV Monitor | 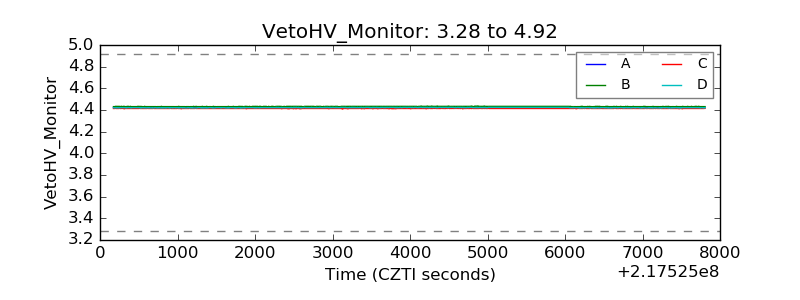 |
| Veto LLD |  |
| Alpha Counter | 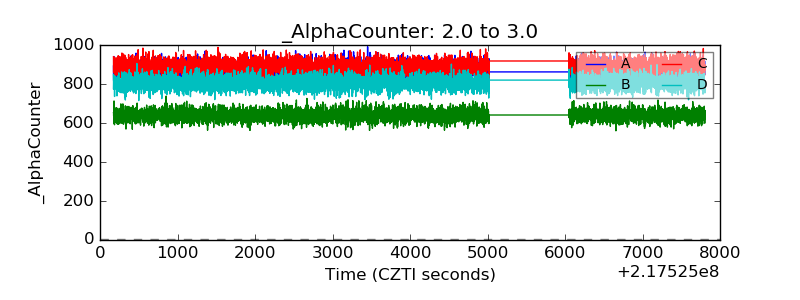 |
| _CPM_Rate | 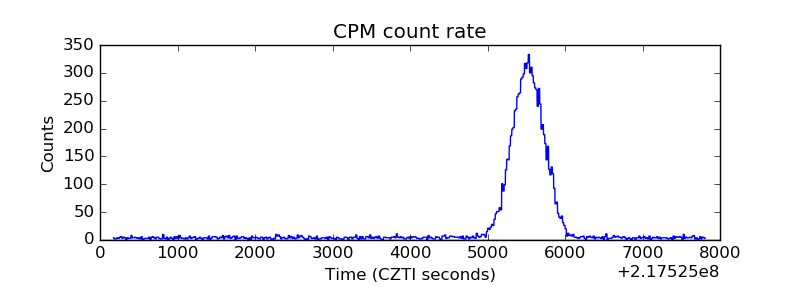 |
| CZT Counter | 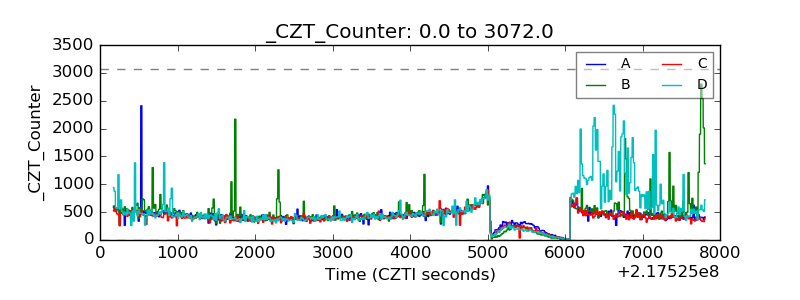 |
| +2.5 Volts monitor |  |
| +5 Volts monitor |  |
| _ROLL_ROT | 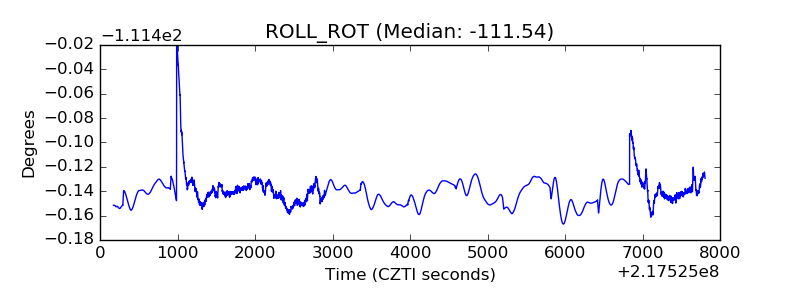 |
| _Roll_DEC | 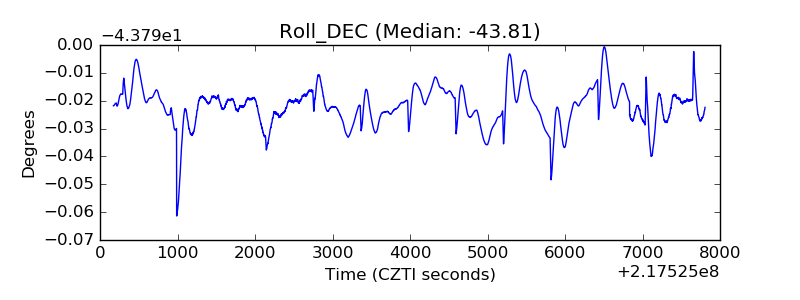 |
| _Roll_RA | 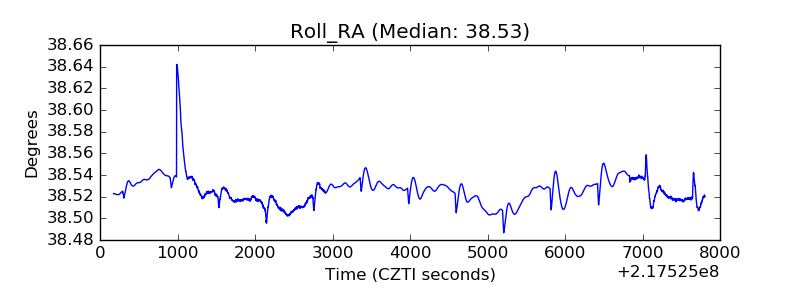 |
| Veto Counter | 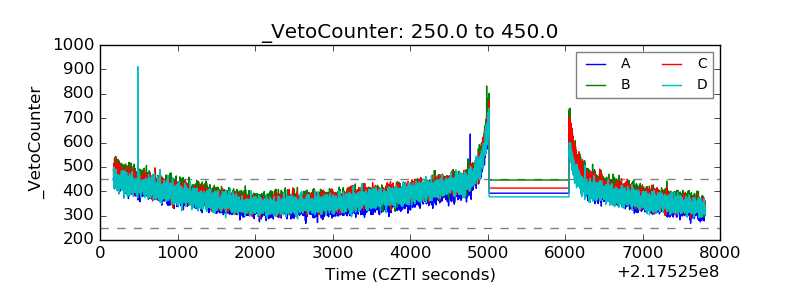 |