| Param | Original file | Final file |
|---|---|---|
| Filename | modeM0/AS1A02_151T01_9000000818_06242cztM0_level2.evt | modeM0/AS1A02_151T01_9000000818_06242cztM0_level2_quad_clean.evt |
| Size (bytes) | 496,673,280 | 100,152,000 |
| Size | 473.7 MB | 95.5 MB |
| Events in quadrant A | 3,787,869 | 634,093 |
| Events in quadrant B | 3,693,251 | 641,669 |
| Events in quadrant C | 3,252,178 | 627,173 |
| Events in quadrant D | 3,795,376 | 604,715 |
| Mode SS | |||
|---|---|---|---|
| Quadrant | BADHDUFLAG | Total packets | Discarded packets |
| A | 0 | 156 | 0 |
| B | 0 | 156 | 0 |
| C | 0 | 156 | 0 |
| D | 0 | 156 | 0 |
| Mode M9 | |||
|---|---|---|---|
| Quadrant | BADHDUFLAG | Total packets | Discarded packets |
| A | 0 | 10 | 0 |
| B | 0 | 10 | 0 |
| C | 0 | 10 | 0 |
| D | 0 | 10 | 0 |
| Mode M0 | |||
|---|---|---|---|
| Quadrant | BADHDUFLAG | Total packets | Discarded packets |
| A | 0 | 16639 | 3 |
| B | 0 | 16332 | 2 |
| C | 0 | 15440 | 2 |
| D | 0 | 16972 | 2 |
| Quadrant | Total seconds | Saturated seconds | Saturation percentage |
|---|---|---|---|
| A | 7541 | 108 | 1.432171% |
| B | 7541 | 105 | 1.392388% |
| C | 7541 | 7 | 0.092826% |
| D | 7541 | 86 | 1.140432% |
Noise dominated data is calculated using 1-second bins in cleaned event files. If a bin has >2000 counts, and if more than 50% of those come from <1% of pixels, then it is considered to be noise-dominated and hence unusable.
| Quadrant | # 1 sec bins | Bins with >0 counts | Bins with >2000 counts | High rate bins dominated by noise | Noise dominated (total time) | Noise dominated (detector-on time) | Marked lightcurve |
|---|---|---|---|---|---|---|---|
| A | 8661 | 7543 | 19 | 19 | 0.22% | 0.25% | 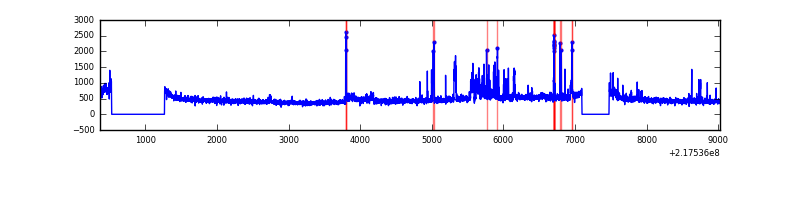 |
| B | 8661 | 7543 | 43 | 43 | 0.50% | 0.57% | 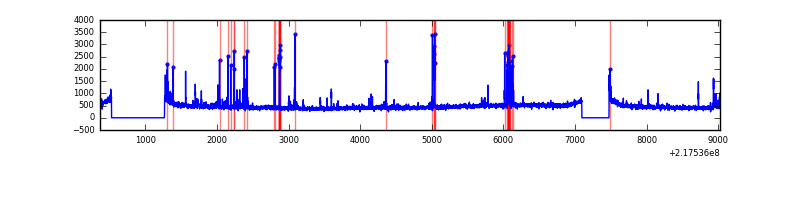 |
| C | 8661 | 7543 | 0 | 0 | 0.00% | 0.00% | 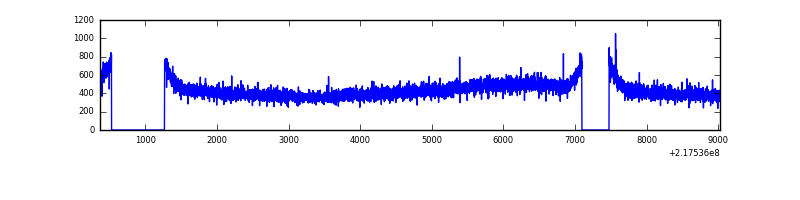 |
| D | 8661 | 7543 | 54 | 54 | 0.62% | 0.72% | 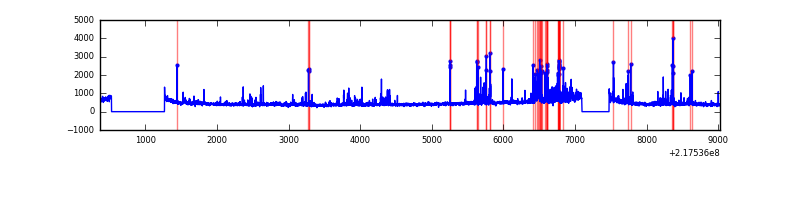 |
Top three noisy pixels from each quadrant. If the there are fewer than three noisy pixels in the level2.evt file, extra rows are filled as -1
| Pixel properties | Quadrant properties | ||||||
|---|---|---|---|---|---|---|---|
| Quadrant | DetID | PixID | Counts | Sigma | Mean | Median | Sigma |
| A | 15 | 236 | 410901 | 2301.92 | 860 | 840 | 178.1 |
| A | 14 | 111 | 34164 | 187.07 | 860 | 840 | 178.1 |
| A | 8 | 15 | 11555 | 60.15 | 860 | 840 | 178.1 |
| B | 0 | 219 | 158812 | 940.87 | 871 | 850 | 167.9 |
| B | 3 | 64 | 107936 | 637.84 | 871 | 850 | 167.9 |
| B | 15 | 35 | 19739 | 112.51 | 871 | 850 | 167.9 |
| C | 13 | 61 | 6695 | 30.35 | 832 | 833 | 193.1 |
| C | 1 | 16 | 3394 | 13.26 | 832 | 833 | 193.1 |
| C | 8 | 222 | 2803 | 10.2 | 832 | 833 | 193.1 |
| D | 2 | 152 | 320128 | 1571.86 | 829 | 801 | 203.2 |
| D | 5 | 97 | 98673 | 481.77 | 829 | 801 | 203.2 |
| D | 2 | 63 | 97063 | 473.84 | 829 | 801 | 203.2 |
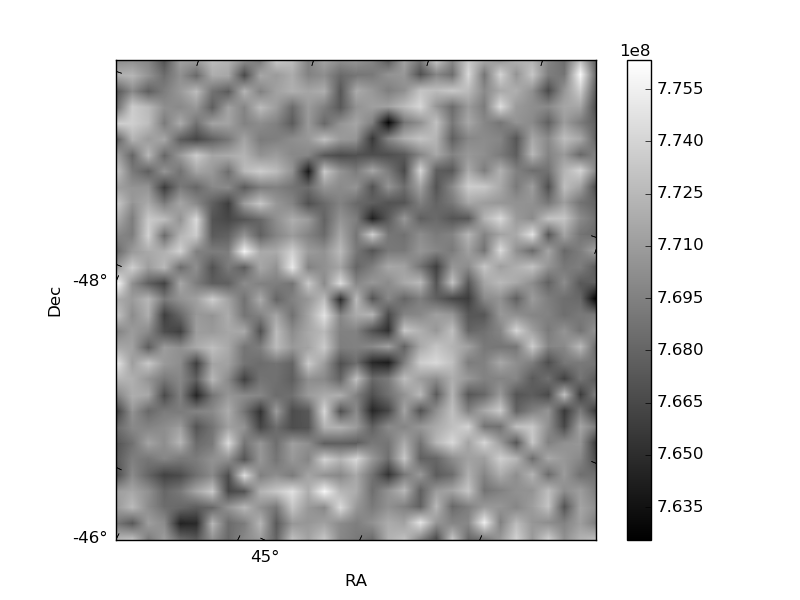
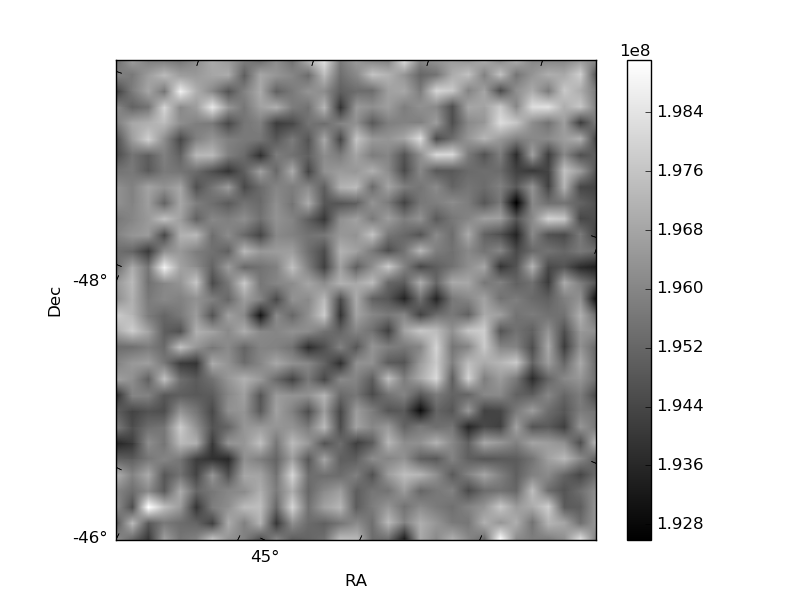
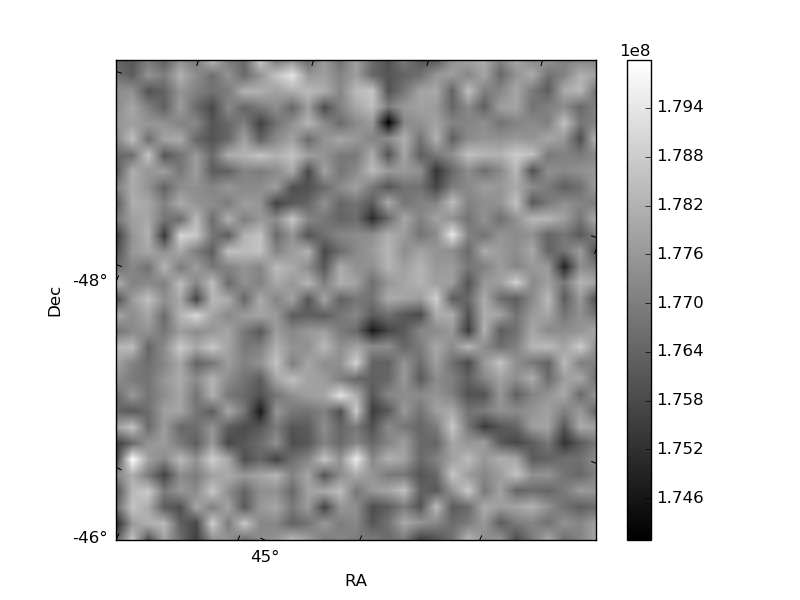
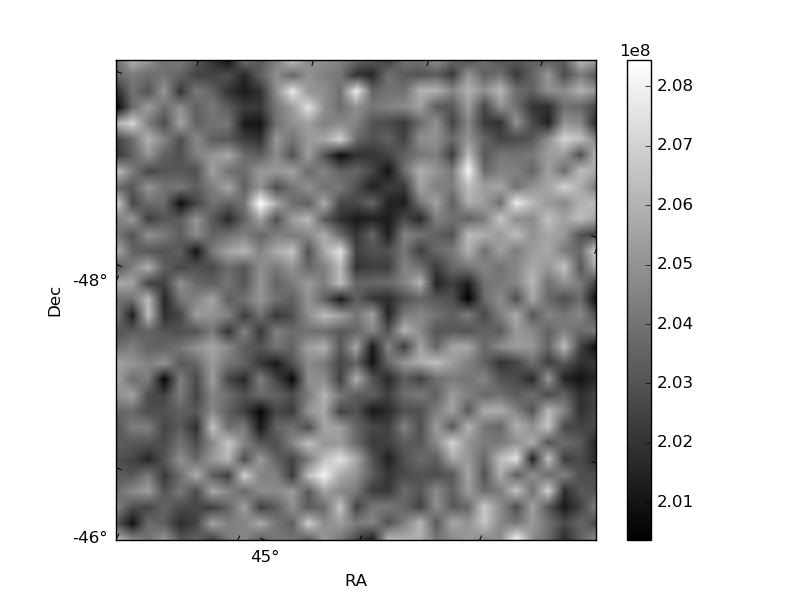
Histogram calculated using DETX and DETY for each event in the final _common_clean file
| Quadrant A | 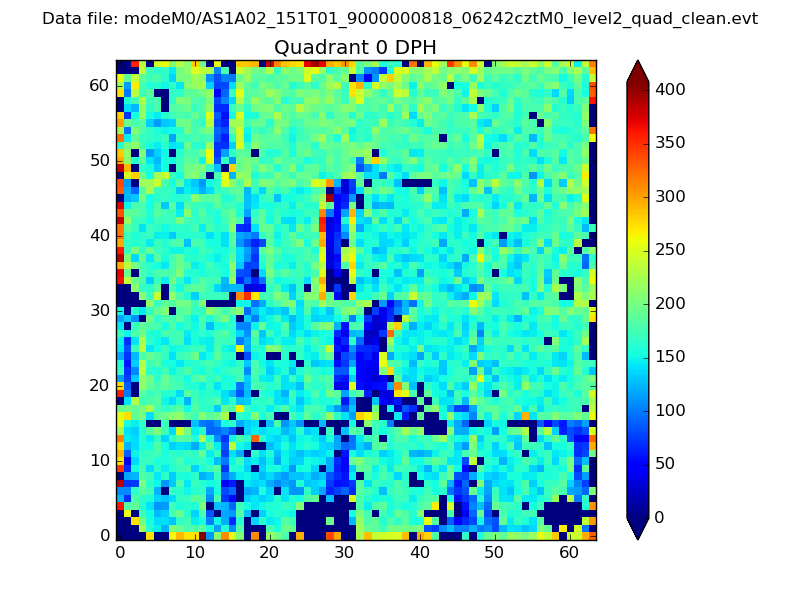 |
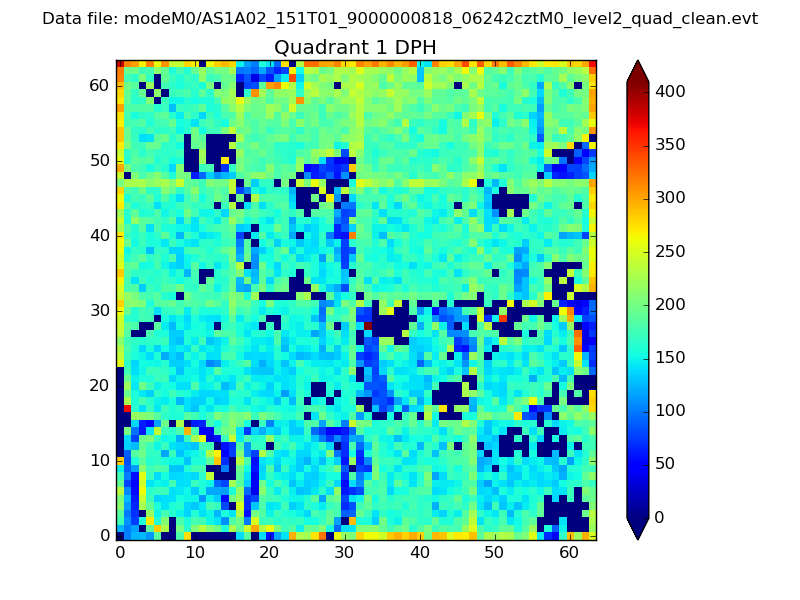 |
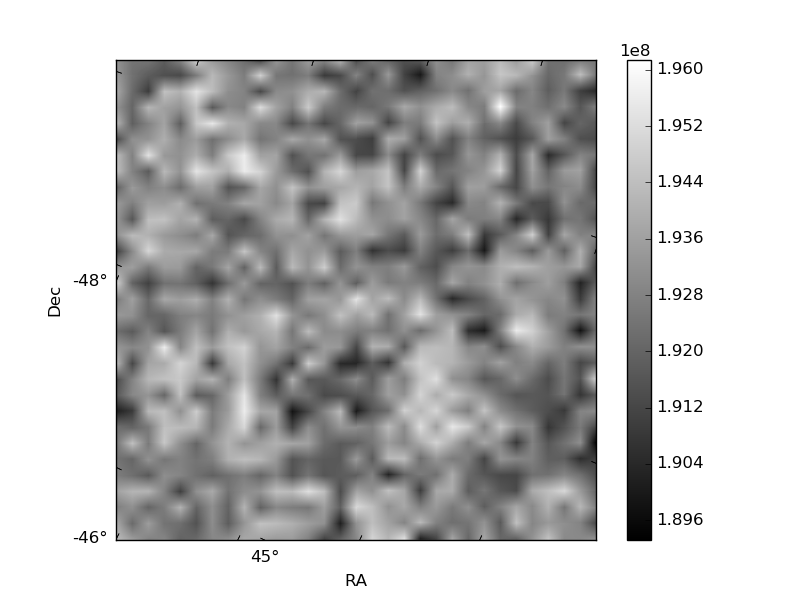
Quadrant B |
|---|---|---|---|
| Quadrant D | 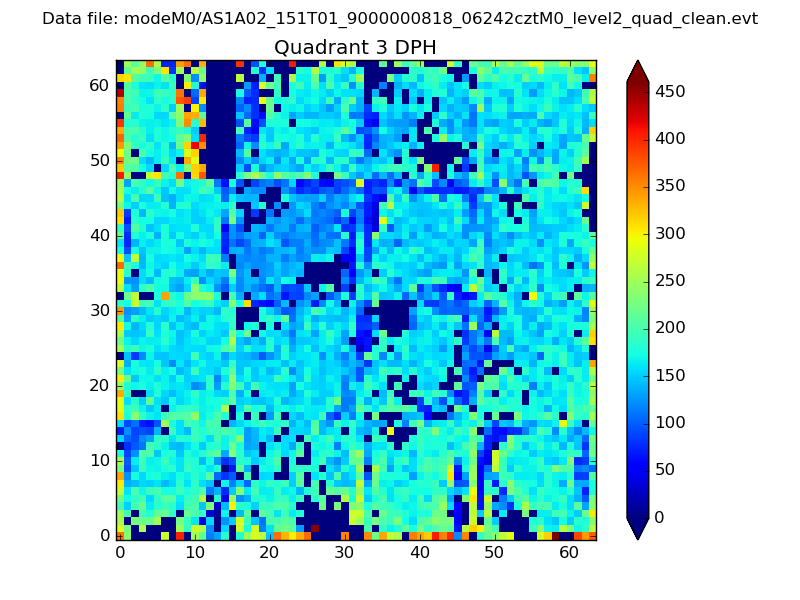 |
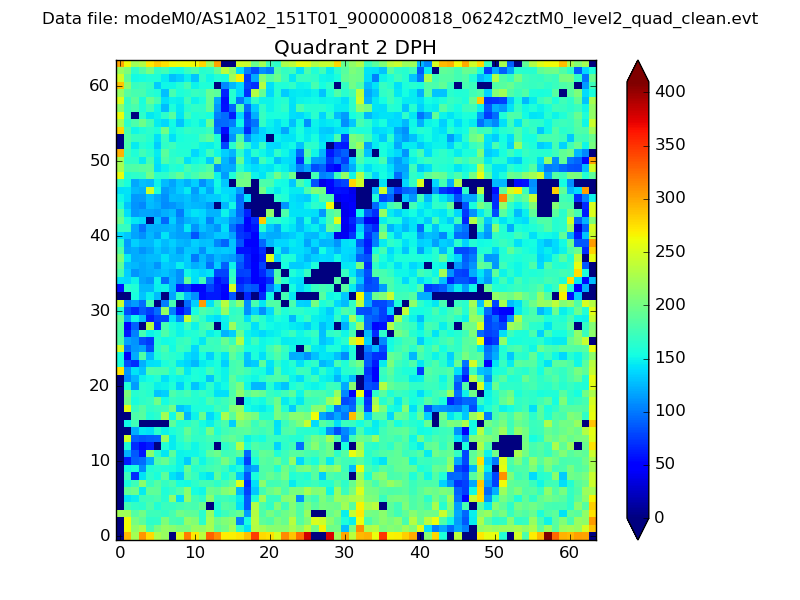 |
Quadrant C |
| Plot type | Count rate plots | Images |
|---|---|---|
| Comparison with Poisson distribution Blue bars denote a histogram of data divided into 1 sec bins. Red curve is a Poisson curve with rate = median count rate of data. |
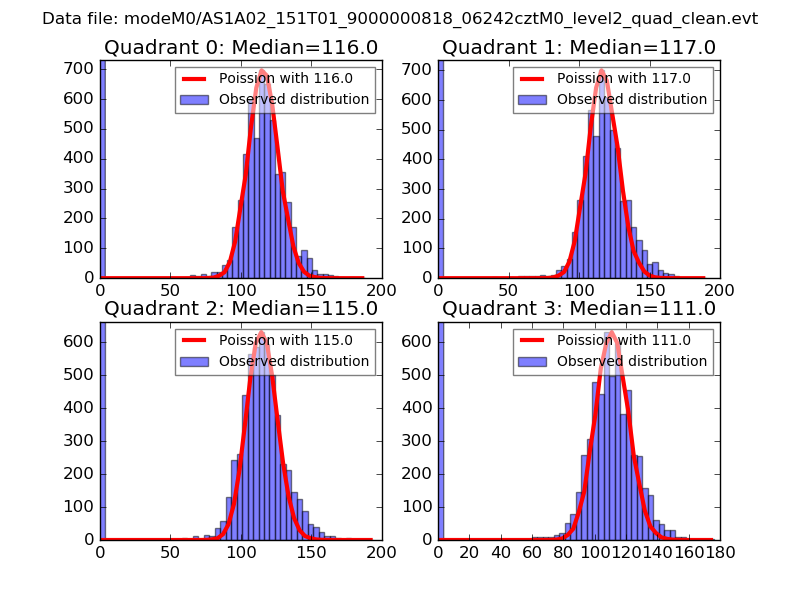 |
 |
| Quadrant-wise count rates Data is divided into 100 sec bins |
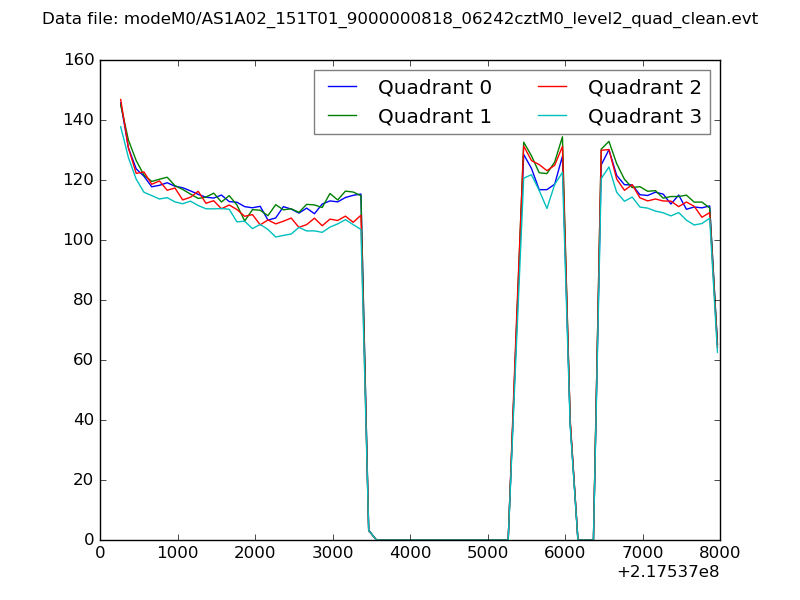 |
|
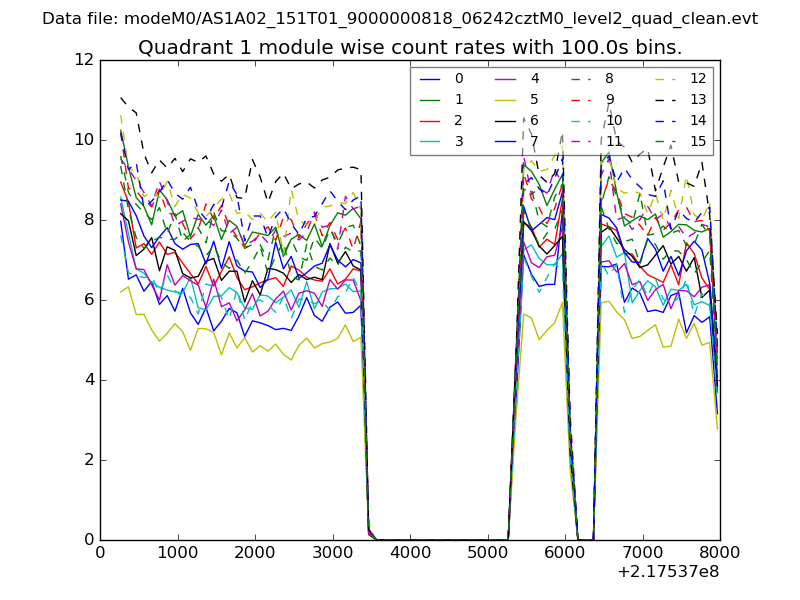
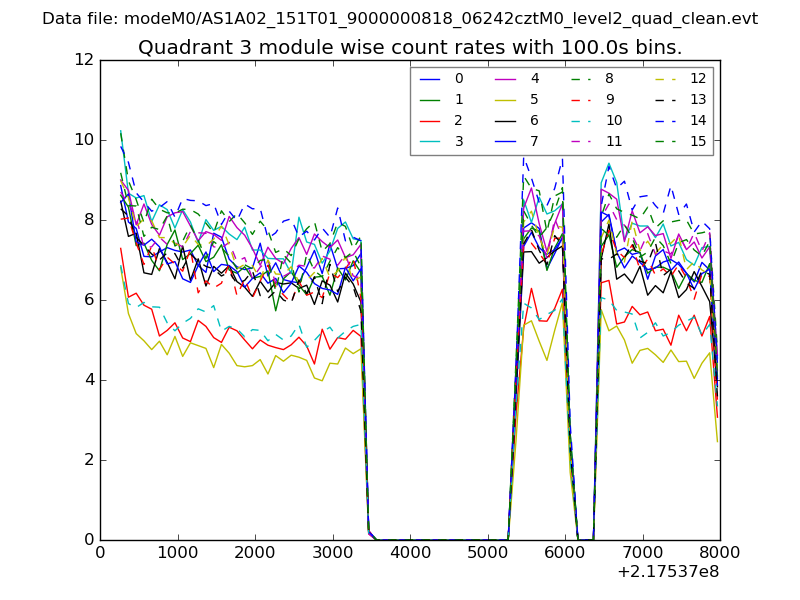
| Module-wise count rates for Quadrant A Data is divided into 100 sec bins |
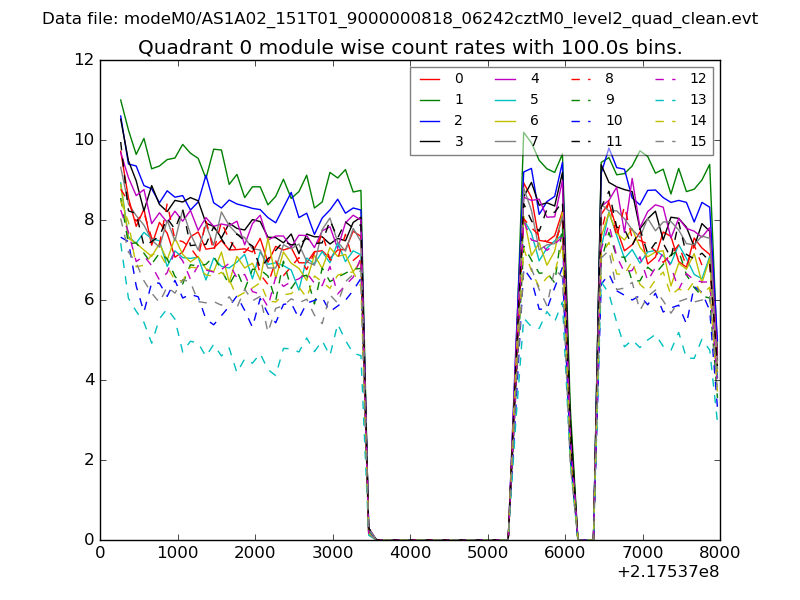 |
 |
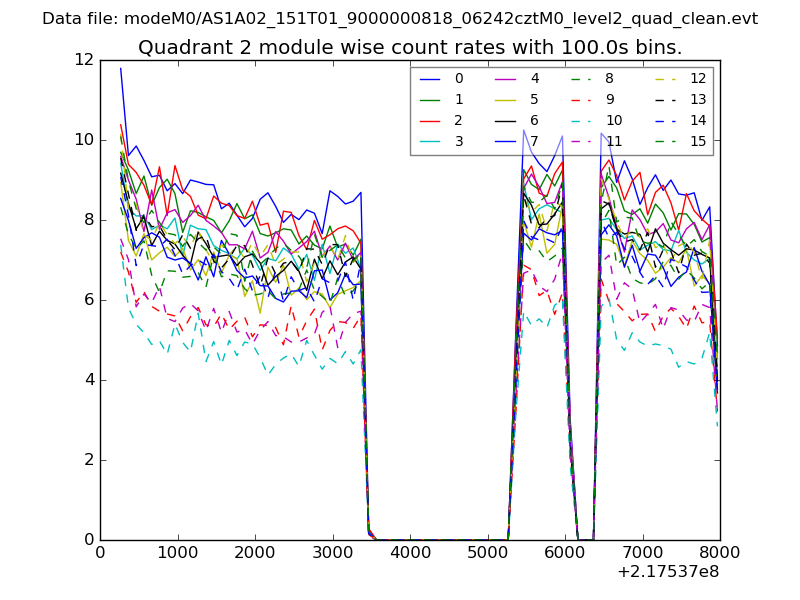
| Module-wise count rates for Quadrant B Data is divided into 100 sec bins |
 |
 |
| Module-wise count rates for Quadrant C Data is divided into 100 sec bins |
 |
 |
| Module-wise count rates for Quadrant D Data is divided into 100 sec bins |
 |
 |
| Parameter | Plot |
|---|---|
| CZT HV Monitor | 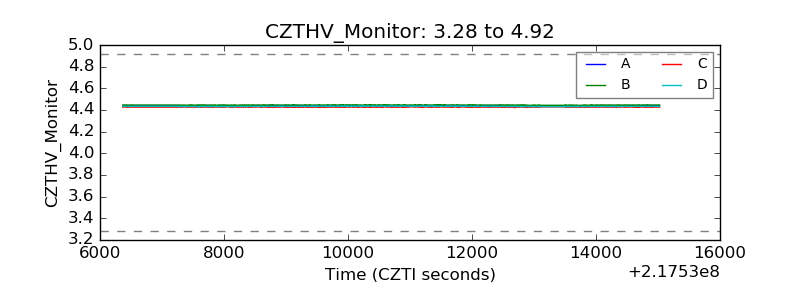 |
| D_VDD | 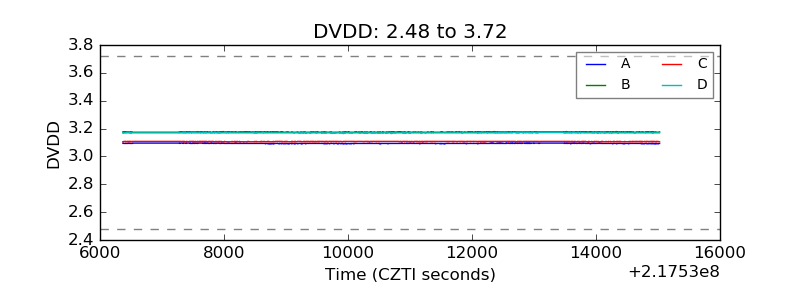 |
| Temperature 1 | 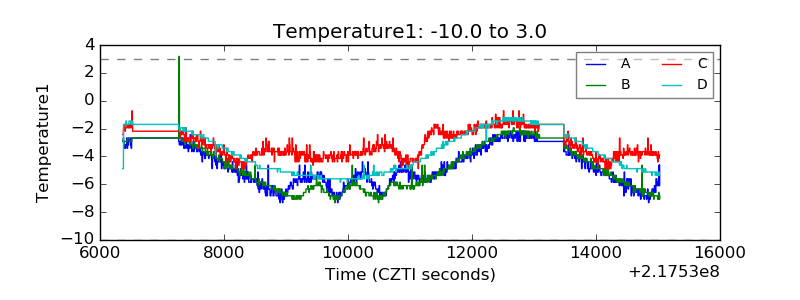 |
| Veto HV Monitor | 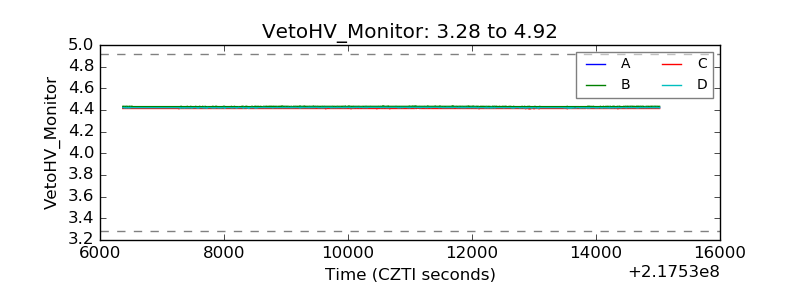 |
| Veto LLD | 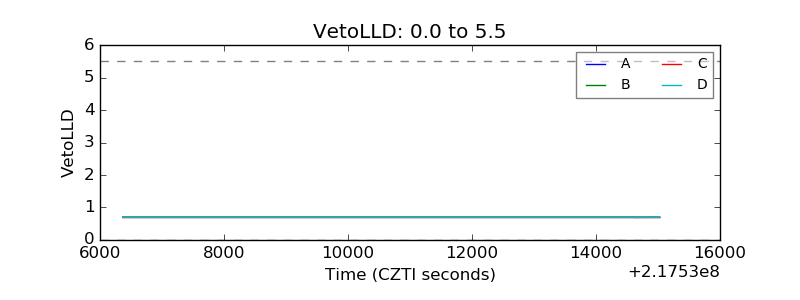 |
| Alpha Counter | 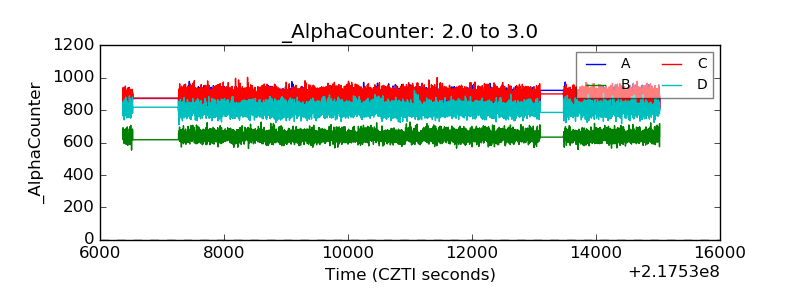 |
| _CPM_Rate | 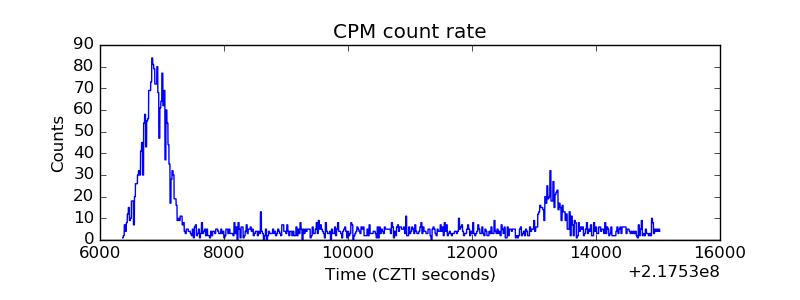 |
| CZT Counter | 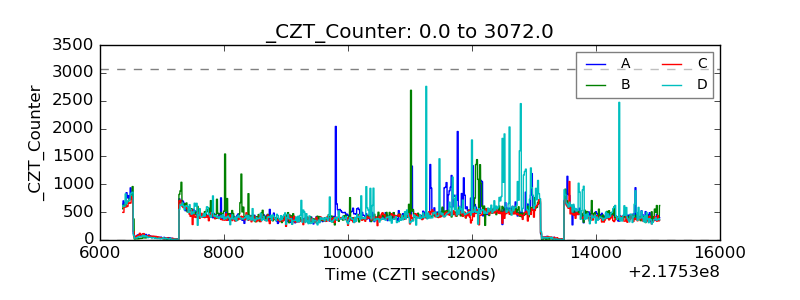 |
| +2.5 Volts monitor |  |
| +5 Volts monitor |  |
| _ROLL_ROT | 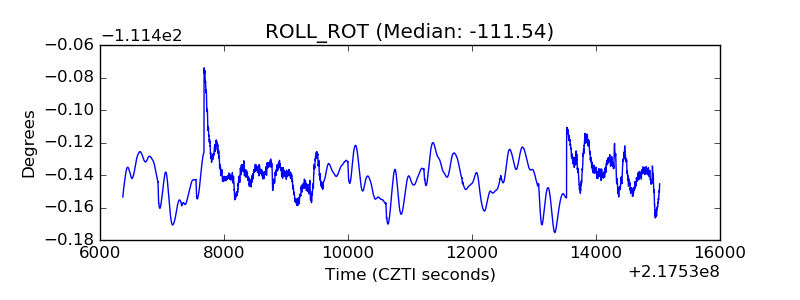 |
| _Roll_DEC |  |
| _Roll_RA | 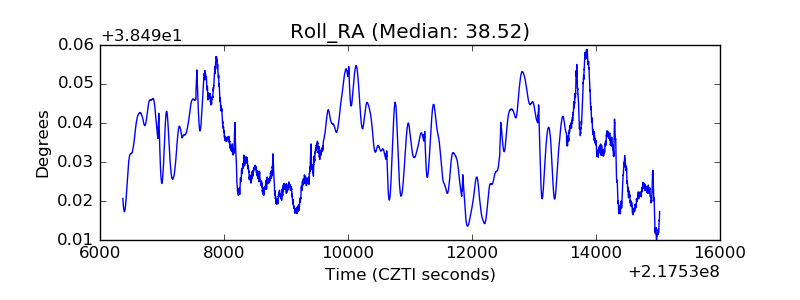 |
| Veto Counter | 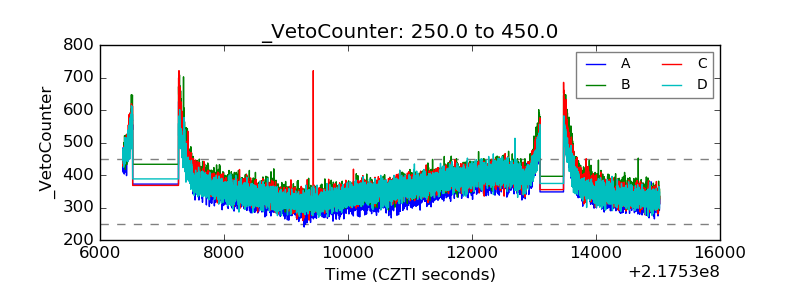 |