| Param | Original file | Final file |
|---|---|---|
| Filename | modeM0/AS1A02_151T01_9000000818_06243cztM0_level2.evt | modeM0/AS1A02_151T01_9000000818_06243cztM0_level2_quad_clean.evt |
| Size (bytes) | 498,003,840 | 104,826,240 |
| Size | 474.9 MB | 100.0 MB |
| Events in quadrant A | 3,603,560 | 666,976 |
| Events in quadrant B | 3,870,930 | 671,769 |
| Events in quadrant C | 3,293,152 | 663,384 |
| Events in quadrant D | 3,792,804 | 638,574 |
| Mode SS | |||
|---|---|---|---|
| Quadrant | BADHDUFLAG | Total packets | Discarded packets |
| A | 0 | 156 | 0 |
| B | 0 | 156 | 0 |
| C | 0 | 156 | 0 |
| D | 0 | 156 | 0 |
| Mode M9 | |||
|---|---|---|---|
| Quadrant | BADHDUFLAG | Total packets | Discarded packets |
| A | 0 | 6 | 0 |
| B | 0 | 6 | 0 |
| C | 0 | 6 | 0 |
| D | 0 | 6 | 0 |
| Mode M0 | |||
|---|---|---|---|
| Quadrant | BADHDUFLAG | Total packets | Discarded packets |
| A | 0 | 16153 | 3 |
| B | 0 | 16950 | 2 |
| C | 0 | 15615 | 2 |
| D | 0 | 16830 | 2 |
| Quadrant | Total seconds | Saturated seconds | Saturation percentage |
|---|---|---|---|
| A | 7674 | 39 | 0.508210% |
| B | 7674 | 157 | 2.045869% |
| C | 7674 | 21 | 0.273651% |
| D | 7674 | 33 | 0.430023% |
Noise dominated data is calculated using 1-second bins in cleaned event files. If a bin has >2000 counts, and if more than 50% of those come from <1% of pixels, then it is considered to be noise-dominated and hence unusable.
| Quadrant | # 1 sec bins | Bins with >0 counts | Bins with >2000 counts | High rate bins dominated by noise | Noise dominated (total time) | Noise dominated (detector-on time) | Marked lightcurve |
|---|---|---|---|---|---|---|---|
| A | 8324 | 7676 | 7 | 7 | 0.08% | 0.09% |  |
| B | 8324 | 7676 | 88 | 88 | 1.06% | 1.15% | 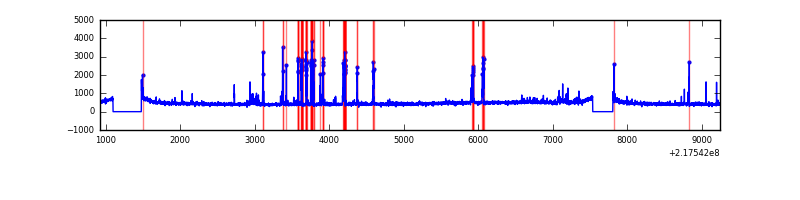 |
| C | 8324 | 7676 | 0 | 0 | 0.00% | 0.00% | 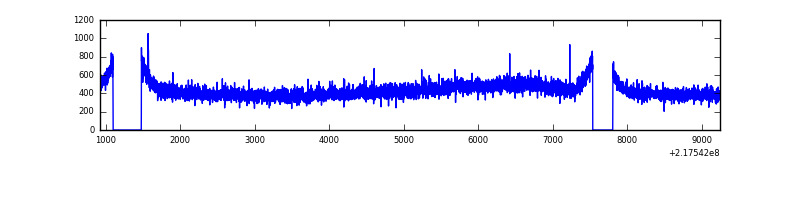 |
| D | 8324 | 7676 | 16 | 16 | 0.19% | 0.21% | 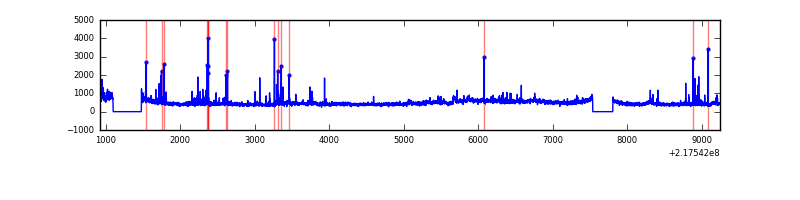 |
Top three noisy pixels from each quadrant. If the there are fewer than three noisy pixels in the level2.evt file, extra rows are filled as -1
| Pixel properties | Quadrant properties | ||||||
|---|---|---|---|---|---|---|---|
| Quadrant | DetID | PixID | Counts | Sigma | Mean | Median | Sigma |
| A | 15 | 236 | 145053 | 814.48 | 867 | 849 | 177.0 |
| A | 15 | 239 | 91604 | 512.6 | 867 | 849 | 177.0 |
| A | 13 | 14 | 10642 | 55.31 | 867 | 849 | 177.0 |
| B | 0 | 219 | 368601 | 2181.47 | 876 | 853 | 168.6 |
| B | 4 | 81 | 31718 | 183.09 | 876 | 853 | 168.6 |
| B | 15 | 35 | 27631 | 158.85 | 876 | 853 | 168.6 |
| C | 13 | 61 | 6666 | 29.89 | 842 | 844 | 194.8 |
| C | 1 | 16 | 3447 | 13.36 | 842 | 844 | 194.8 |
| C | 8 | 222 | 2673 | 9.39 | 842 | 844 | 194.8 |
| D | 2 | 63 | 267346 | 1303.65 | 838 | 810 | 204.5 |
| D | 2 | 152 | 147685 | 718.38 | 838 | 810 | 204.5 |
| D | 2 | 136 | 59223 | 285.7 | 838 | 810 | 204.5 |
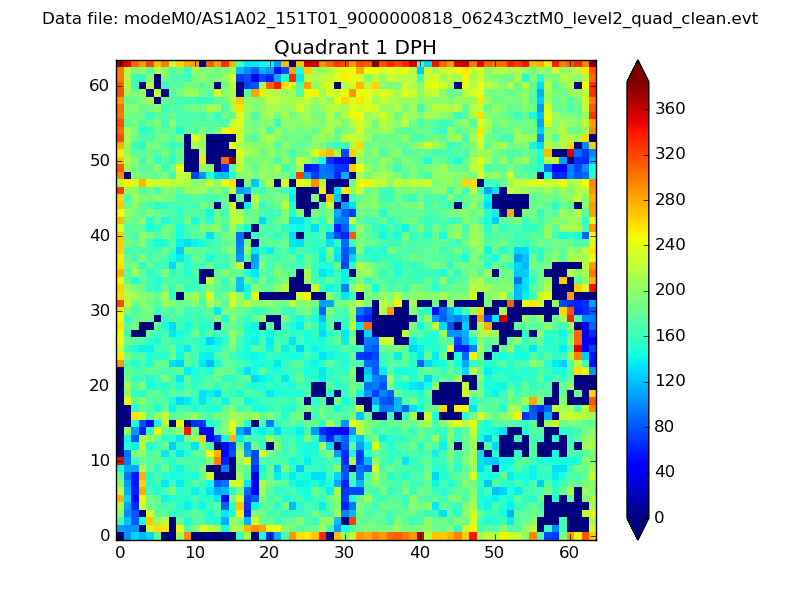
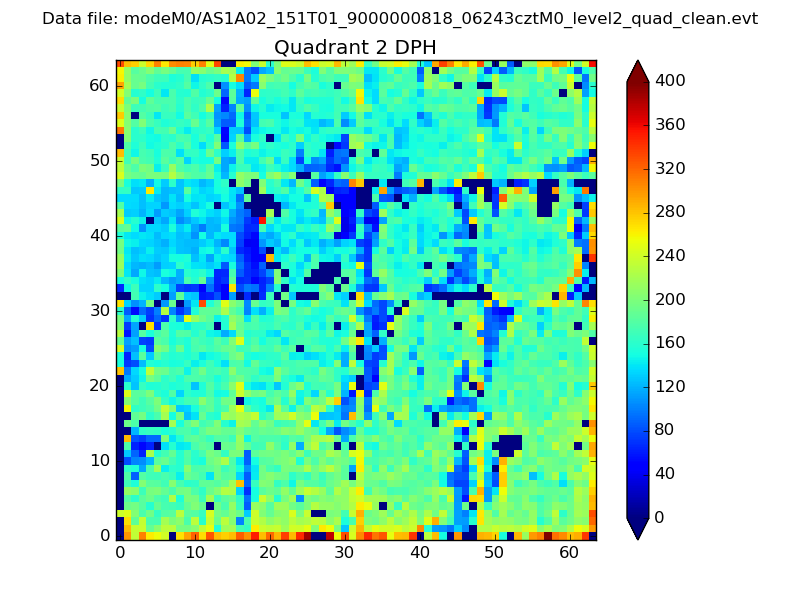
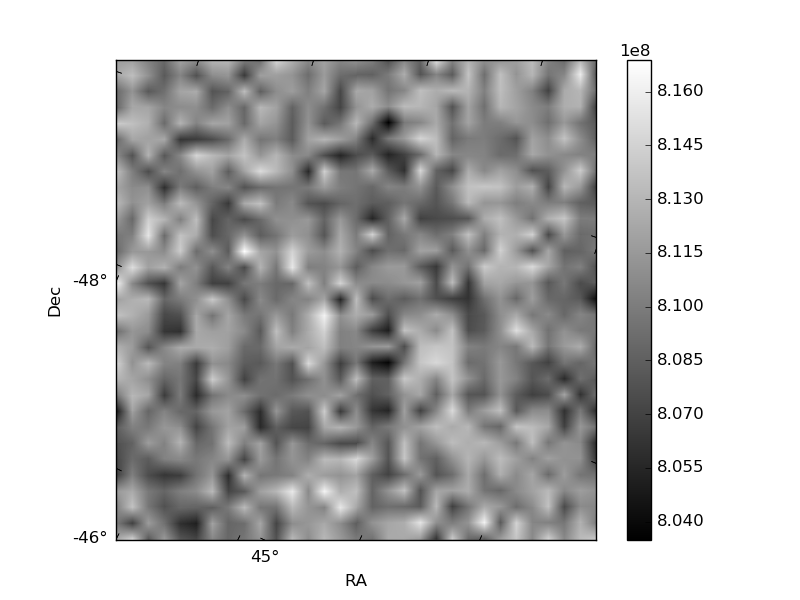
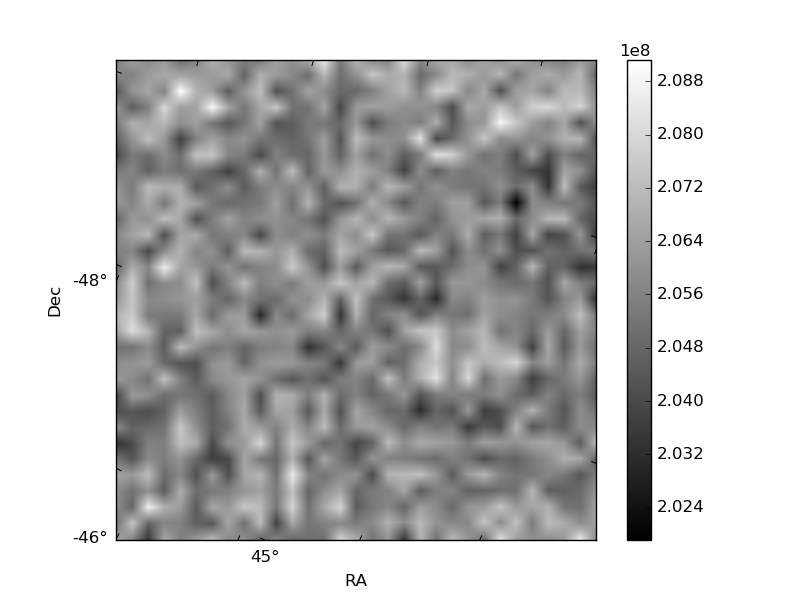
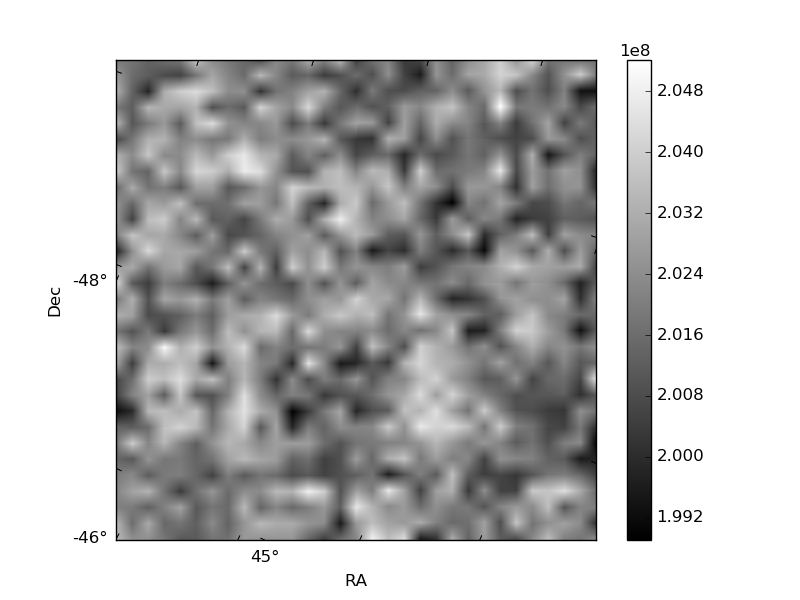
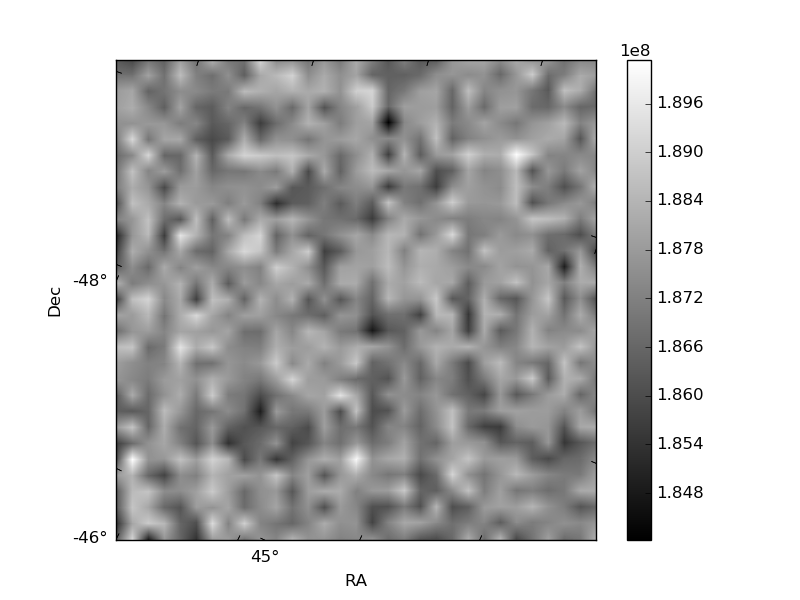
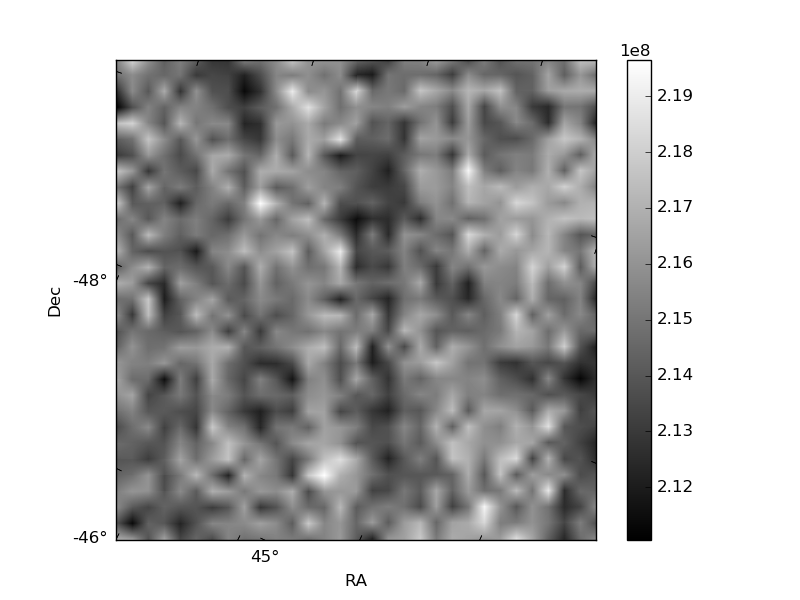
Histogram calculated using DETX and DETY for each event in the final _common_clean file
| Quadrant A | 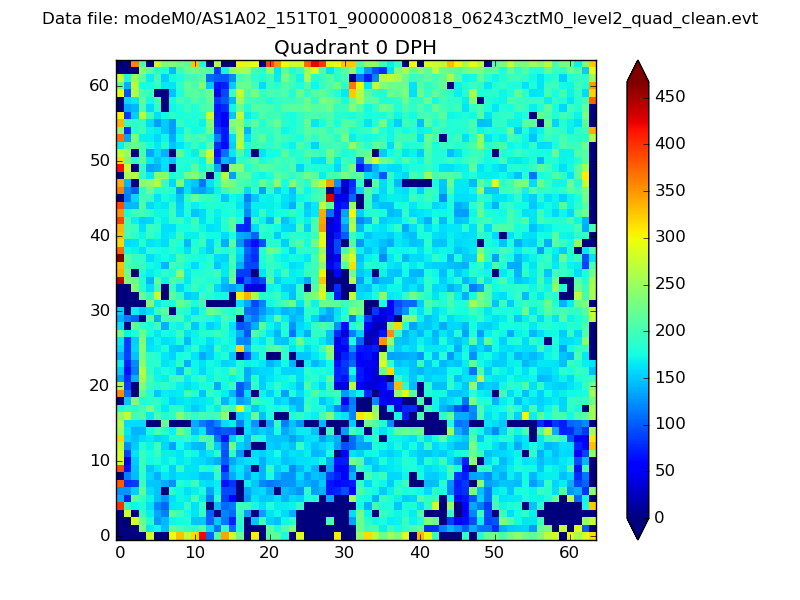 |
 |
Quadrant B |
|---|---|---|---|
| Quadrant D | 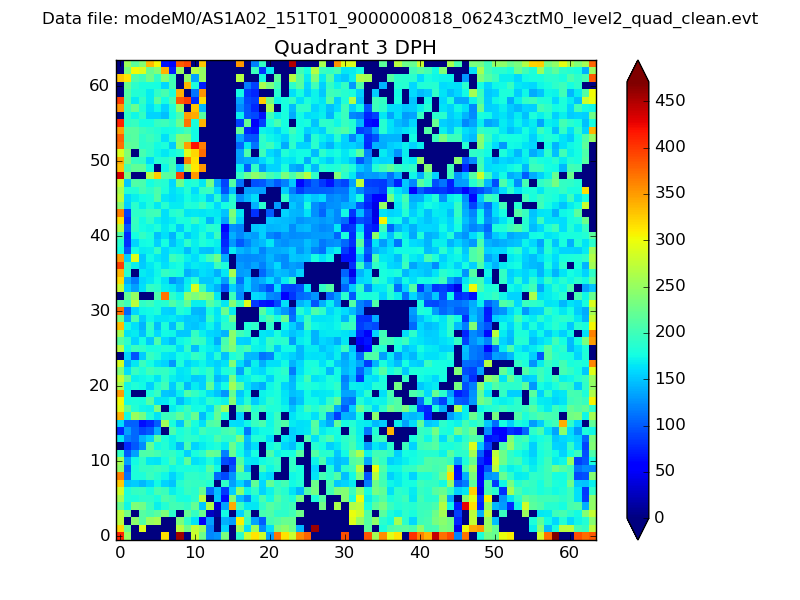 |
 |
Quadrant C |
| Plot type | Count rate plots | Images |
|---|---|---|
| Comparison with Poisson distribution Blue bars denote a histogram of data divided into 1 sec bins. Red curve is a Poisson curve with rate = median count rate of data. |
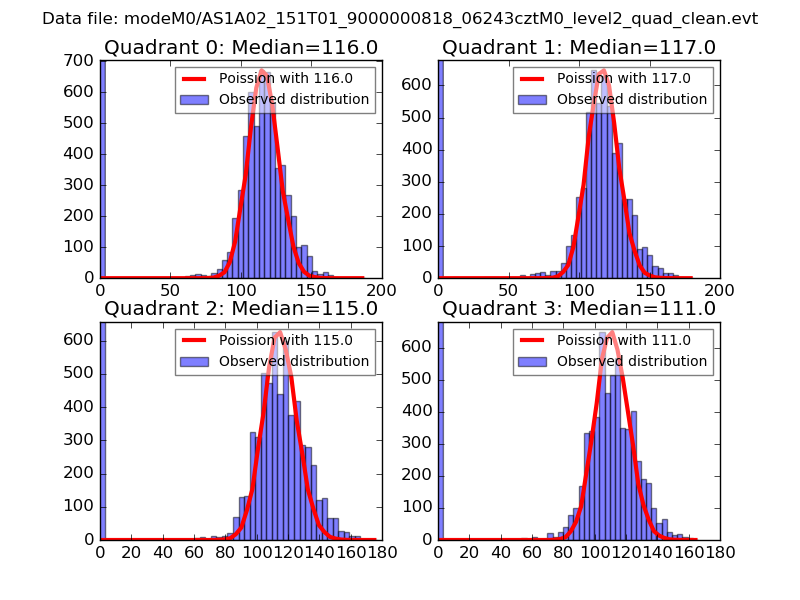 |
 |
| Quadrant-wise count rates Data is divided into 100 sec bins |
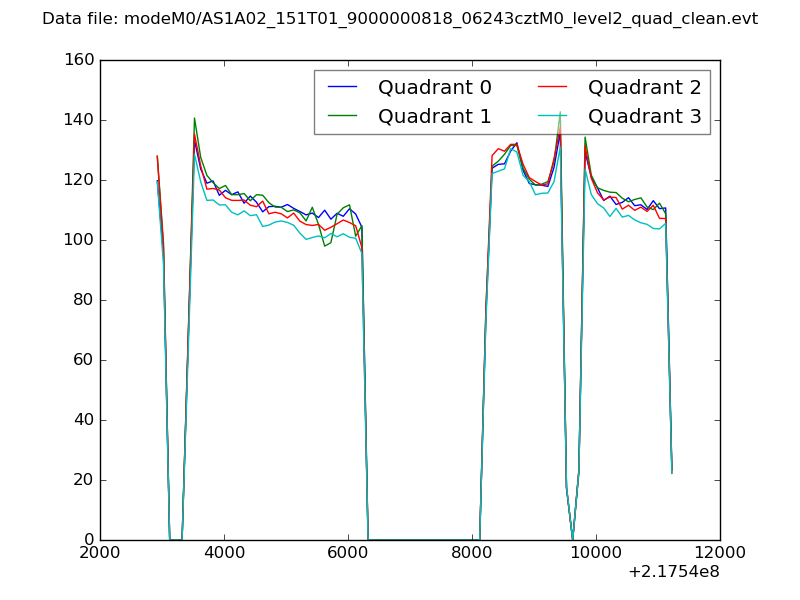 |
|
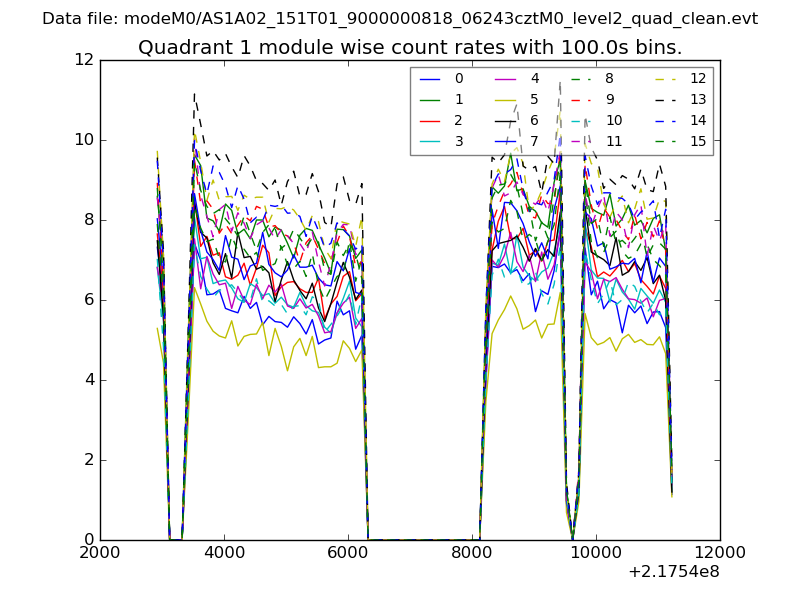
| Module-wise count rates for Quadrant A Data is divided into 100 sec bins |
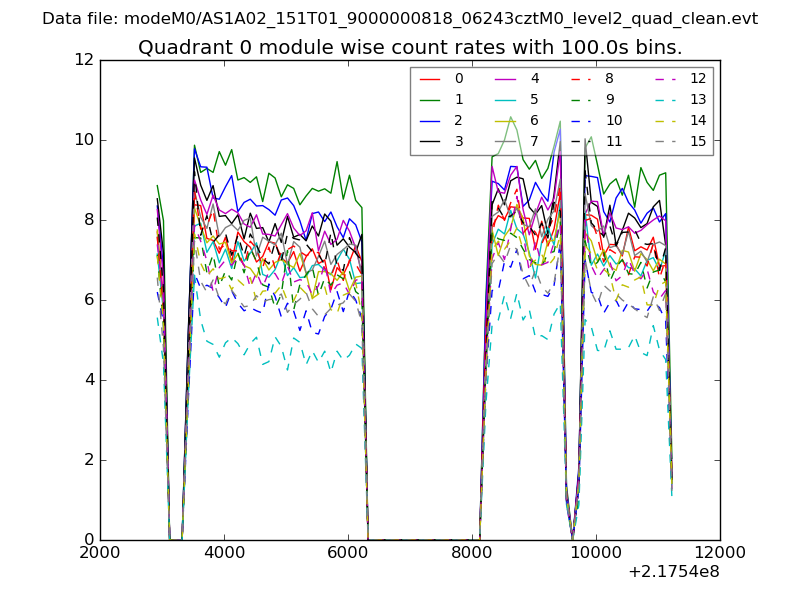 |
 |
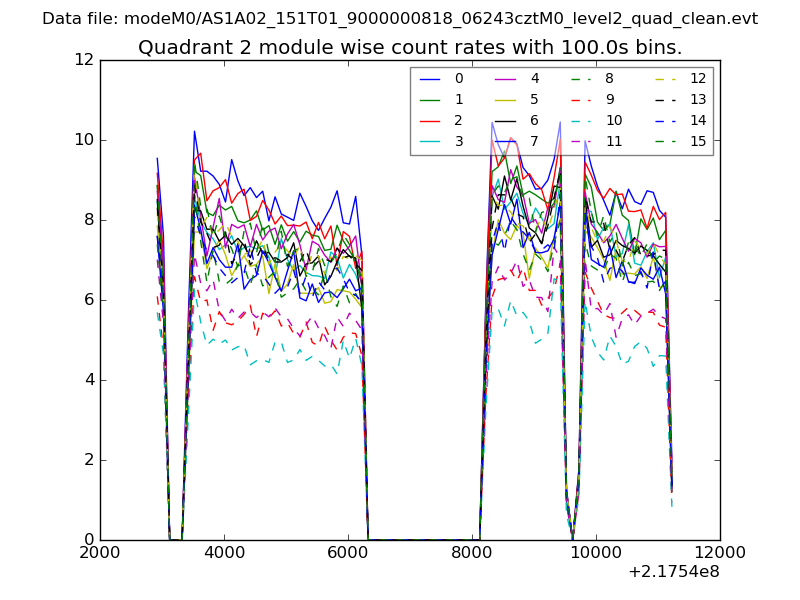
| Module-wise count rates for Quadrant B Data is divided into 100 sec bins |
 |
 |
| Module-wise count rates for Quadrant C Data is divided into 100 sec bins |
 |
 |
| Module-wise count rates for Quadrant D Data is divided into 100 sec bins |
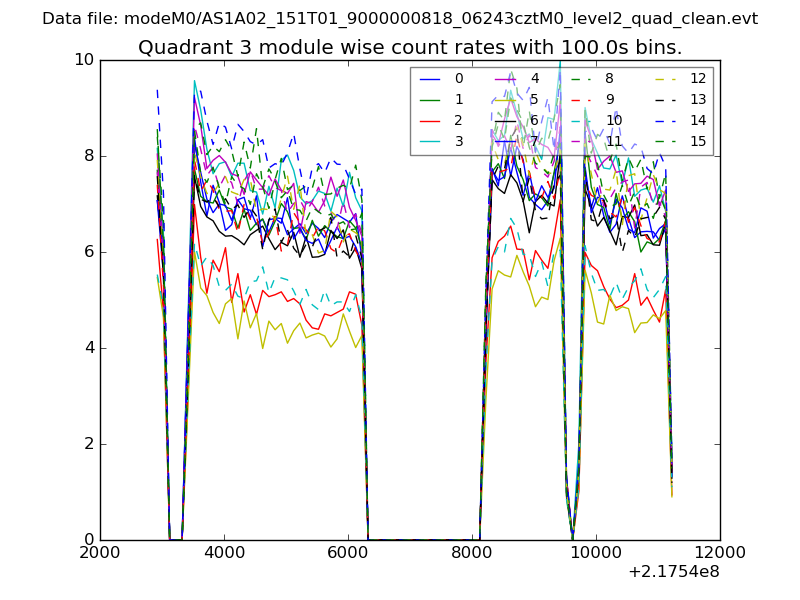 |
 |
| Parameter | Plot |
|---|---|
| CZT HV Monitor | 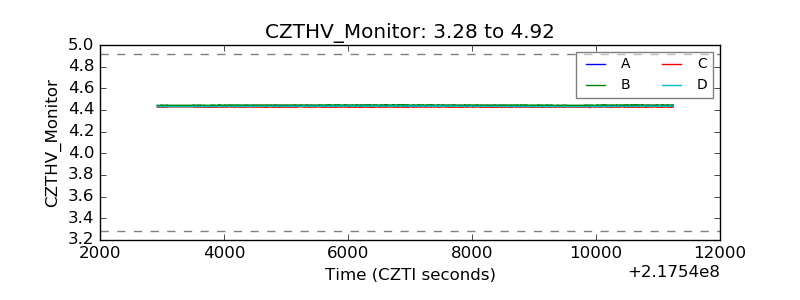 |
| D_VDD | 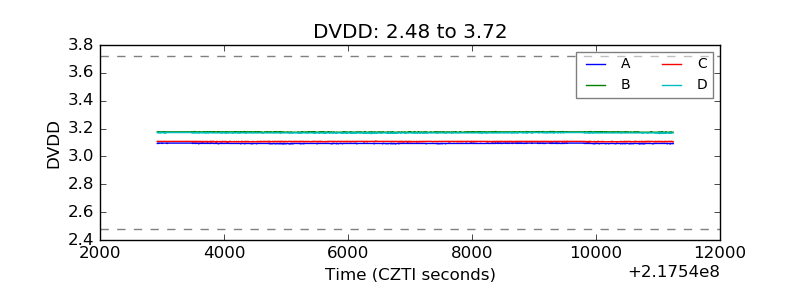 |
| Temperature 1 | 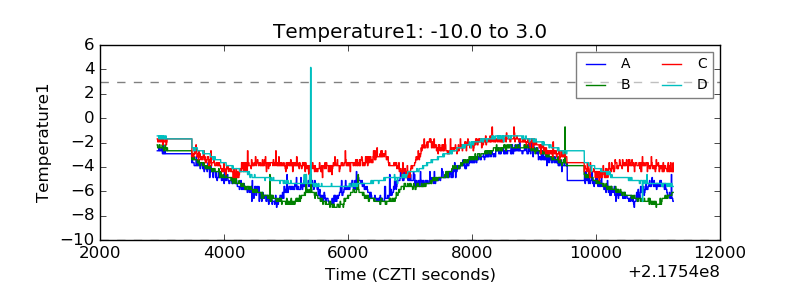 |
| Veto HV Monitor | 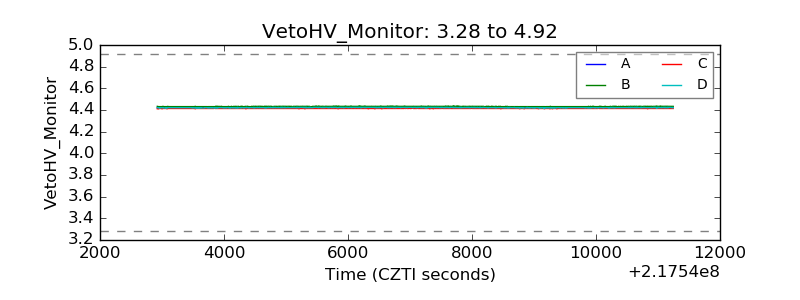 |
| Veto LLD | 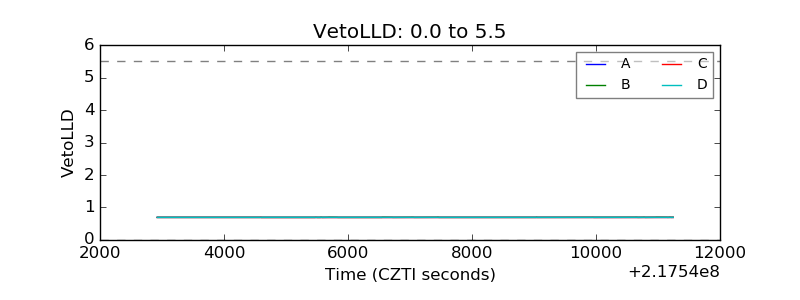 |
| Alpha Counter | 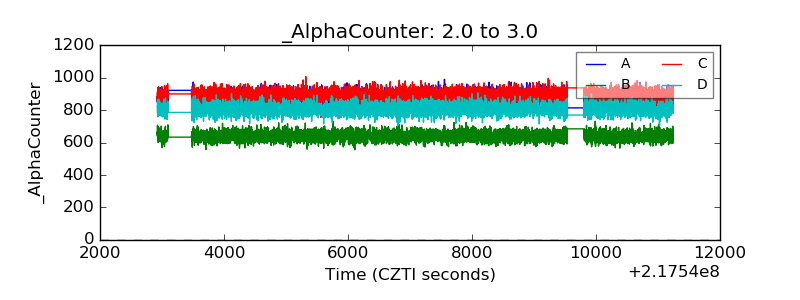 |
| _CPM_Rate | 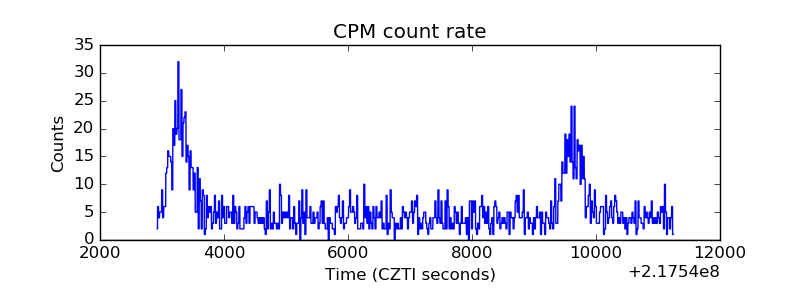 |
| CZT Counter | 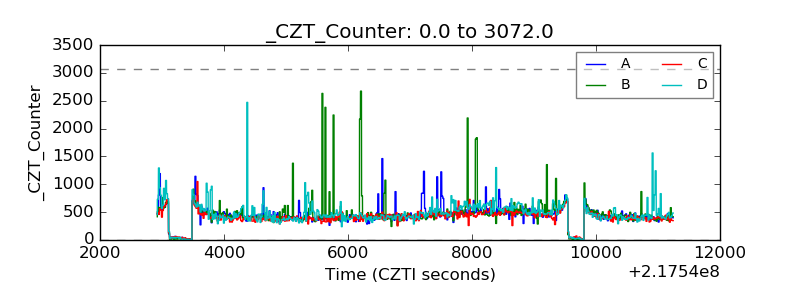 |
| +2.5 Volts monitor |  |
| +5 Volts monitor |  |
| _ROLL_ROT | 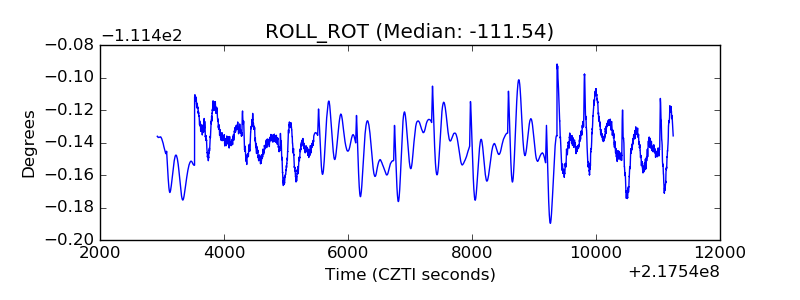 |
| _Roll_DEC | 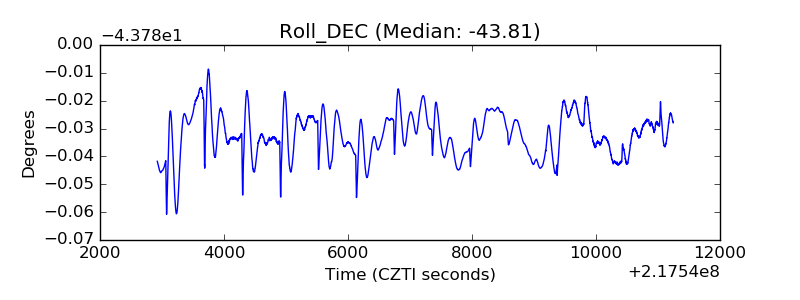 |
| _Roll_RA | 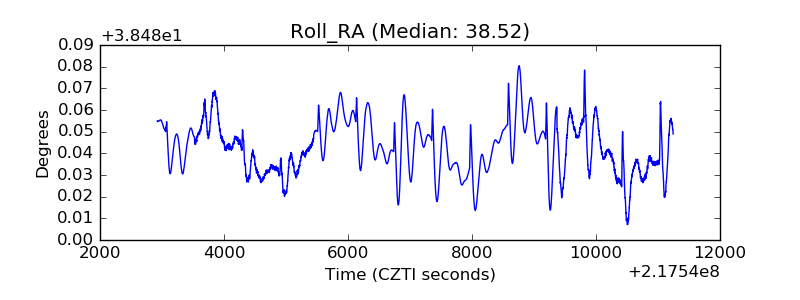 |
| Veto Counter | 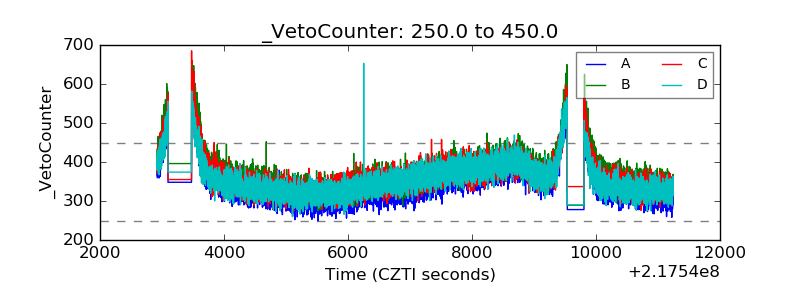 |