| Param | Original file | Final file |
|---|---|---|
| Filename | modeM0/AS1A02_151T01_9000000818_06246cztM0_level2.evt | modeM0/AS1A02_151T01_9000000818_06246cztM0_level2_quad_clean.evt |
| Size (bytes) | 1,206,420,480 | 245,203,200 |
| Size | 1.1 GB | 233.8 MB |
| Events in quadrant A | 8,883,712 | 1,547,366 |
| Events in quadrant B | 8,952,493 | 1,556,862 |
| Events in quadrant C | 8,124,865 | 1,531,727 |
| Events in quadrant D | 9,289,165 | 1,481,285 |
| Mode SS | |||
|---|---|---|---|
| Quadrant | BADHDUFLAG | Total packets | Discarded packets |
| A | 0 | 390 | 0 |
| B | 0 | 390 | 0 |
| C | 0 | 390 | 0 |
| D | 0 | 390 | 0 |
| Mode M9 | |||
|---|---|---|---|
| Quadrant | BADHDUFLAG | Total packets | Discarded packets |
| A | 0 | 23 | 0 |
| B | 0 | 23 | 0 |
| C | 0 | 23 | 0 |
| D | 0 | 23 | 0 |
| Mode M0 | |||
|---|---|---|---|
| Quadrant | BADHDUFLAG | Total packets | Discarded packets |
| A | 0 | 39390 | 5 |
| B | 0 | 39936 | 4 |
| C | 0 | 38466 | 4 |
| D | 0 | 41083 | 8 |
| Quadrant | Total seconds | Saturated seconds | Saturation percentage |
|---|---|---|---|
| A | 18997 | 162 | 0.852766% |
| B | 18997 | 266 | 1.400221% |
| C | 18997 | 77 | 0.405327% |
| D | 18996 | 119 | 0.626448% |
Noise dominated data is calculated using 1-second bins in cleaned event files. If a bin has >2000 counts, and if more than 50% of those come from <1% of pixels, then it is considered to be noise-dominated and hence unusable.
| Quadrant | # 1 sec bins | Bins with >0 counts | Bins with >2000 counts | High rate bins dominated by noise | Noise dominated (total time) | Noise dominated (detector-on time) | Marked lightcurve |
|---|---|---|---|---|---|---|---|
| A | 33882 | 19001 | 14 | 14 | 0.04% | 0.07% |  |
| B | 33882 | 19001 | 116 | 116 | 0.34% | 0.61% |  |
| C | 33882 | 19001 | 0 | 0 | 0.00% | 0.00% | 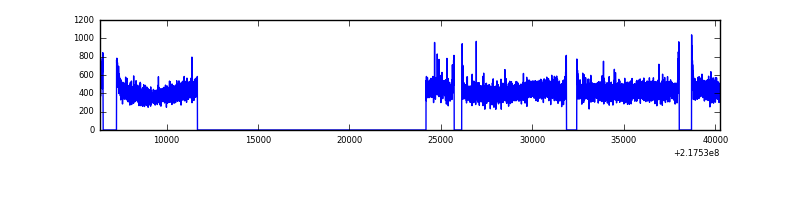 |
| D | 33882 | 19000 | 33 | 33 | 0.10% | 0.17% |  |
Top three noisy pixels from each quadrant. If the there are fewer than three noisy pixels in the level2.evt file, extra rows are filled as -1
| Pixel properties | Quadrant properties | ||||||
|---|---|---|---|---|---|---|---|
| Quadrant | DetID | PixID | Counts | Sigma | Mean | Median | Sigma |
| A | 15 | 236 | 517254 | 1187.83 | 2136 | 2089 | 433.7 |
| A | 4 | 2 | 63945 | 142.62 | 2136 | 2089 | 433.7 |
| A | 14 | 111 | 35643 | 77.37 | 2136 | 2089 | 433.7 |
| B | 0 | 219 | 375763 | 908.5 | 2157 | 2099 | 411.3 |
| B | 3 | 64 | 109227 | 260.46 | 2157 | 2099 | 411.3 |
| B | 15 | 204 | 53946 | 126.06 | 2157 | 2099 | 411.3 |
| C | 13 | 61 | 16435 | 29.9 | 2081 | 2086 | 480.0 |
| C | 8 | 222 | 8209 | 12.76 | 2081 | 2086 | 480.0 |
| C | 3 | 202 | 5173 | 6.43 | 2081 | 2086 | 480.0 |
| D | 2 | 63 | 682605 | 1338.02 | 2078 | 2012 | 508.7 |
| D | 2 | 152 | 312778 | 610.95 | 2078 | 2012 | 508.7 |
| D | 2 | 136 | 170455 | 331.15 | 2078 | 2012 | 508.7 |
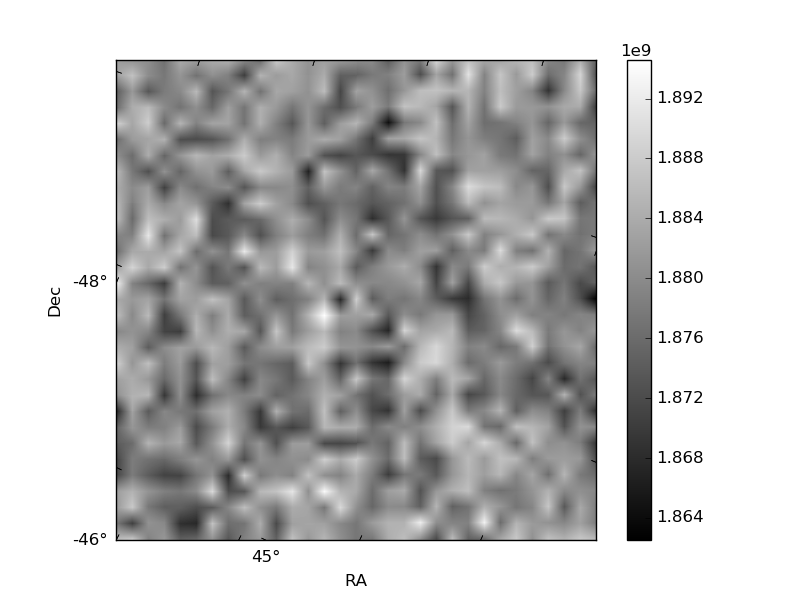
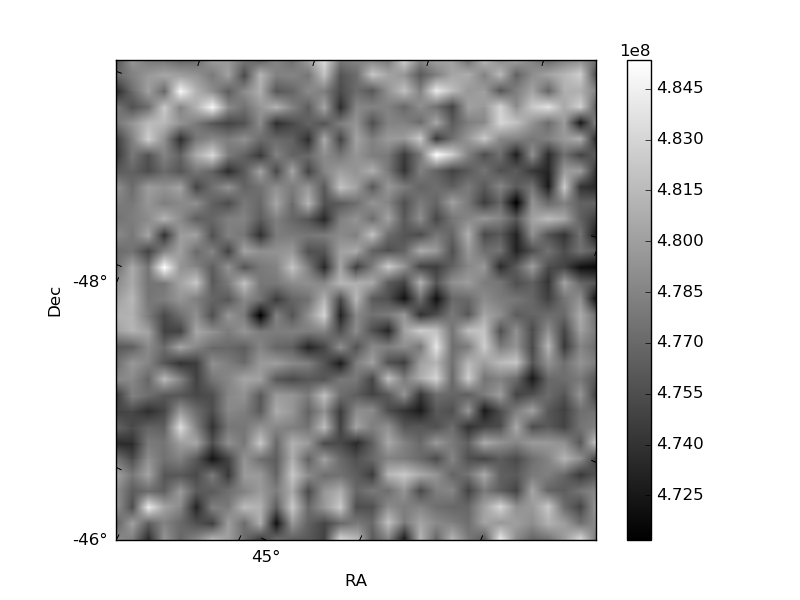
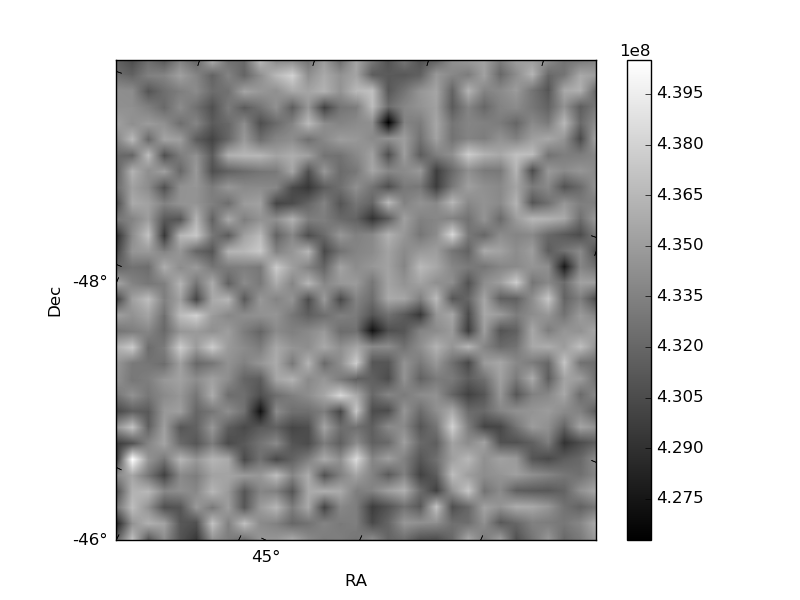
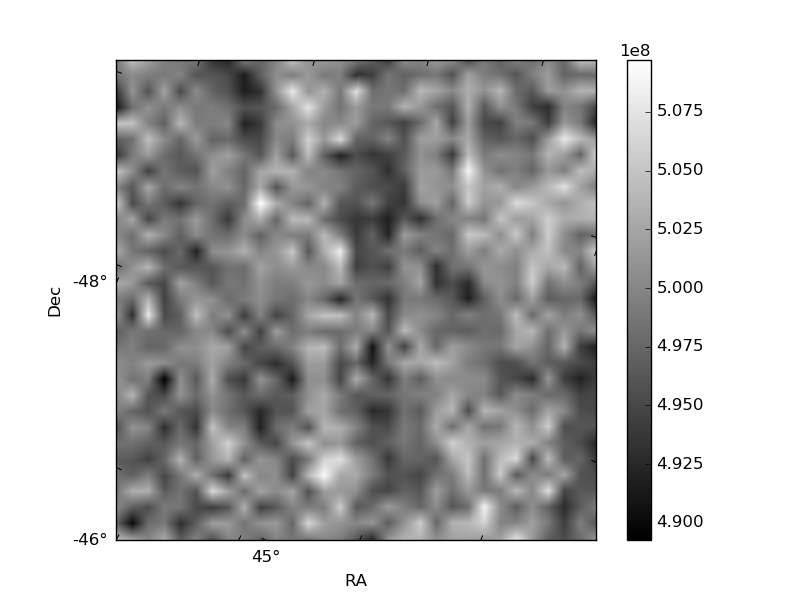
Histogram calculated using DETX and DETY for each event in the final _common_clean file
| Quadrant A | 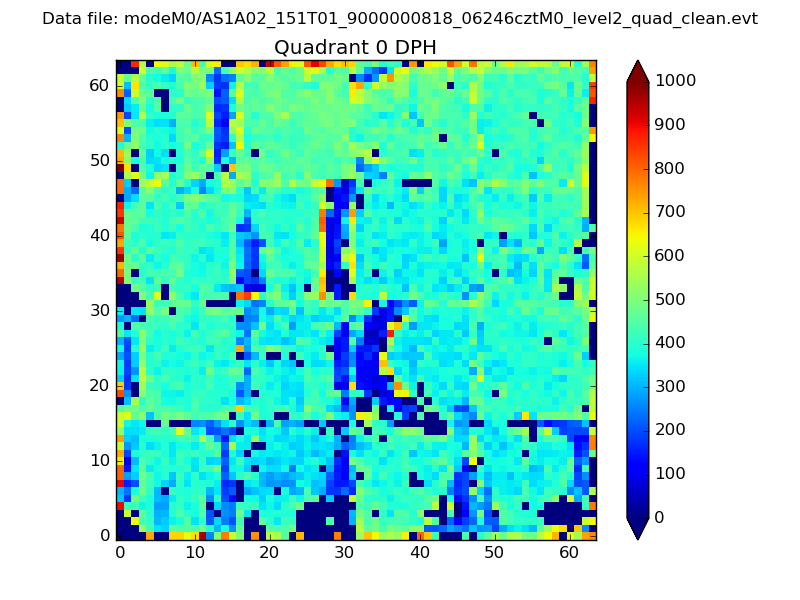 |
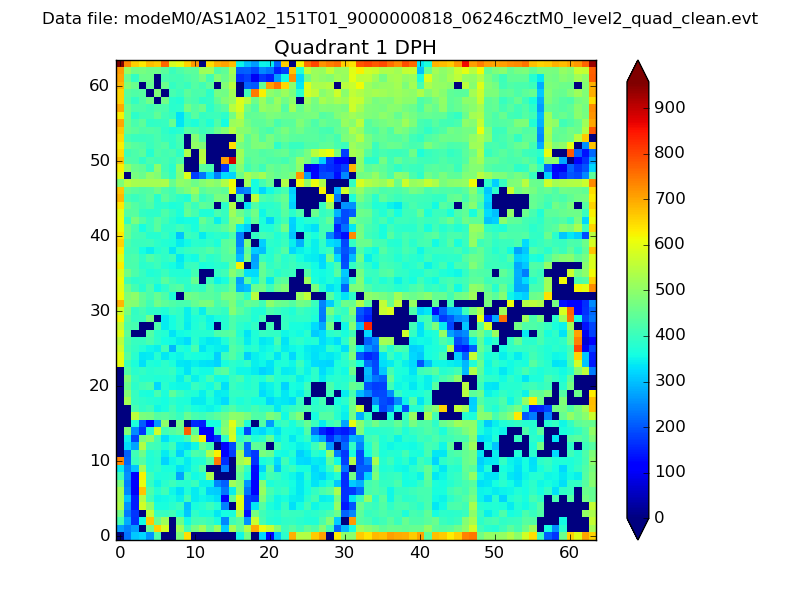 |
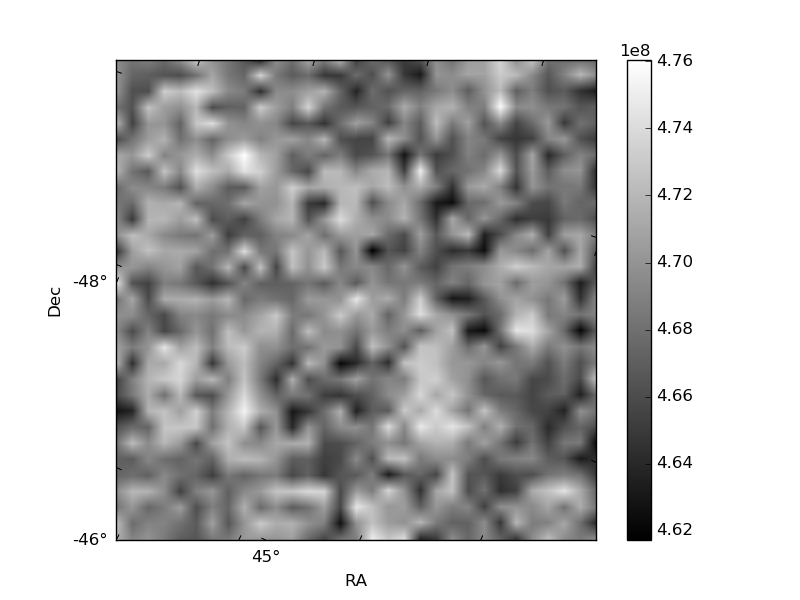
Quadrant B |
|---|---|---|---|
| Quadrant D |  |
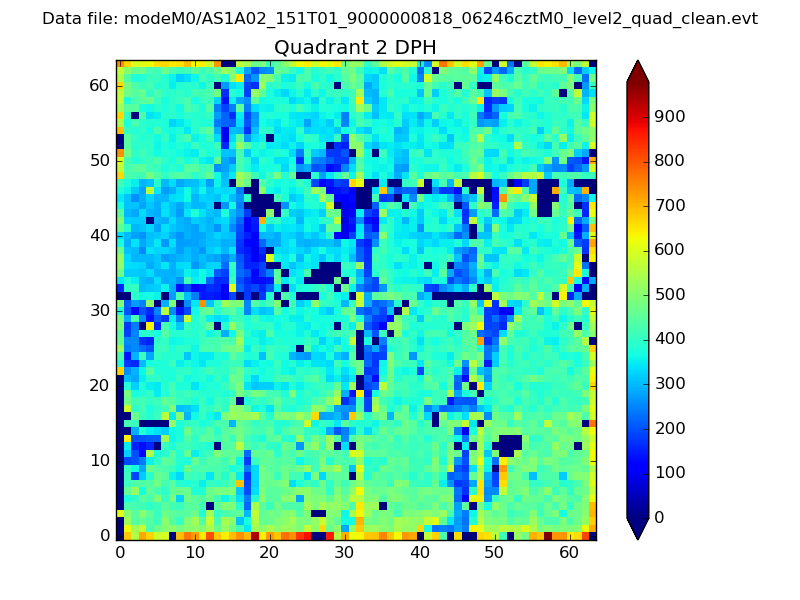 |
Quadrant C |
| Plot type | Count rate plots | Images |
|---|---|---|
| Comparison with Poisson distribution Blue bars denote a histogram of data divided into 1 sec bins. Red curve is a Poisson curve with rate = median count rate of data. |
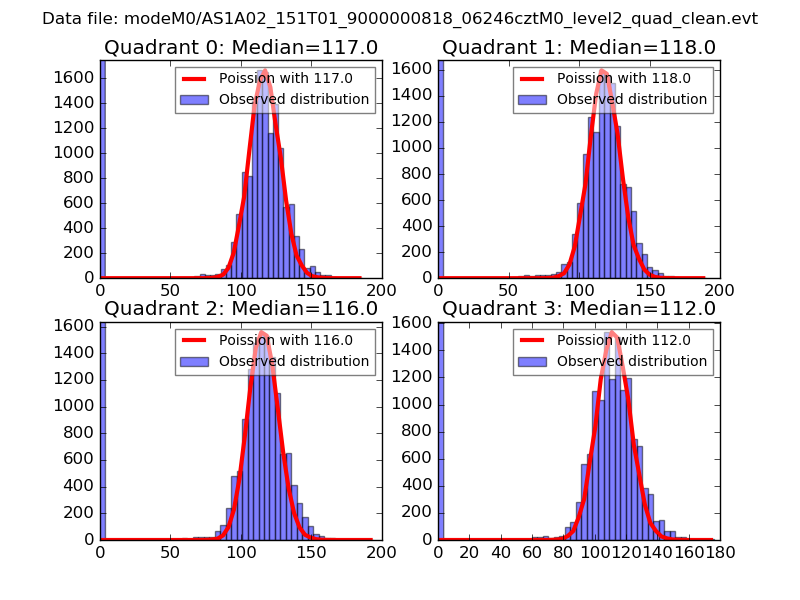 |
 |
| Quadrant-wise count rates Data is divided into 100 sec bins |
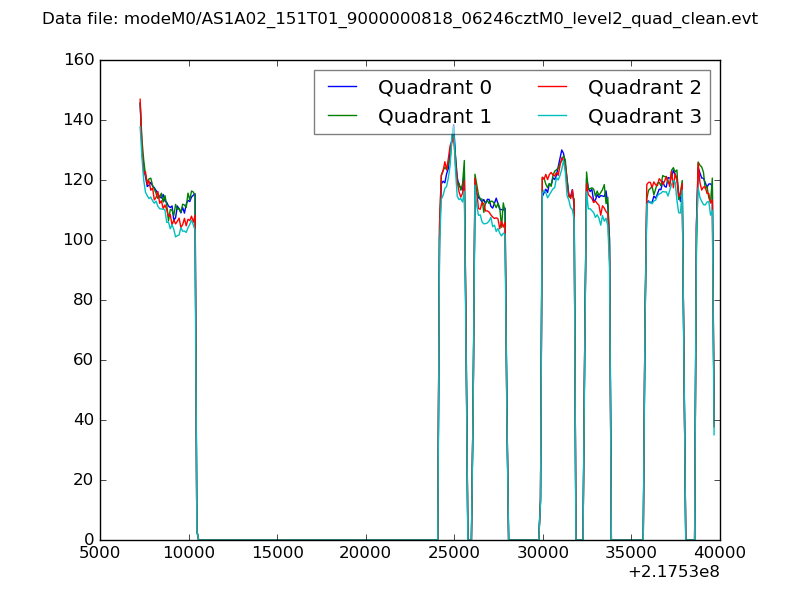 |
|
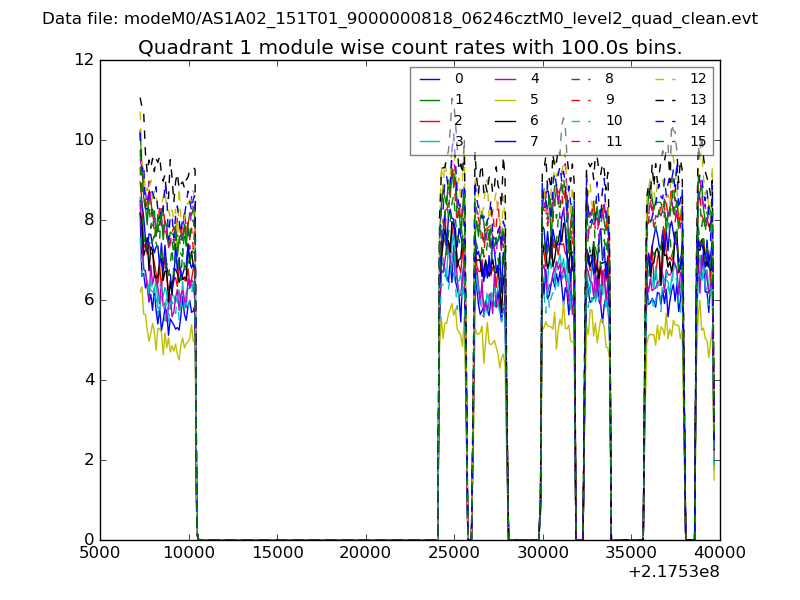
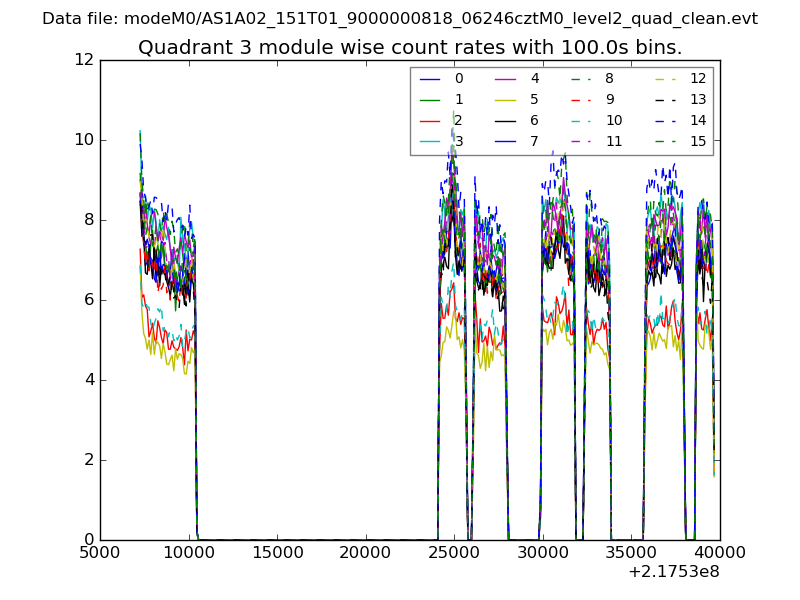
| Module-wise count rates for Quadrant A Data is divided into 100 sec bins |
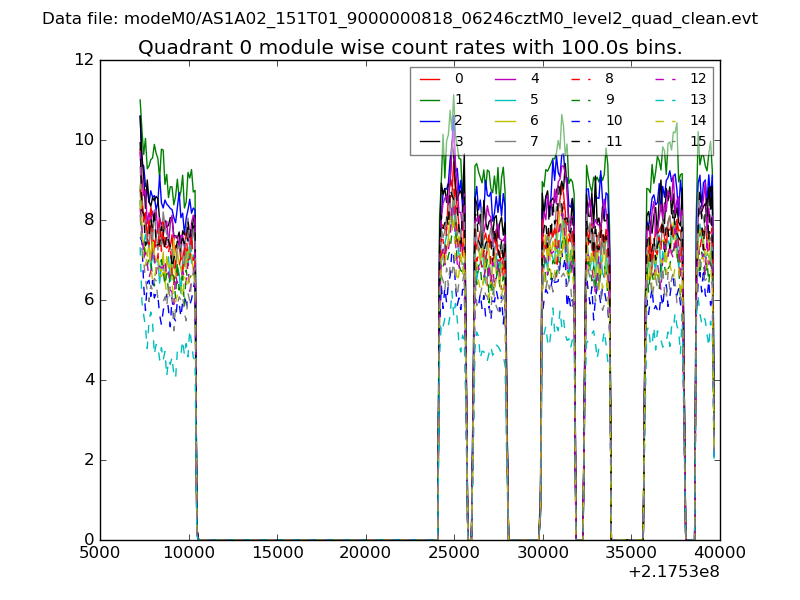 |
 |
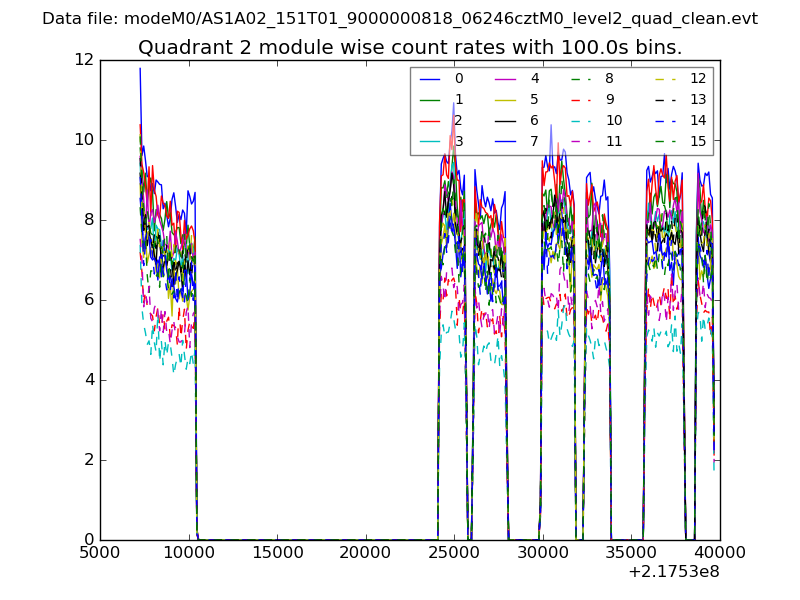
| Module-wise count rates for Quadrant B Data is divided into 100 sec bins |
 |
 |
| Module-wise count rates for Quadrant C Data is divided into 100 sec bins |
 |
 |
| Module-wise count rates for Quadrant D Data is divided into 100 sec bins |
 |
 |
| Parameter | Plot |
|---|---|
| CZT HV Monitor | 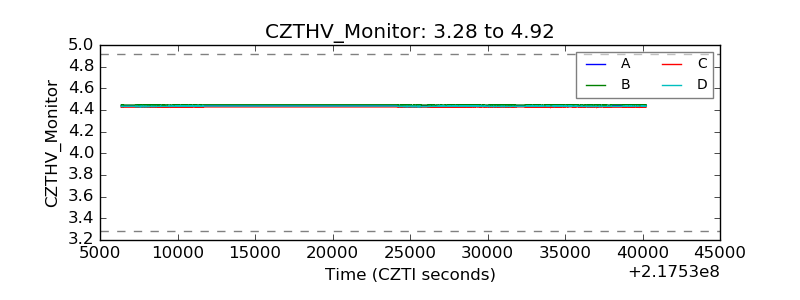 |
| D_VDD | 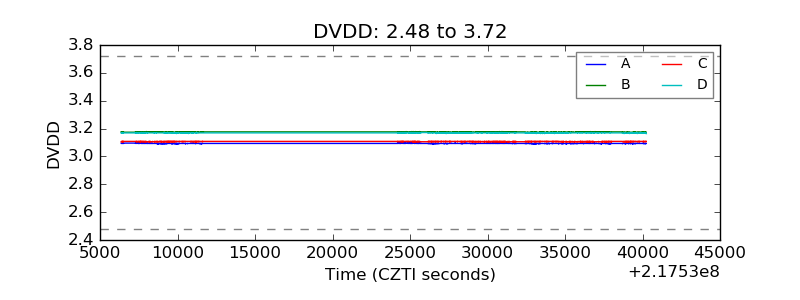 |
| Temperature 1 | 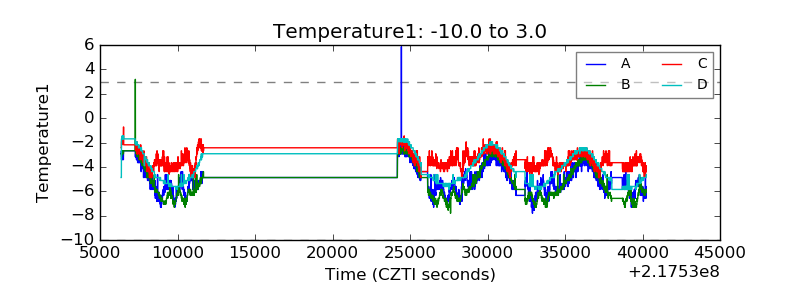 |
| Veto HV Monitor | 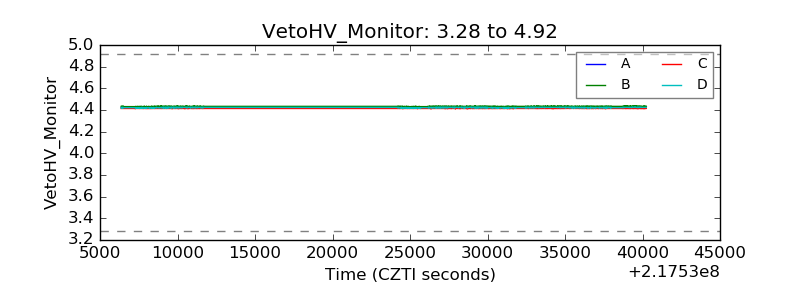 |
| Veto LLD | 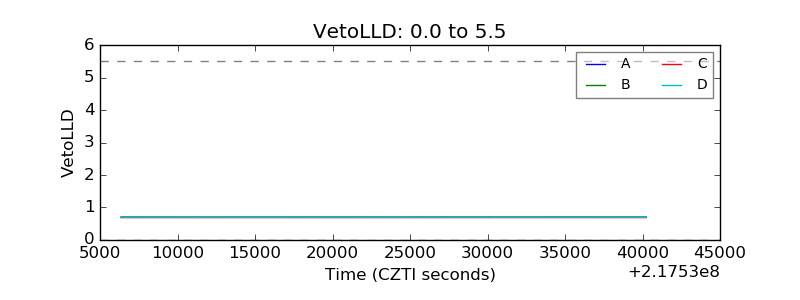 |
| Alpha Counter | 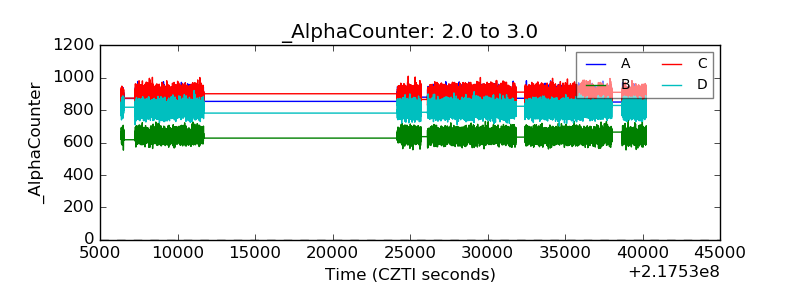 |
| _CPM_Rate | 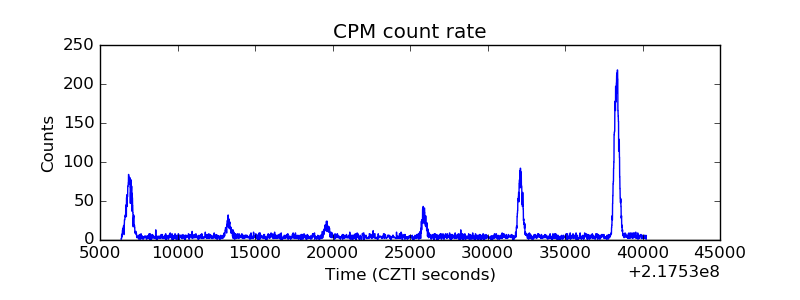 |
| CZT Counter | 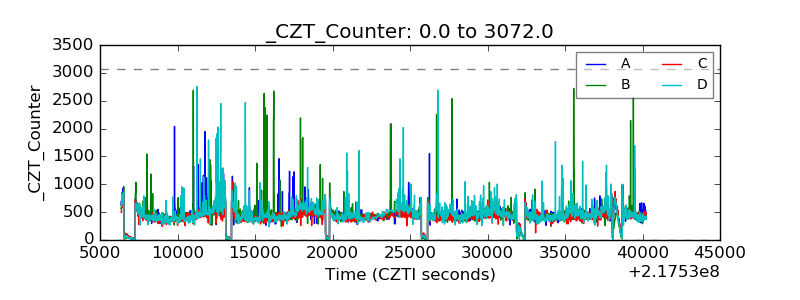 |
| +2.5 Volts monitor | 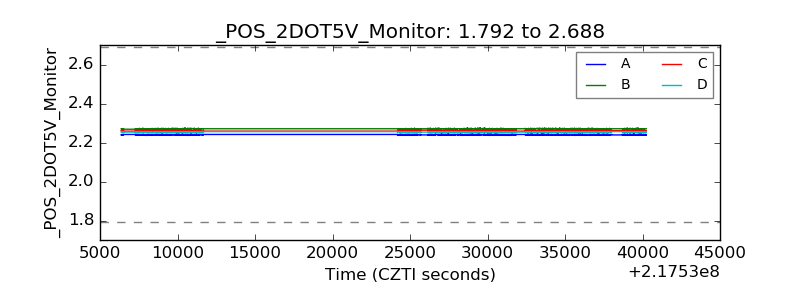 |
| +5 Volts monitor |  |
| _ROLL_ROT | 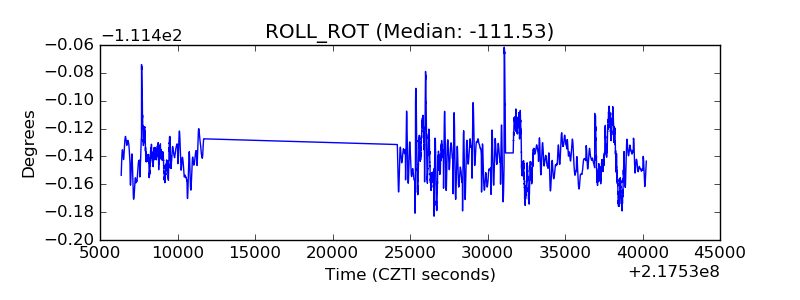 |
| _Roll_DEC | 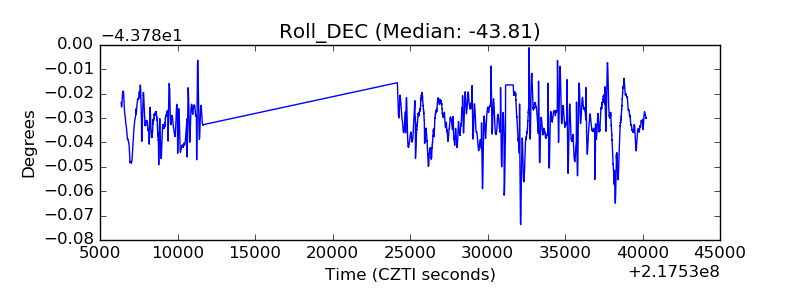 |
| _Roll_RA | 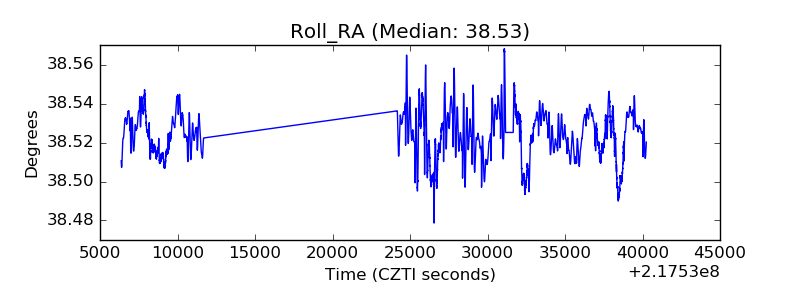 |
| Veto Counter | 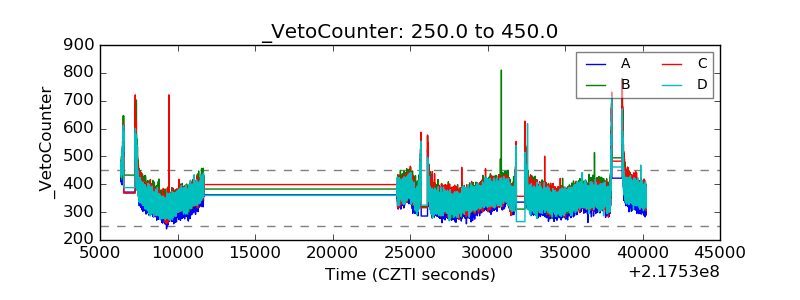 |