| Param | Original file | Final file |
|---|---|---|
| Filename | modeM0/AS1A02_151T01_9000000818_06247cztM0_level2.evt | modeM0/AS1A02_151T01_9000000818_06247cztM0_level2_quad_clean.evt |
| Size (bytes) | 495,478,080 | 89,256,960 |
| Size | 472.5 MB | 85.1 MB |
| Events in quadrant A | 3,718,789 | 549,541 |
| Events in quadrant B | 3,682,243 | 549,890 |
| Events in quadrant C | 3,314,581 | 549,768 |
| Events in quadrant D | 3,780,099 | 531,721 |
| Mode SS | |||
|---|---|---|---|
| Quadrant | BADHDUFLAG | Total packets | Discarded packets |
| A | 0 | 154 | 0 |
| B | 0 | 154 | 0 |
| C | 0 | 154 | 0 |
| D | 0 | 154 | 0 |
| Mode M9 | |||
|---|---|---|---|
| Quadrant | BADHDUFLAG | Total packets | Discarded packets |
| A | 0 | 15 | 0 |
| B | 0 | 15 | 0 |
| C | 0 | 15 | 0 |
| D | 0 | 15 | 0 |
| Mode M0 | |||
|---|---|---|---|
| Quadrant | BADHDUFLAG | Total packets | Discarded packets |
| A | 0 | 16197 | 3 |
| B | 0 | 16124 | 2 |
| C | 0 | 15300 | 2 |
| D | 0 | 16367 | 2 |
| Quadrant | Total seconds | Saturated seconds | Saturation percentage |
|---|---|---|---|
| A | 7501 | 118 | 1.573124% |
| B | 7501 | 223 | 2.972937% |
| C | 7501 | 99 | 1.319824% |
| D | 7501 | 114 | 1.519797% |
Noise dominated data is calculated using 1-second bins in cleaned event files. If a bin has >2000 counts, and if more than 50% of those come from <1% of pixels, then it is considered to be noise-dominated and hence unusable.
| Quadrant | # 1 sec bins | Bins with >0 counts | Bins with >2000 counts | High rate bins dominated by noise | Noise dominated (total time) | Noise dominated (detector-on time) | Marked lightcurve |
|---|---|---|---|---|---|---|---|
| A | 9021 | 7501 | 1 | 1 | 0.01% | 0.01% | 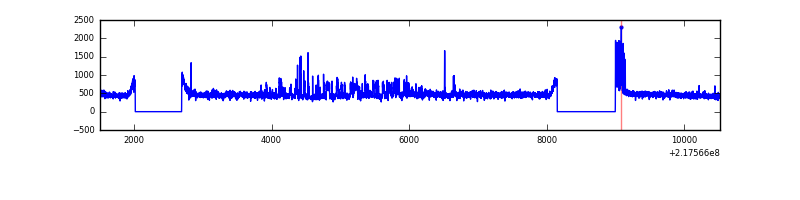 |
| B | 9021 | 7501 | 74 | 74 | 0.82% | 0.99% | 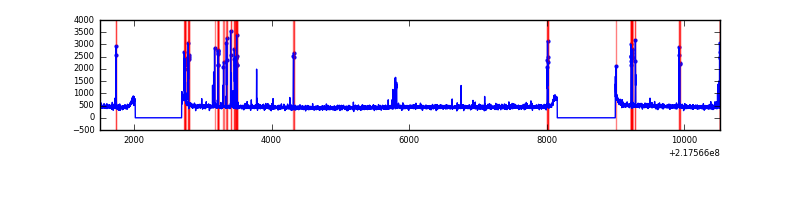 |
| C | 9021 | 7501 | 0 | 0 | 0.00% | 0.00% | 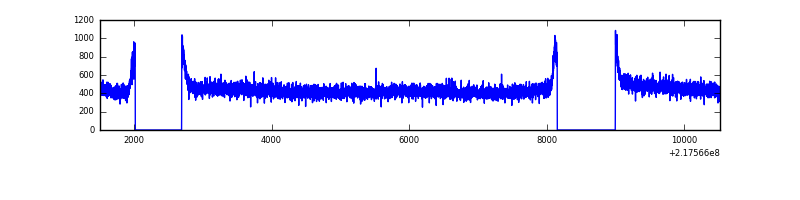 |
| D | 9021 | 7501 | 12 | 12 | 0.13% | 0.16% | 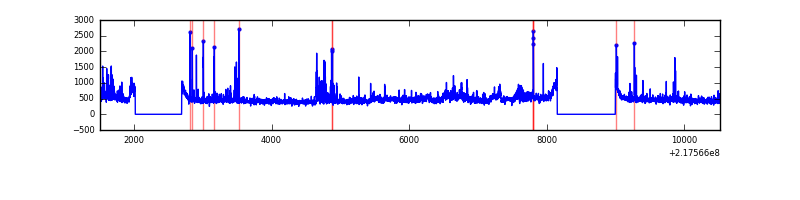 |
Top three noisy pixels from each quadrant. If the there are fewer than three noisy pixels in the level2.evt file, extra rows are filled as -1
| Pixel properties | Quadrant properties | ||||||
|---|---|---|---|---|---|---|---|
| Quadrant | DetID | PixID | Counts | Sigma | Mean | Median | Sigma |
| A | 15 | 236 | 384322 | 2181.05 | 861 | 840 | 175.8 |
| A | 12 | 194 | 8153 | 41.59 | 861 | 840 | 175.8 |
| A | 0 | 226 | 8112 | 41.36 | 861 | 840 | 175.8 |
| B | 0 | 219 | 271178 | 1631.64 | 866 | 846 | 165.7 |
| B | 12 | 111 | 17528 | 100.69 | 866 | 846 | 165.7 |
| B | 4 | 81 | 16985 | 97.41 | 866 | 846 | 165.7 |
| C | 13 | 61 | 6633 | 29.52 | 848 | 850 | 195.9 |
| C | 8 | 222 | 4090 | 16.54 | 848 | 850 | 195.9 |
| C | 3 | 202 | 2096 | 6.36 | 848 | 850 | 195.9 |
| D | 2 | 63 | 205729 | 991.24 | 843 | 814 | 206.7 |
| D | 2 | 136 | 172162 | 828.87 | 843 | 814 | 206.7 |
| D | 2 | 152 | 113438 | 544.8 | 843 | 814 | 206.7 |
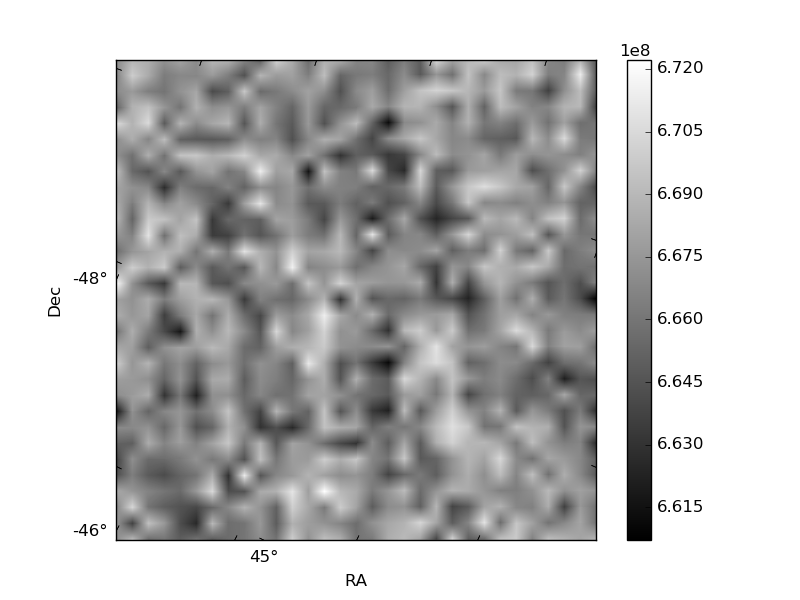
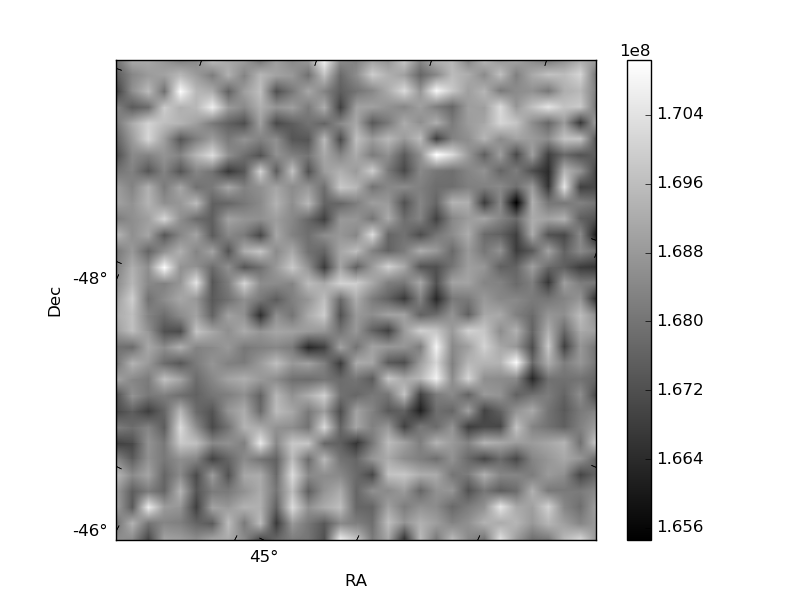
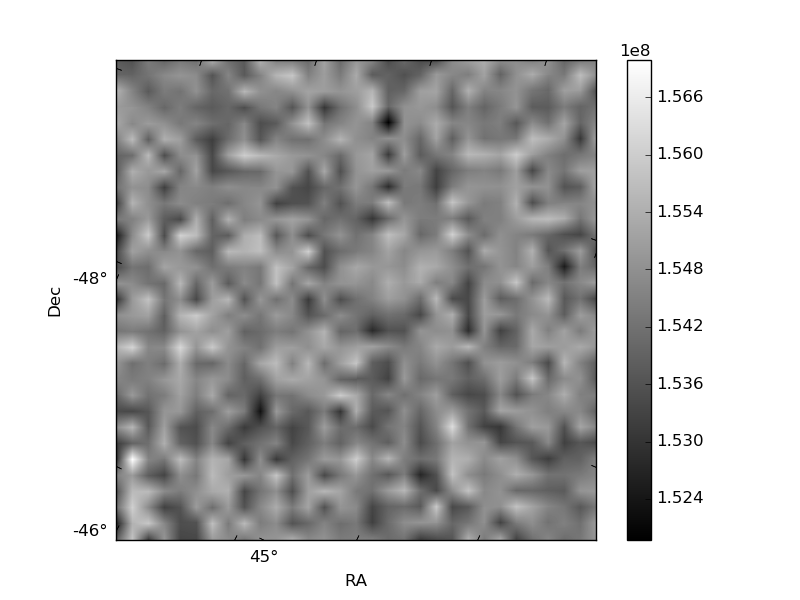
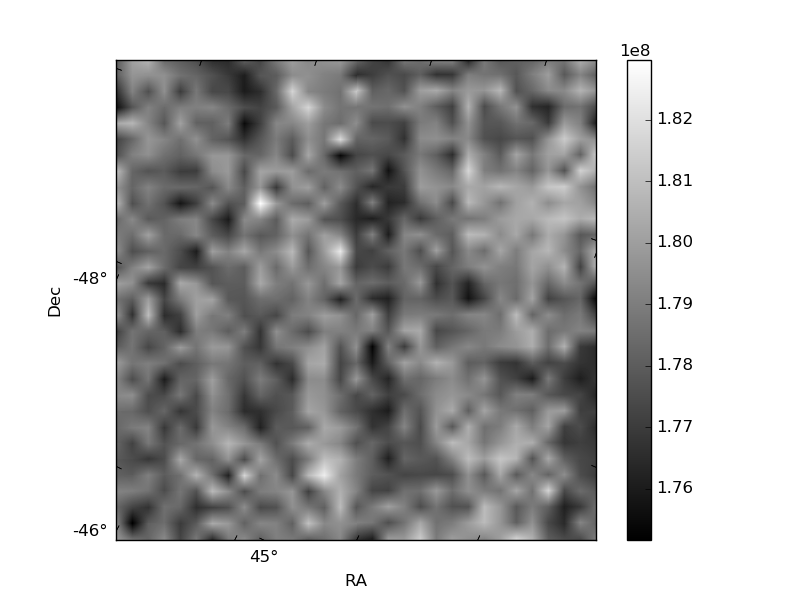
Histogram calculated using DETX and DETY for each event in the final _common_clean file
| Quadrant A | 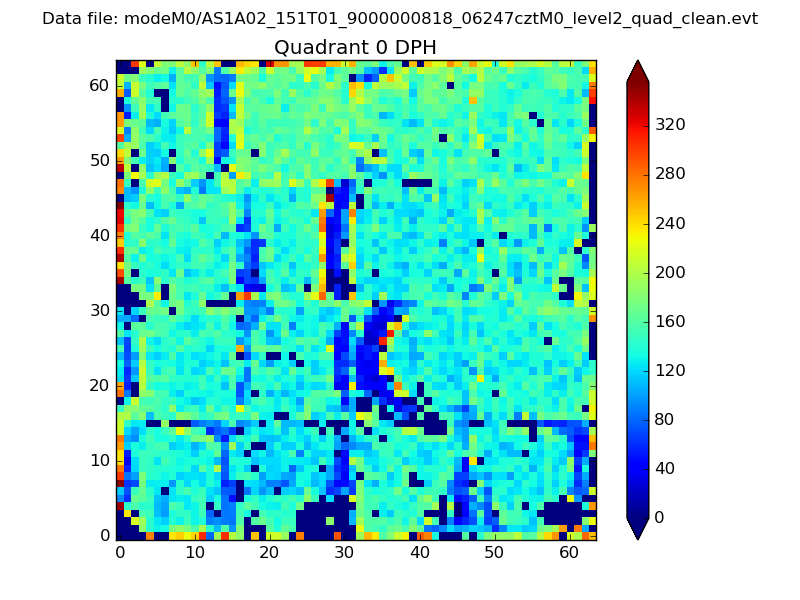 |
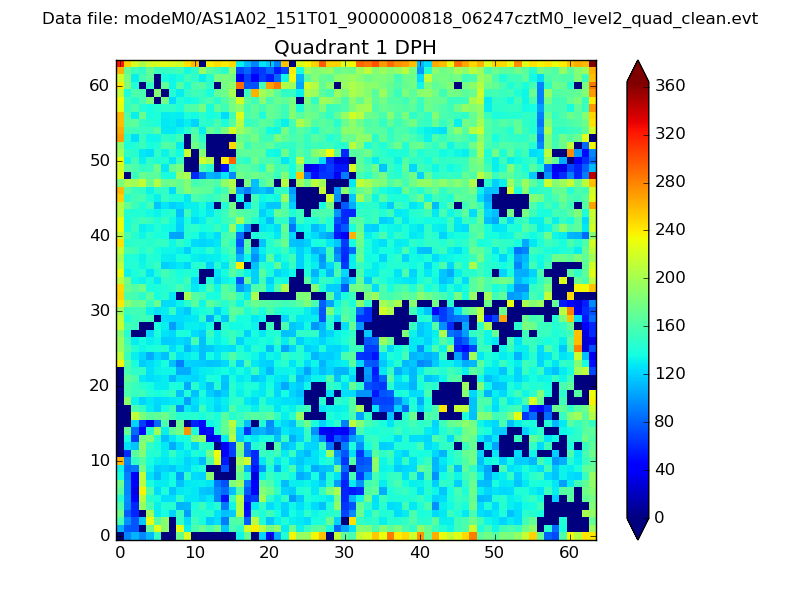 |
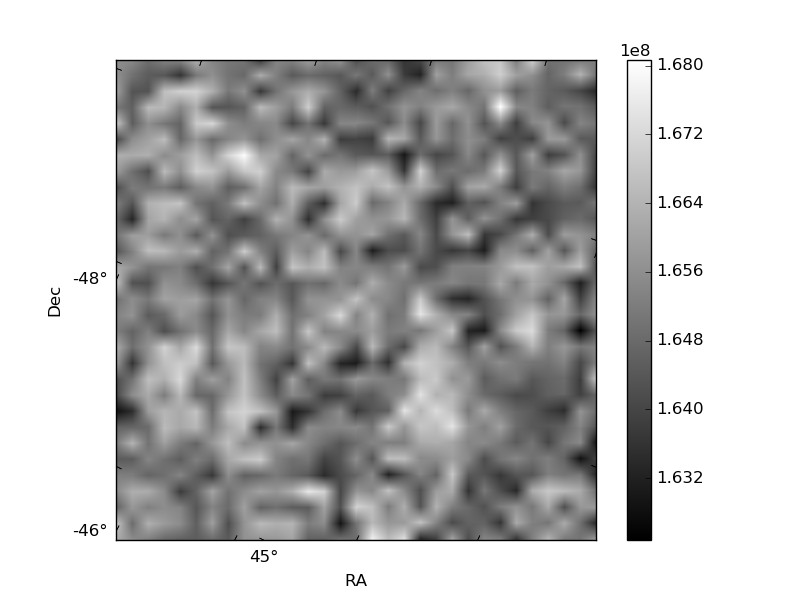
Quadrant B |
|---|---|---|---|
| Quadrant D | 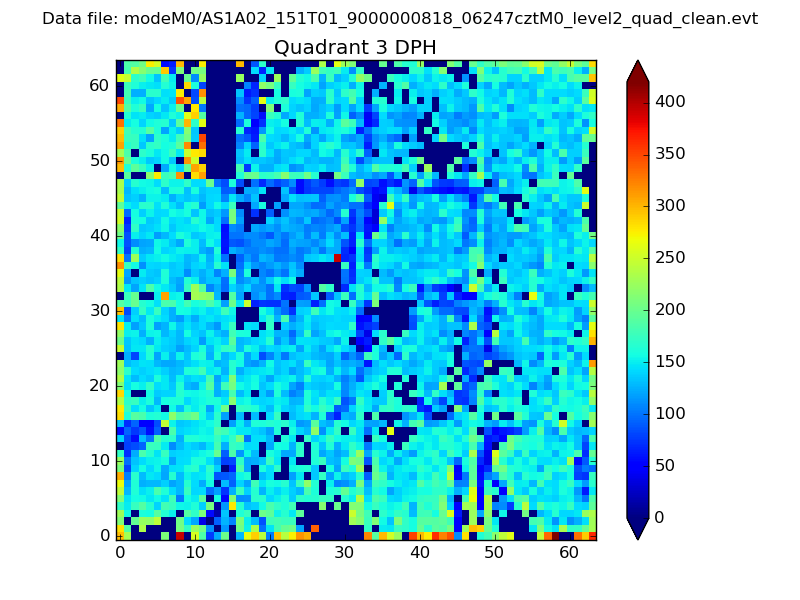 |
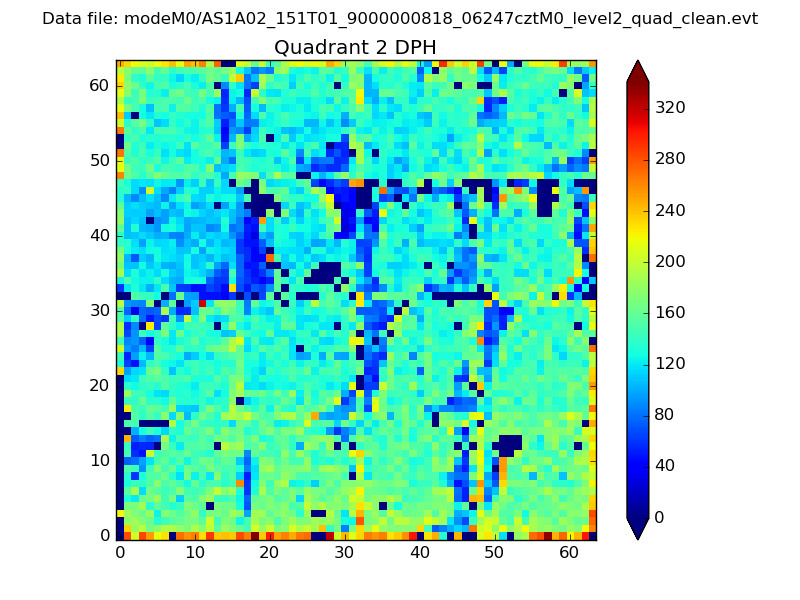 |
Quadrant C |
| Plot type | Count rate plots | Images |
|---|---|---|
| Comparison with Poisson distribution Blue bars denote a histogram of data divided into 1 sec bins. Red curve is a Poisson curve with rate = median count rate of data. |
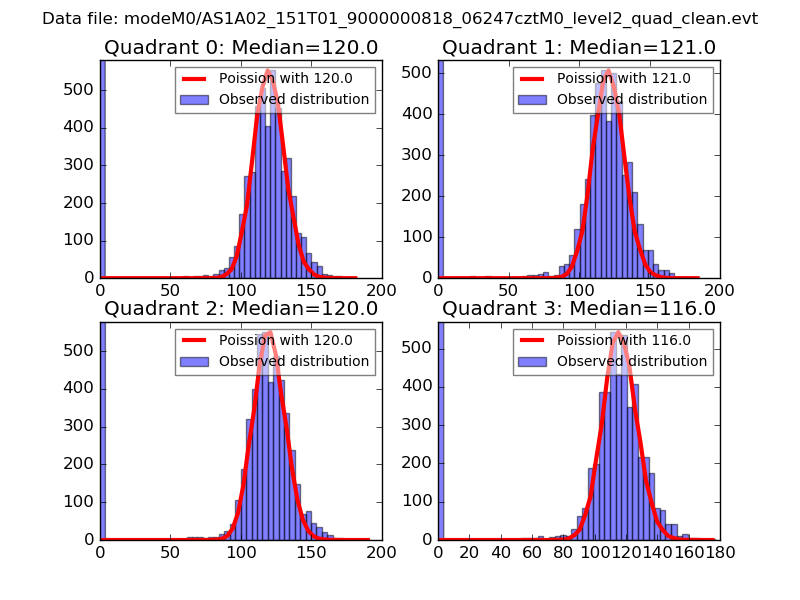 |
 |
| Quadrant-wise count rates Data is divided into 100 sec bins |
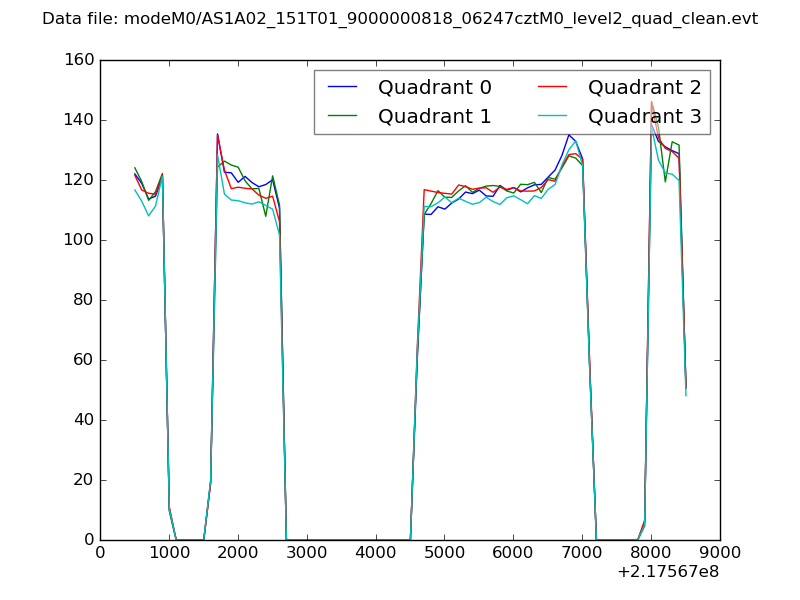 |
|
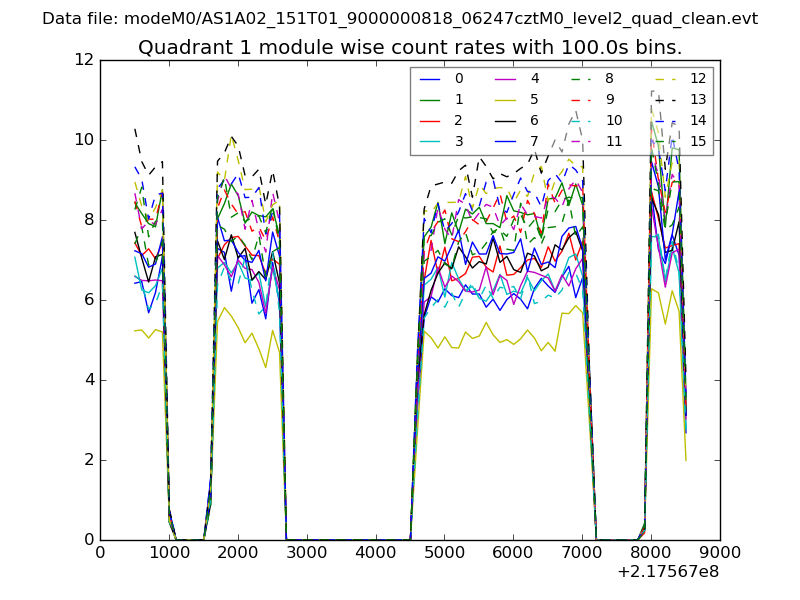
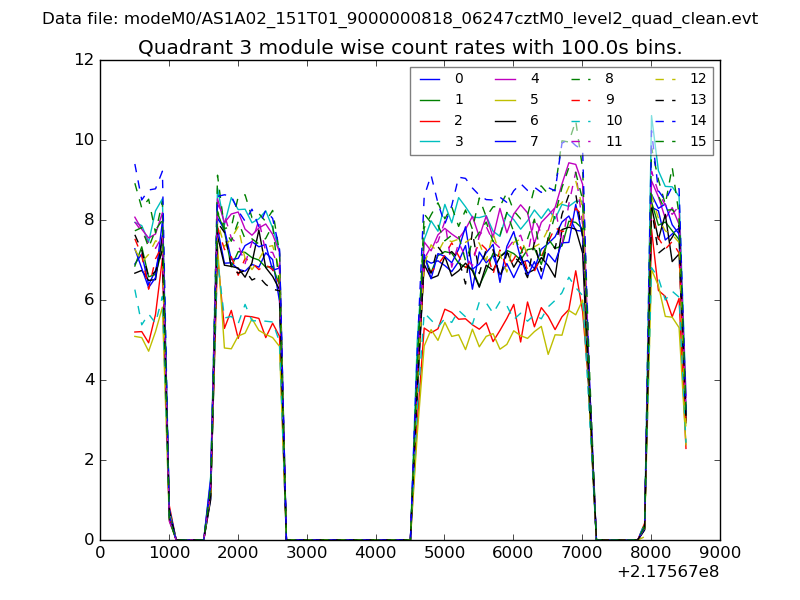
| Module-wise count rates for Quadrant A Data is divided into 100 sec bins |
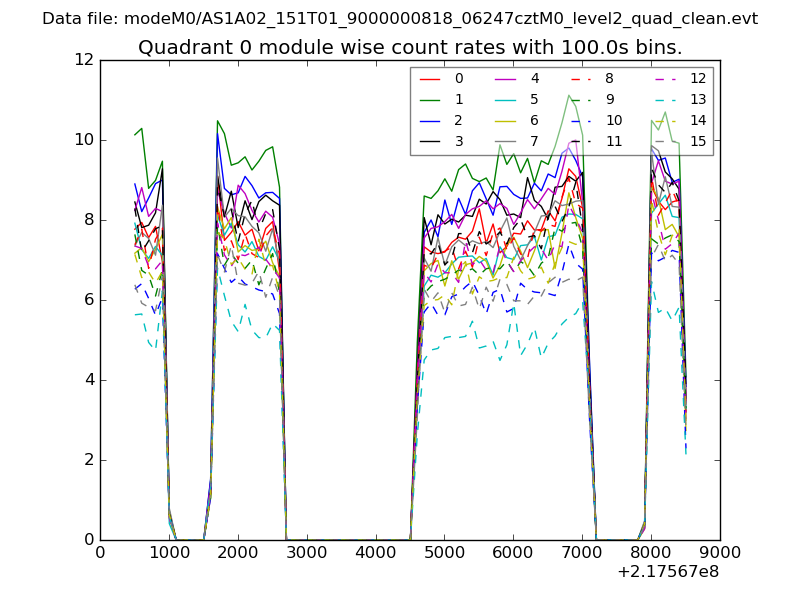 |
 |
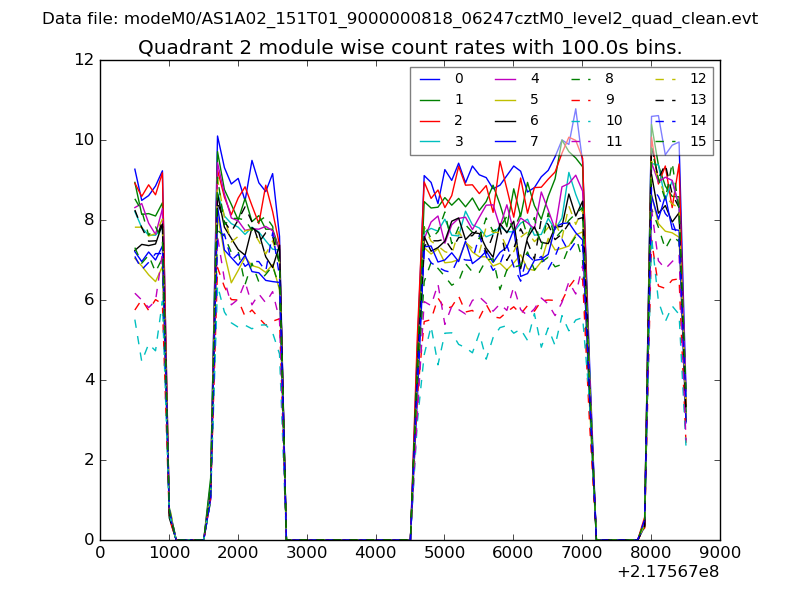
| Module-wise count rates for Quadrant B Data is divided into 100 sec bins |
 |
 |
| Module-wise count rates for Quadrant C Data is divided into 100 sec bins |
 |
 |
| Module-wise count rates for Quadrant D Data is divided into 100 sec bins |
 |
 |
| Parameter | Plot |
|---|---|
| CZT HV Monitor | 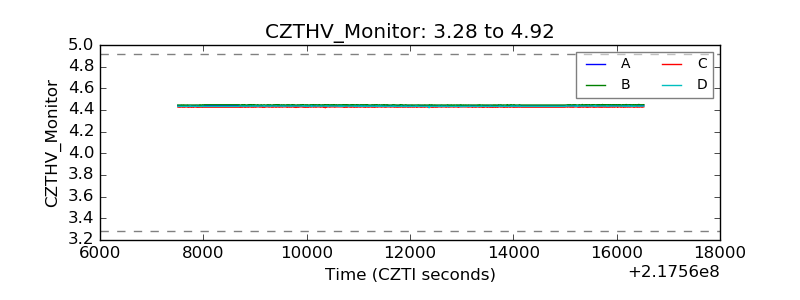 |
| D_VDD | 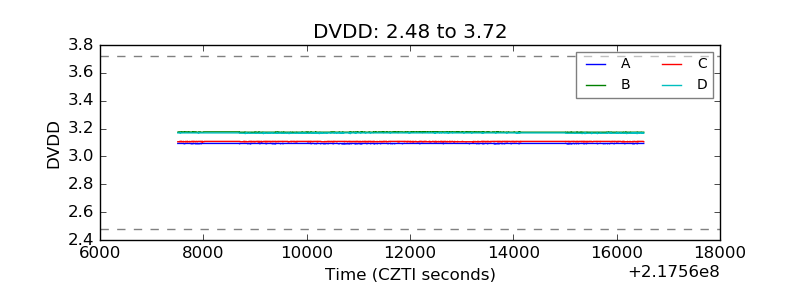 |
| Temperature 1 |  |
| Veto HV Monitor |  |
| Veto LLD | 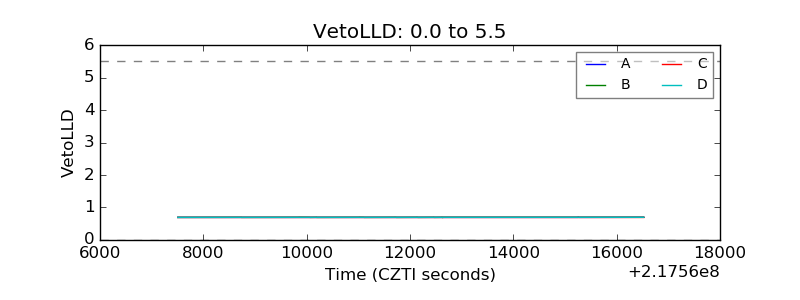 |
| Alpha Counter | 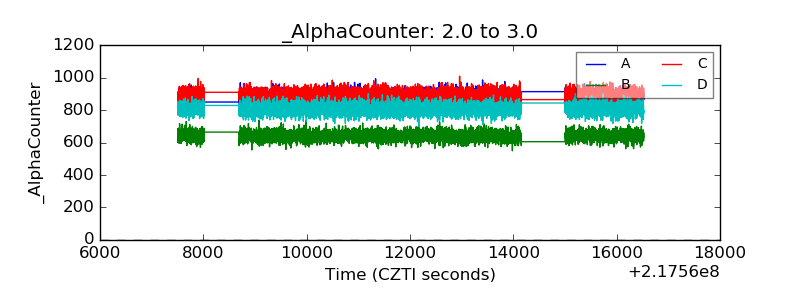 |
| _CPM_Rate | 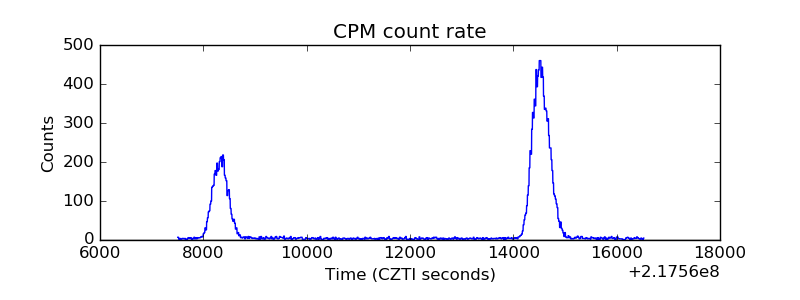 |
| CZT Counter | 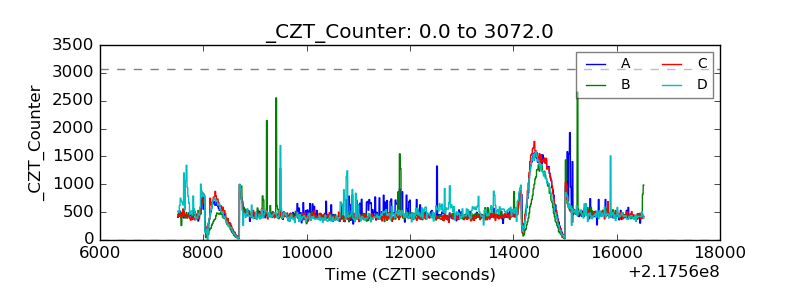 |
| +2.5 Volts monitor |  |
| +5 Volts monitor |  |
| _ROLL_ROT | 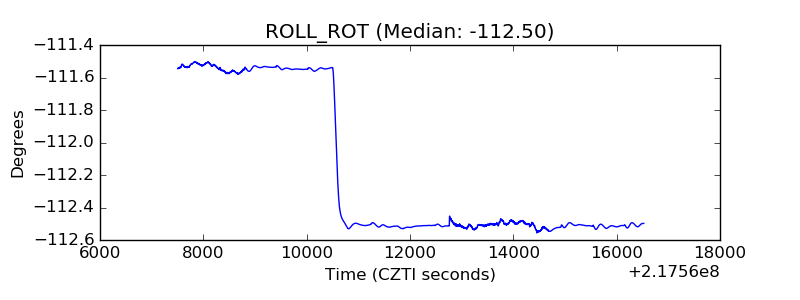 |
| _Roll_DEC | 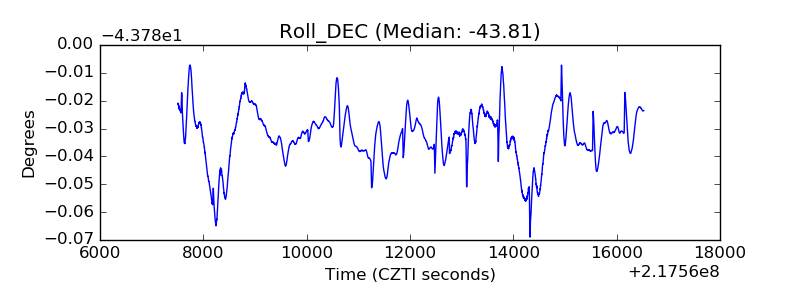 |
| _Roll_RA | 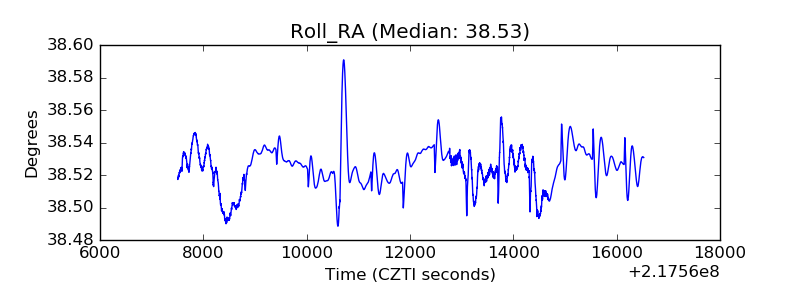 |
| Veto Counter | 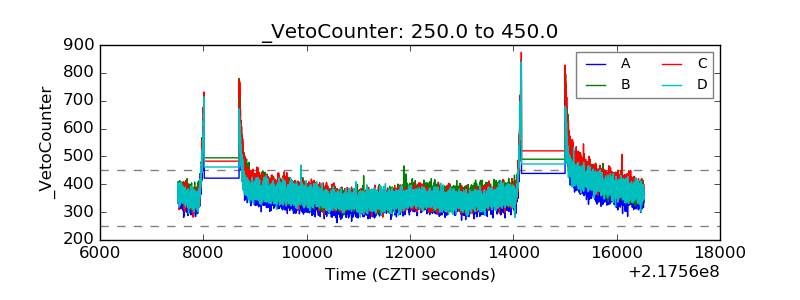 |