| Param | Original file | Final file |
|---|---|---|
| Filename | modeM0/AS1A02_151T01_9000000818_06248cztM0_level2.evt | modeM0/AS1A02_151T01_9000000818_06248cztM0_level2_quad_clean.evt |
| Size (bytes) | 438,387,840 | 70,148,160 |
| Size | 418.1 MB | 66.9 MB |
| Events in quadrant A | 3,103,942 | 414,905 |
| Events in quadrant B | 3,194,294 | 417,637 |
| Events in quadrant C | 3,021,423 | 418,202 |
| Events in quadrant D | 3,499,448 | 404,267 |
| Mode SS | |||
|---|---|---|---|
| Quadrant | BADHDUFLAG | Total packets | Discarded packets |
| A | 0 | 136 | 0 |
| B | 0 | 136 | 0 |
| C | 0 | 136 | 0 |
| D | 0 | 136 | 0 |
| Mode M9 | |||
|---|---|---|---|
| Quadrant | BADHDUFLAG | Total packets | Discarded packets |
| A | 0 | 11 | 0 |
| B | 0 | 11 | 0 |
| C | 0 | 11 | 0 |
| D | 0 | 12 | 0 |
| Mode M0 | |||
|---|---|---|---|
| Quadrant | BADHDUFLAG | Total packets | Discarded packets |
| A | 0 | 13961 | 3 |
| B | 0 | 14053 | 2 |
| C | 0 | 13775 | 2 |
| D | 0 | 14939 | 2 |
| Quadrant | Total seconds | Saturated seconds | Saturation percentage |
|---|---|---|---|
| A | 6728 | 91 | 1.352556% |
| B | 6728 | 112 | 1.664685% |
| C | 6728 | 58 | 0.862069% |
| D | 6728 | 89 | 1.322830% |
Noise dominated data is calculated using 1-second bins in cleaned event files. If a bin has >2000 counts, and if more than 50% of those come from <1% of pixels, then it is considered to be noise-dominated and hence unusable.
| Quadrant | # 1 sec bins | Bins with >0 counts | Bins with >2000 counts | High rate bins dominated by noise | Noise dominated (total time) | Noise dominated (detector-on time) | Marked lightcurve |
|---|---|---|---|---|---|---|---|
| A | 7723 | 6728 | 1 | 1 | 0.01% | 0.01% | 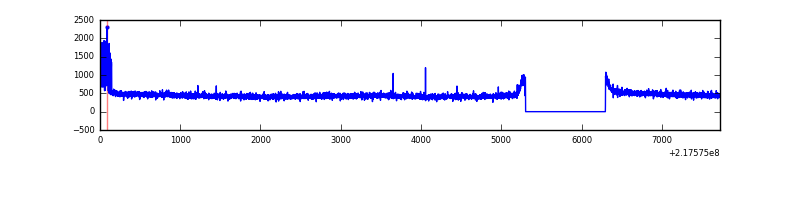 |
| B | 7723 | 6728 | 28 | 28 | 0.36% | 0.42% | 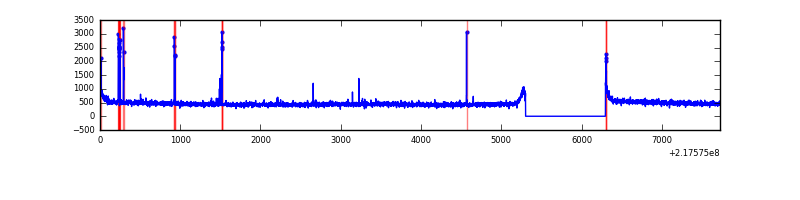 |
| C | 7723 | 6728 | 0 | 0 | 0.00% | 0.00% | 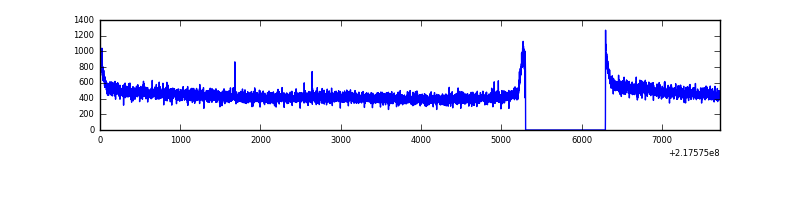 |
| D | 7723 | 6728 | 20 | 20 | 0.26% | 0.30% |  |
Top three noisy pixels from each quadrant. If the there are fewer than three noisy pixels in the level2.evt file, extra rows are filled as -1
| Pixel properties | Quadrant properties | ||||||
|---|---|---|---|---|---|---|---|
| Quadrant | DetID | PixID | Counts | Sigma | Mean | Median | Sigma |
| A | 15 | 236 | 79443 | 491.79 | 784 | 767 | 160.0 |
| A | 12 | 194 | 7566 | 42.5 | 784 | 767 | 160.0 |
| A | 0 | 226 | 7354 | 41.17 | 784 | 767 | 160.0 |
| B | 0 | 219 | 110544 | 732.88 | 789 | 770 | 149.8 |
| B | 4 | 81 | 15974 | 101.5 | 789 | 770 | 149.8 |
| B | 12 | 111 | 15470 | 98.14 | 789 | 770 | 149.8 |
| C | 13 | 61 | 5964 | 29.08 | 773 | 778 | 178.3 |
| C | 14 | 67 | 3209 | 13.63 | 773 | 778 | 178.3 |
| C | 8 | 222 | 2646 | 10.48 | 773 | 778 | 178.3 |
| D | 12 | 220 | 203820 | 1071.76 | 772 | 749 | 189.5 |
| D | 2 | 63 | 137038 | 719.3 | 772 | 749 | 189.5 |
| D | 2 | 152 | 109837 | 575.74 | 772 | 749 | 189.5 |
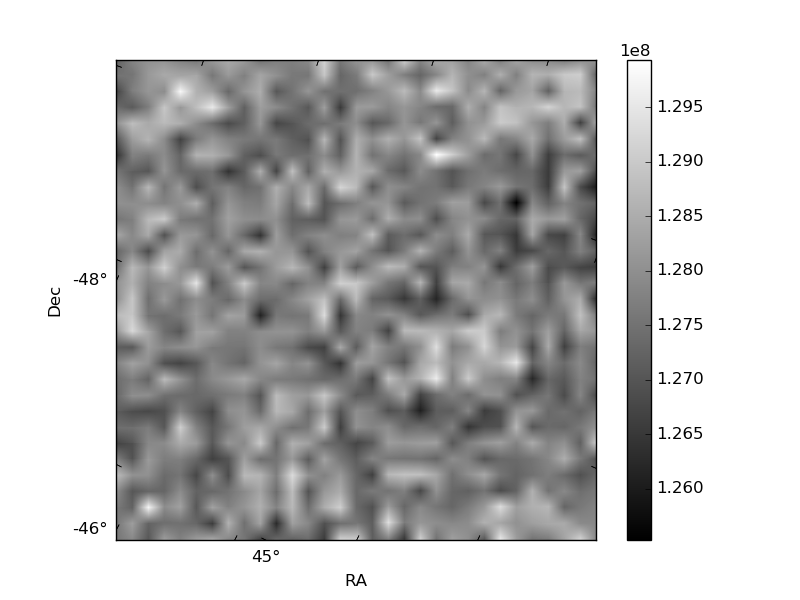
Histogram calculated using DETX and DETY for each event in the final _common_clean file
| Quadrant A |  |
 |
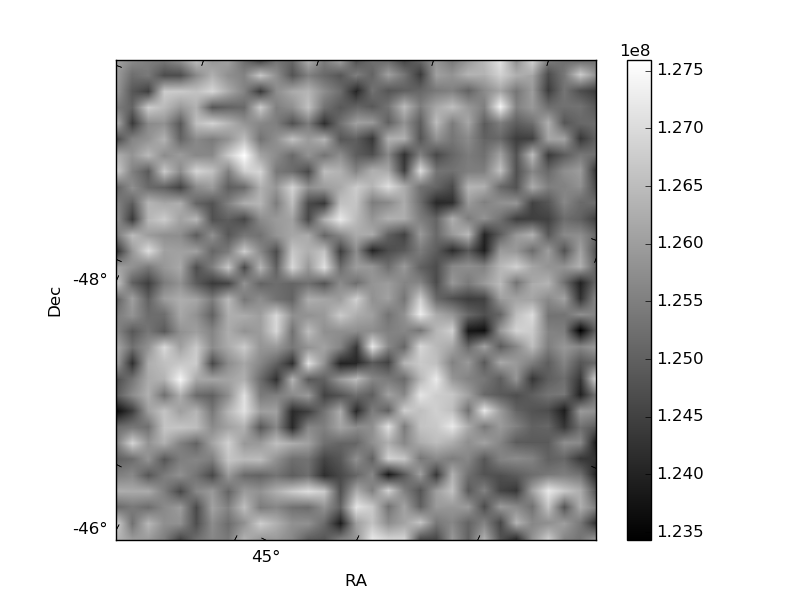
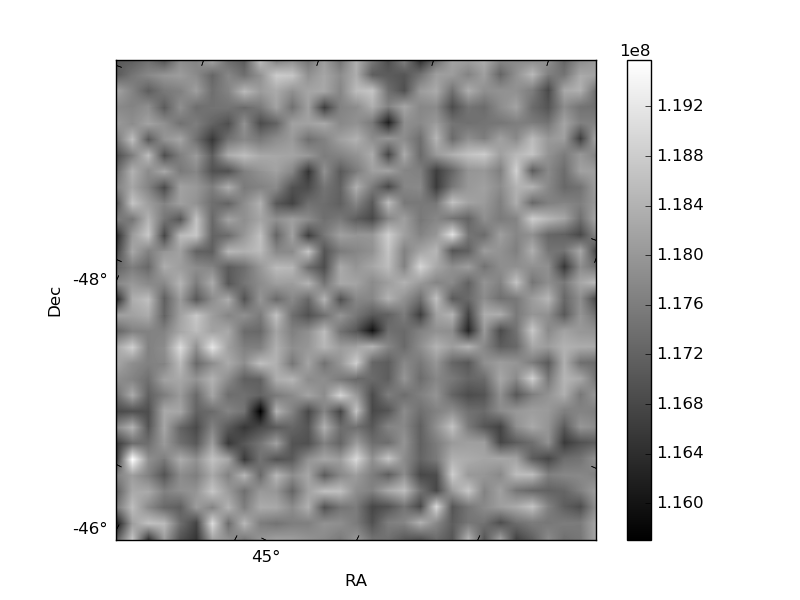
Quadrant B |
|---|---|---|---|
| Quadrant D | 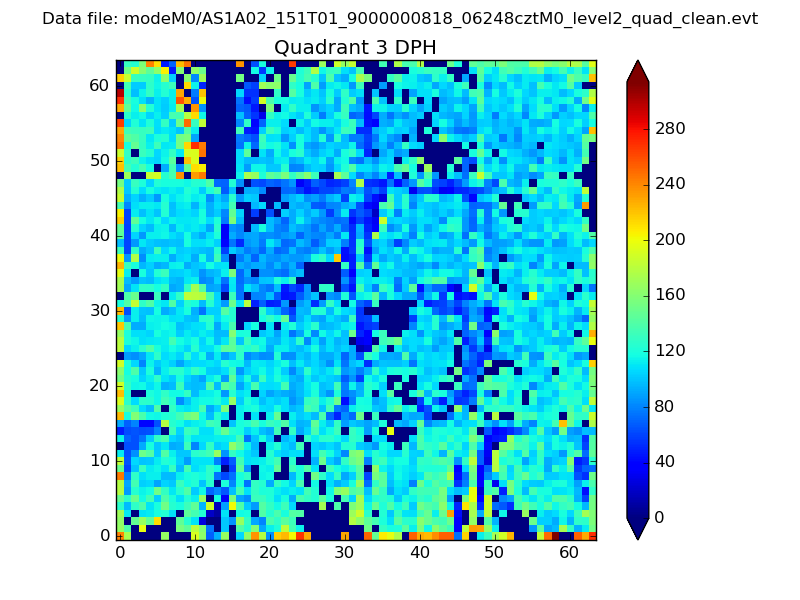 |
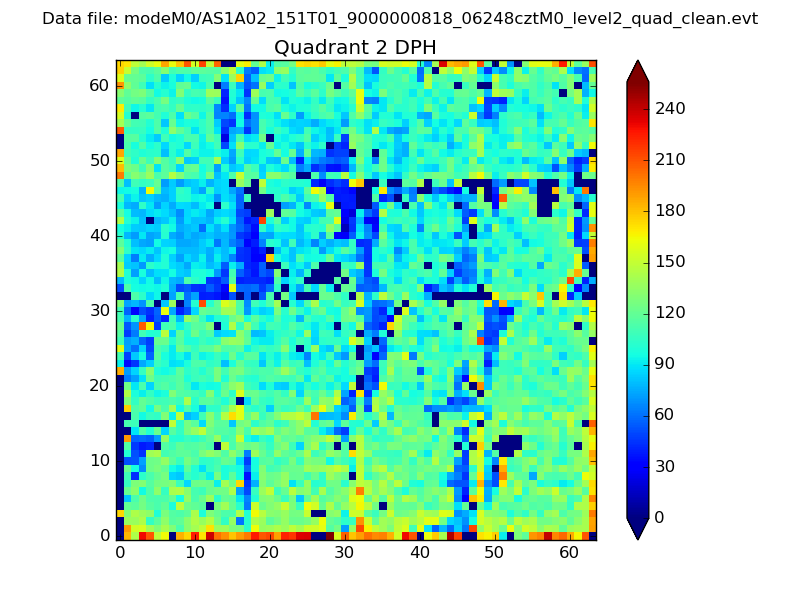 |
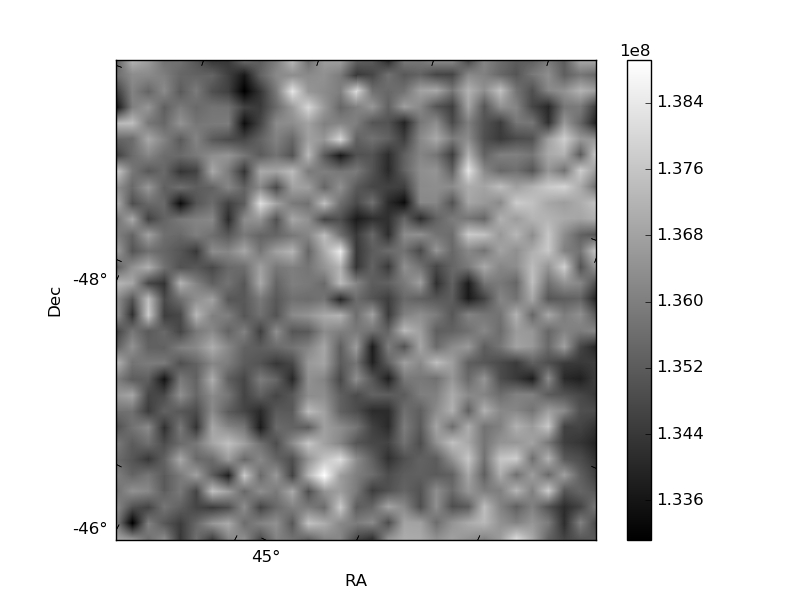
Quadrant C |
| Plot type | Count rate plots | Images |
|---|---|---|
| Comparison with Poisson distribution Blue bars denote a histogram of data divided into 1 sec bins. Red curve is a Poisson curve with rate = median count rate of data. |
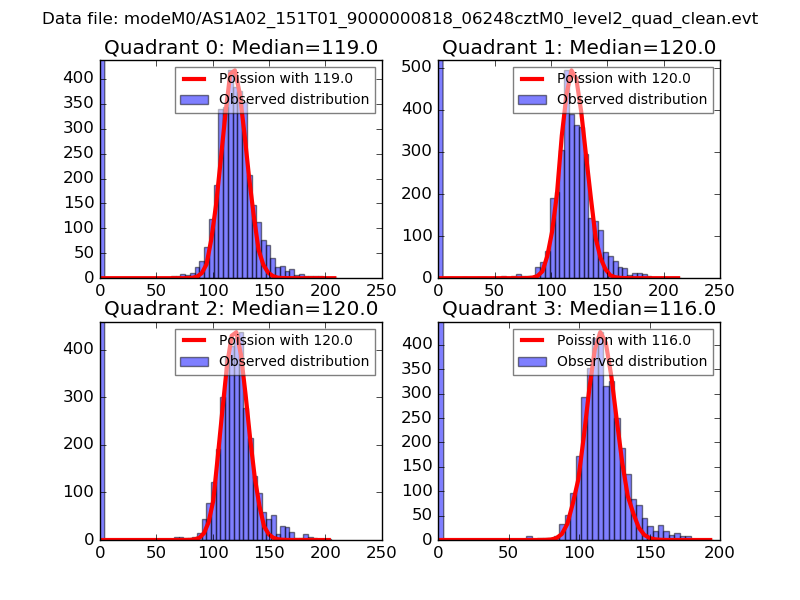 |
 |
| Quadrant-wise count rates Data is divided into 100 sec bins |
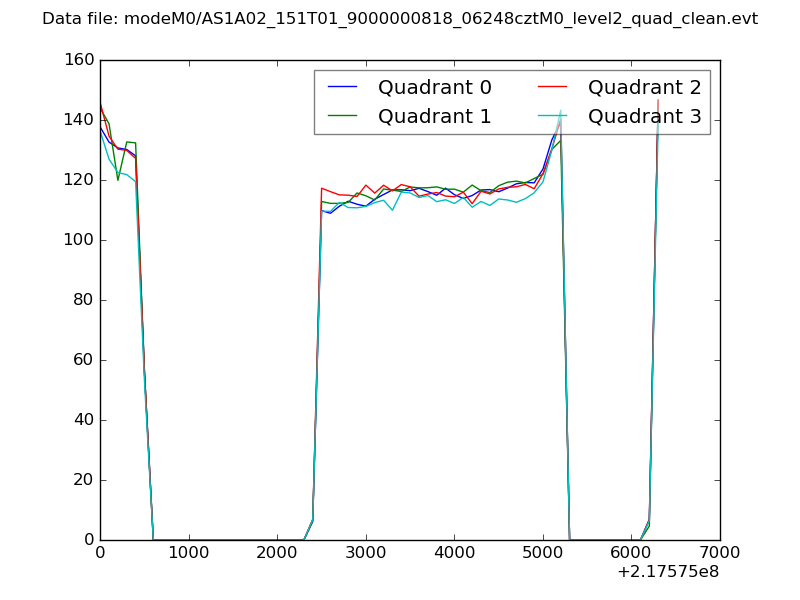 |
|
| Module-wise count rates for Quadrant A Data is divided into 100 sec bins |
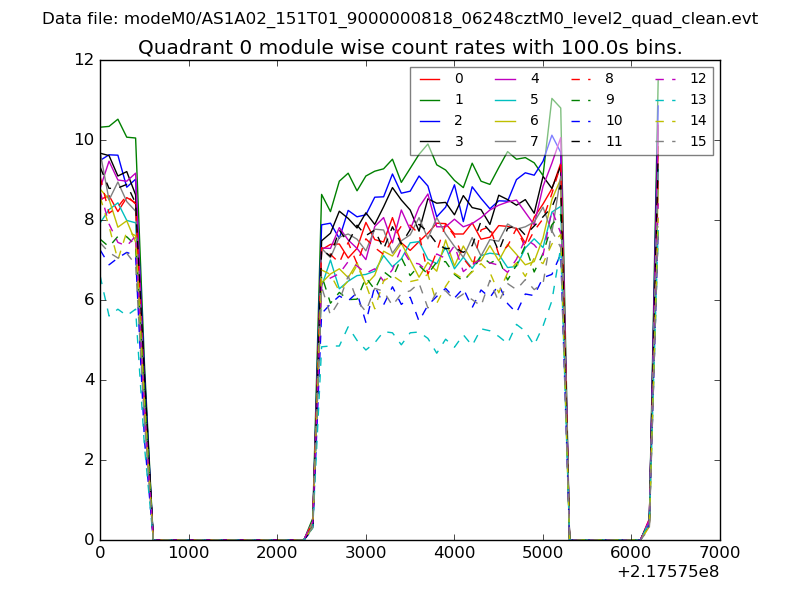 |
 |
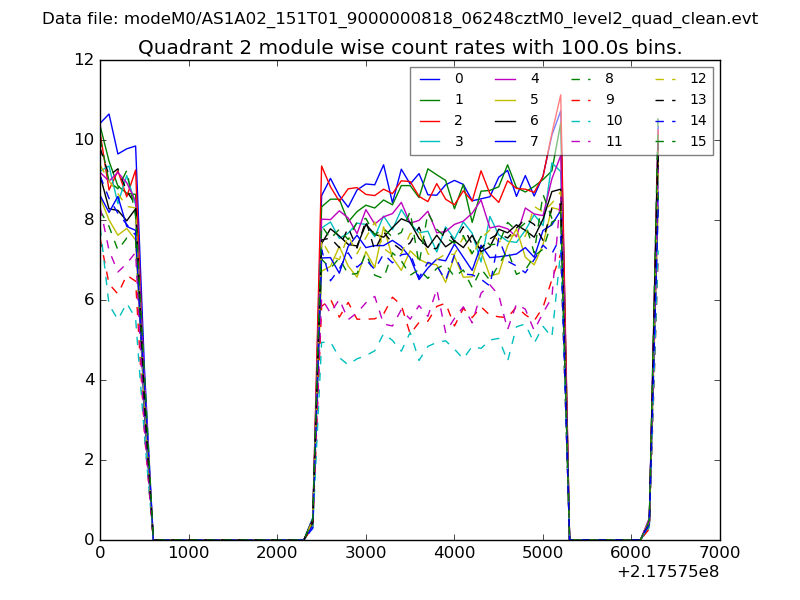
| Module-wise count rates for Quadrant B Data is divided into 100 sec bins |
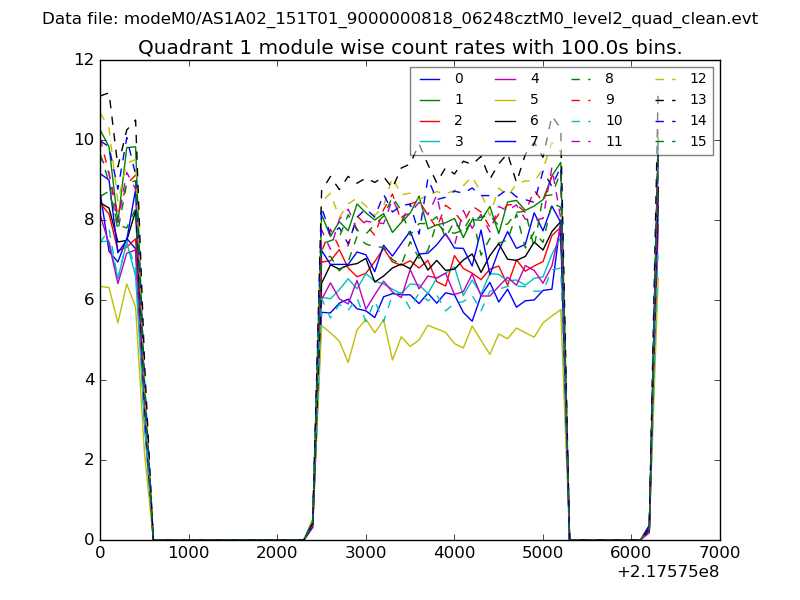 |
 |
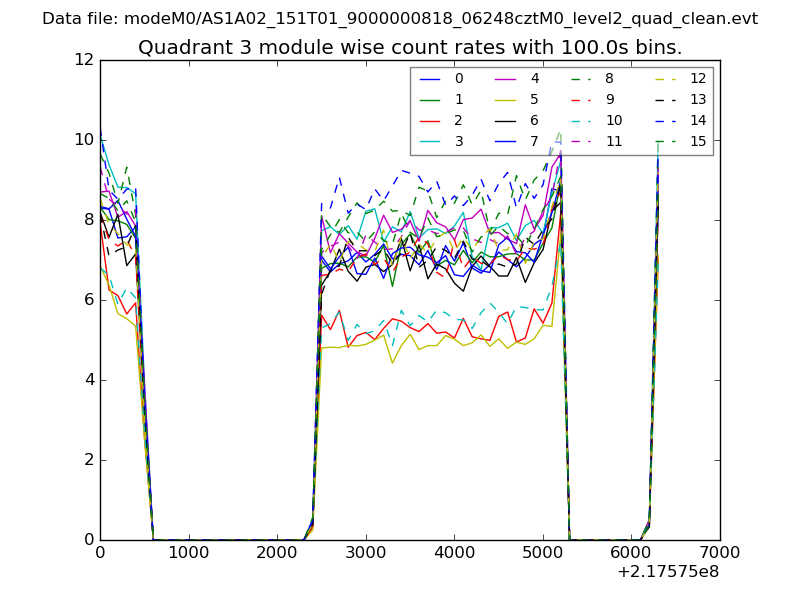
| Module-wise count rates for Quadrant C Data is divided into 100 sec bins |
 |
 |
| Module-wise count rates for Quadrant D Data is divided into 100 sec bins |
 |
 |
| Parameter | Plot |
|---|---|
| CZT HV Monitor | 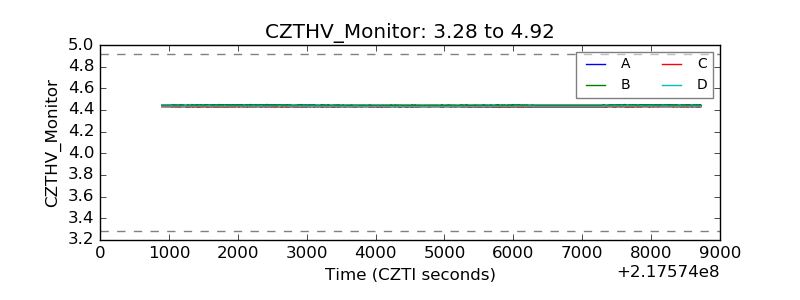 |
| D_VDD |  |
| Temperature 1 | 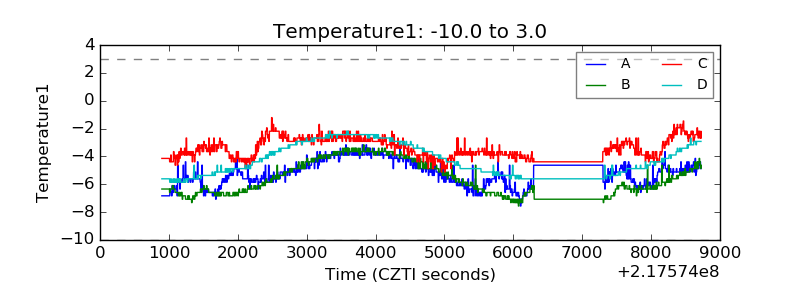 |
| Veto HV Monitor | 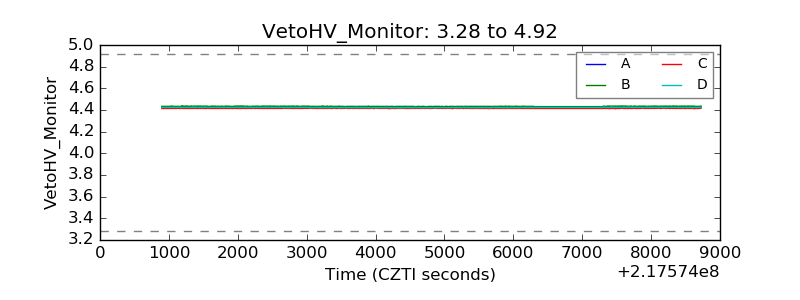 |
| Veto LLD |  |
| Alpha Counter | 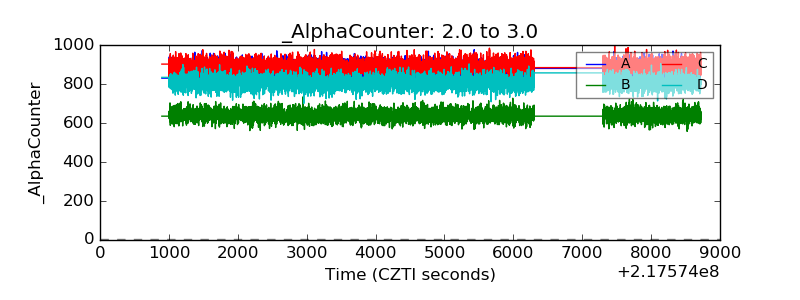 |
| _CPM_Rate | 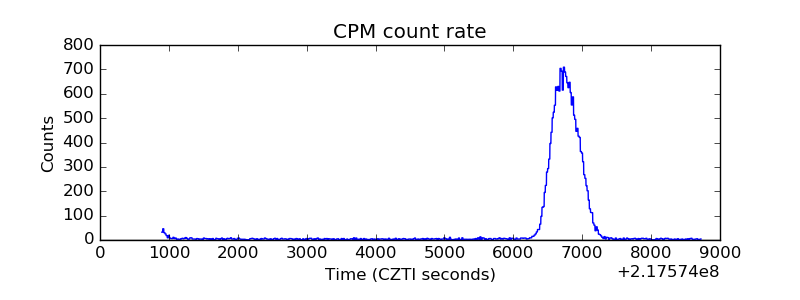 |
| CZT Counter | 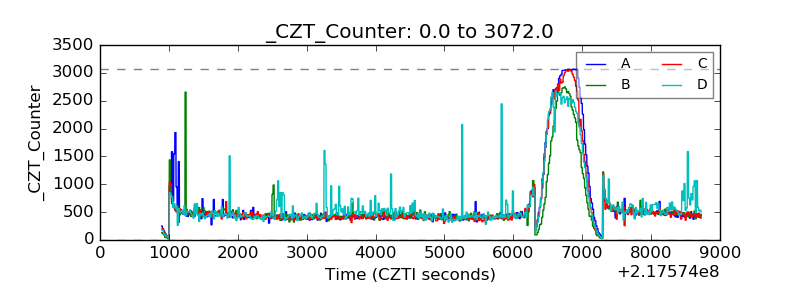 |
| +2.5 Volts monitor | 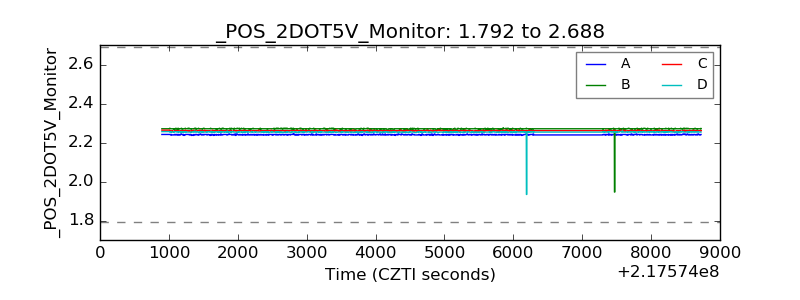 |
| +5 Volts monitor |  |
| _ROLL_ROT |  |
| _Roll_DEC | 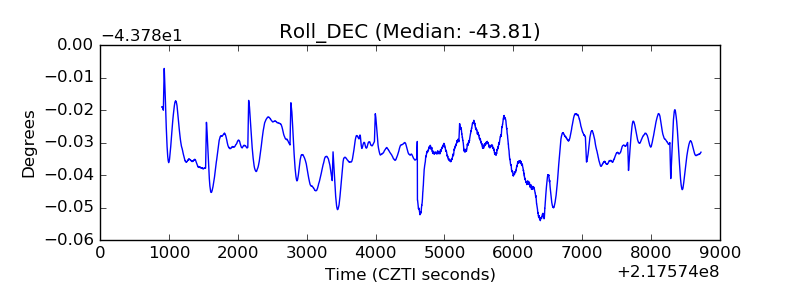 |
| _Roll_RA | 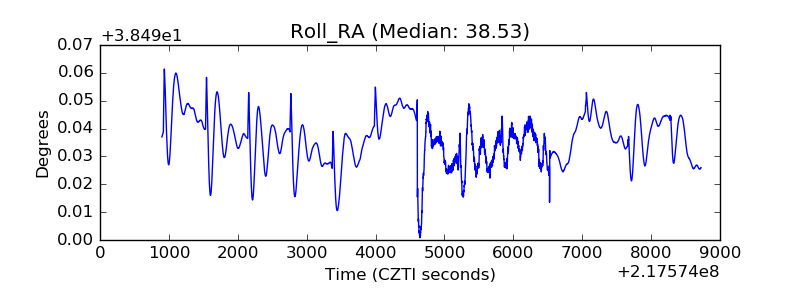 |
| Veto Counter | 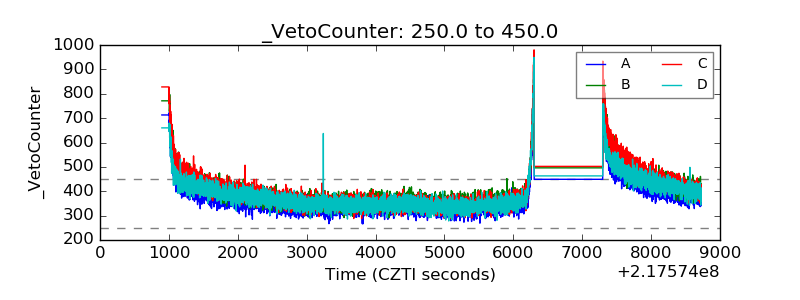 |