| Param | Original file | Final file |
|---|---|---|
| Filename | modeM0/AS1A02_151T01_9000000818_06250cztM0_level2.evt | modeM0/AS1A02_151T01_9000000818_06250cztM0_level2_quad_clean.evt |
| Size (bytes) | 459,705,600 | 68,909,760 |
| Size | 438.4 MB | 65.7 MB |
| Events in quadrant A | 3,274,228 | 407,334 |
| Events in quadrant B | 3,357,213 | 408,394 |
| Events in quadrant C | 3,112,870 | 409,686 |
| Events in quadrant D | 3,723,652 | 395,215 |
| Mode SS | |||
|---|---|---|---|
| Quadrant | BADHDUFLAG | Total packets | Discarded packets |
| A | 0 | 138 | 0 |
| B | 0 | 138 | 0 |
| C | 0 | 138 | 0 |
| D | 0 | 138 | 0 |
| Mode M9 | |||
|---|---|---|---|
| Quadrant | BADHDUFLAG | Total packets | Discarded packets |
| A | 0 | 21 | 0 |
| B | 0 | 21 | 0 |
| C | 0 | 21 | 0 |
| D | 0 | 21 | 0 |
| Mode M0 | |||
|---|---|---|---|
| Quadrant | BADHDUFLAG | Total packets | Discarded packets |
| A | 0 | 14354 | 3 |
| B | 0 | 14401 | 2 |
| C | 0 | 13896 | 2 |
| D | 0 | 15417 | 2 |
| Quadrant | Total seconds | Saturated seconds | Saturation percentage |
|---|---|---|---|
| A | 6680 | 134 | 2.005988% |
| B | 6680 | 179 | 2.679641% |
| C | 6680 | 100 | 1.497006% |
| D | 6680 | 152 | 2.275449% |
Noise dominated data is calculated using 1-second bins in cleaned event files. If a bin has >2000 counts, and if more than 50% of those come from <1% of pixels, then it is considered to be noise-dominated and hence unusable.
| Quadrant | # 1 sec bins | Bins with >0 counts | Bins with >2000 counts | High rate bins dominated by noise | Noise dominated (total time) | Noise dominated (detector-on time) | Marked lightcurve |
|---|---|---|---|---|---|---|---|
| A | 8790 | 6680 | 0 | 0 | 0.00% | 0.00% | 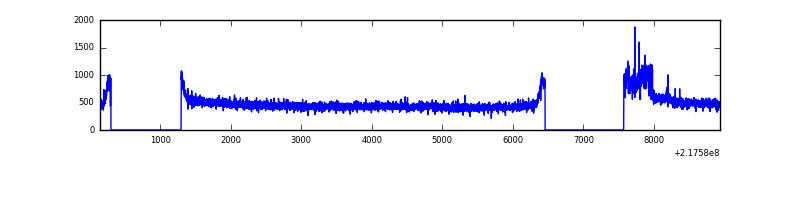 |
| B | 8790 | 6680 | 23 | 23 | 0.26% | 0.34% | 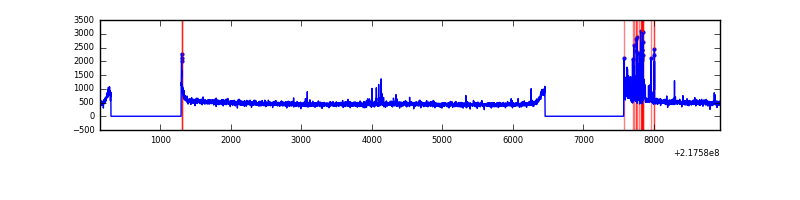 |
| C | 8790 | 6680 | 0 | 0 | 0.00% | 0.00% | 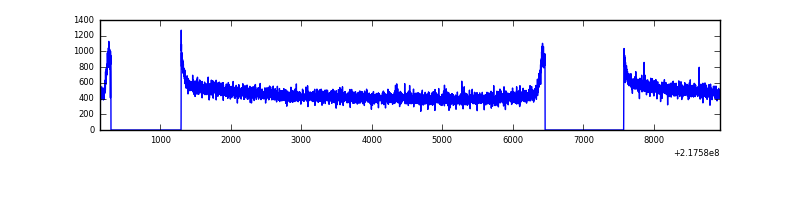 |
| D | 8790 | 6680 | 29 | 29 | 0.33% | 0.43% |  |
Top three noisy pixels from each quadrant. If the there are fewer than three noisy pixels in the level2.evt file, extra rows are filled as -1
| Pixel properties | Quadrant properties | ||||||
|---|---|---|---|---|---|---|---|
| Quadrant | DetID | PixID | Counts | Sigma | Mean | Median | Sigma |
| A | 14 | 111 | 144394 | 877.05 | 811 | 795 | 163.7 |
| A | 8 | 15 | 9149 | 51.02 | 811 | 795 | 163.7 |
| A | 0 | 226 | 7776 | 42.64 | 811 | 795 | 163.7 |
| B | 3 | 64 | 137331 | 887.83 | 811 | 793 | 153.8 |
| B | 0 | 219 | 42519 | 271.32 | 811 | 793 | 153.8 |
| B | 12 | 111 | 15707 | 96.98 | 811 | 793 | 153.8 |
| C | 13 | 61 | 6185 | 29.5 | 796 | 800 | 182.5 |
| C | 14 | 67 | 3211 | 13.21 | 796 | 800 | 182.5 |
| C | 8 | 222 | 2377 | 8.64 | 796 | 800 | 182.5 |
| D | 12 | 220 | 233850 | 1201.04 | 794 | 768 | 194.1 |
| D | 2 | 63 | 208215 | 1068.94 | 794 | 768 | 194.1 |
| D | 2 | 152 | 130988 | 671.0 | 794 | 768 | 194.1 |
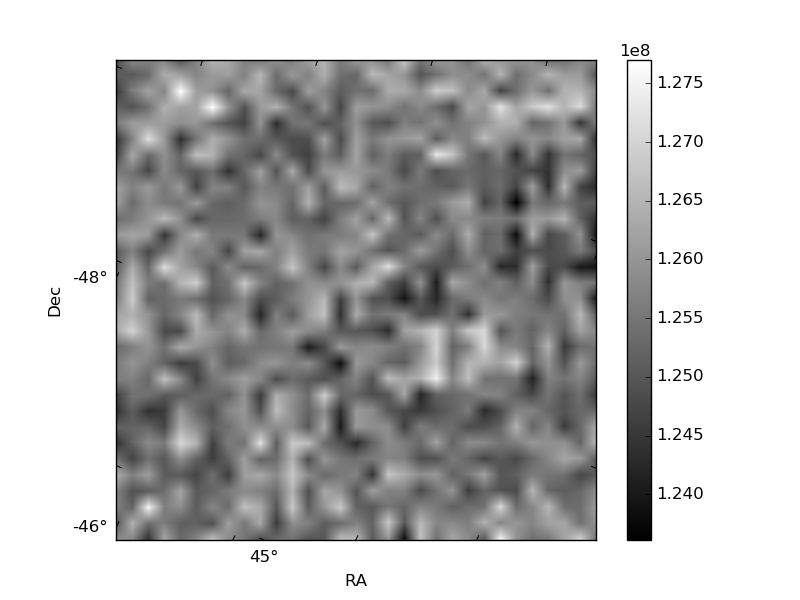
Histogram calculated using DETX and DETY for each event in the final _common_clean file
| Quadrant A |  |
 |
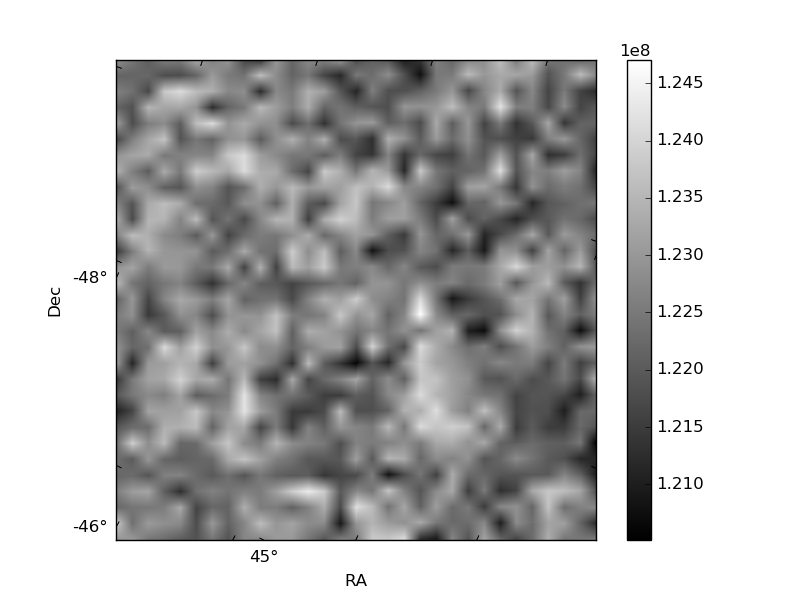
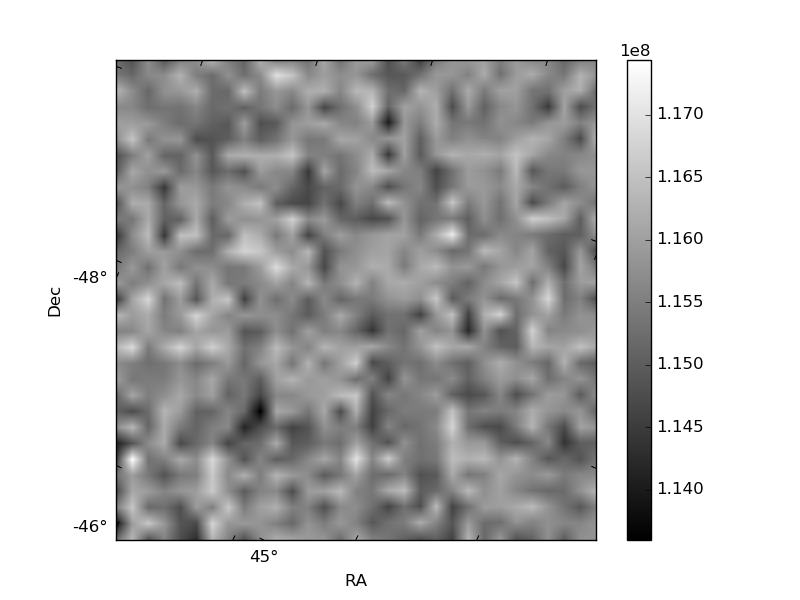
Quadrant B |
|---|---|---|---|
| Quadrant D | 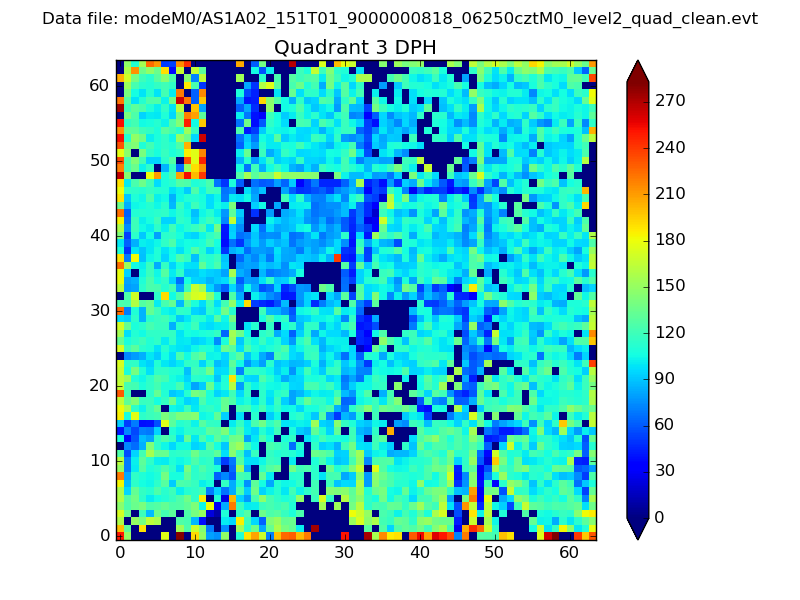 |
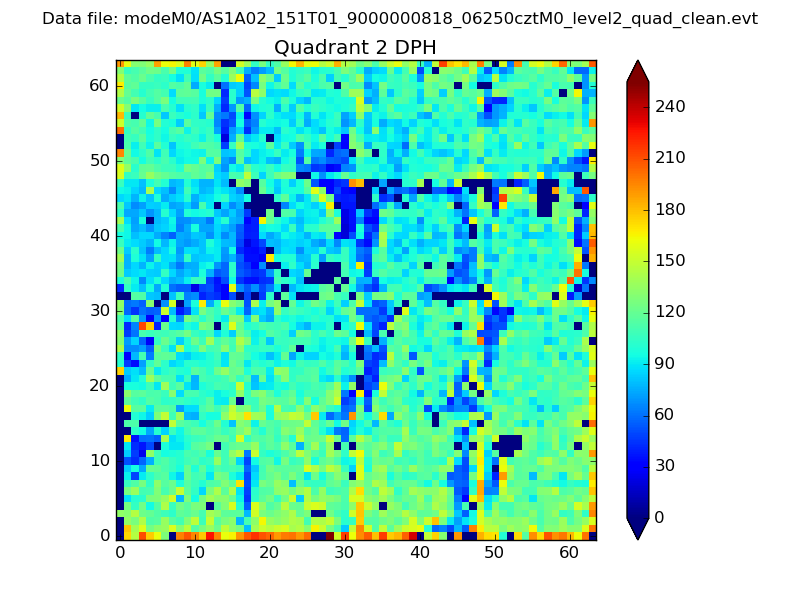 |
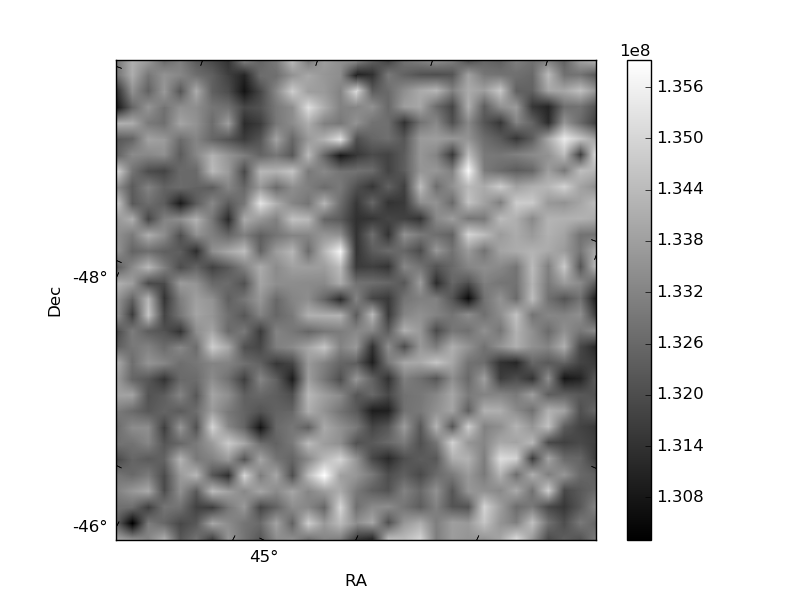
Quadrant C |
| Plot type | Count rate plots | Images |
|---|---|---|
| Comparison with Poisson distribution Blue bars denote a histogram of data divided into 1 sec bins. Red curve is a Poisson curve with rate = median count rate of data. |
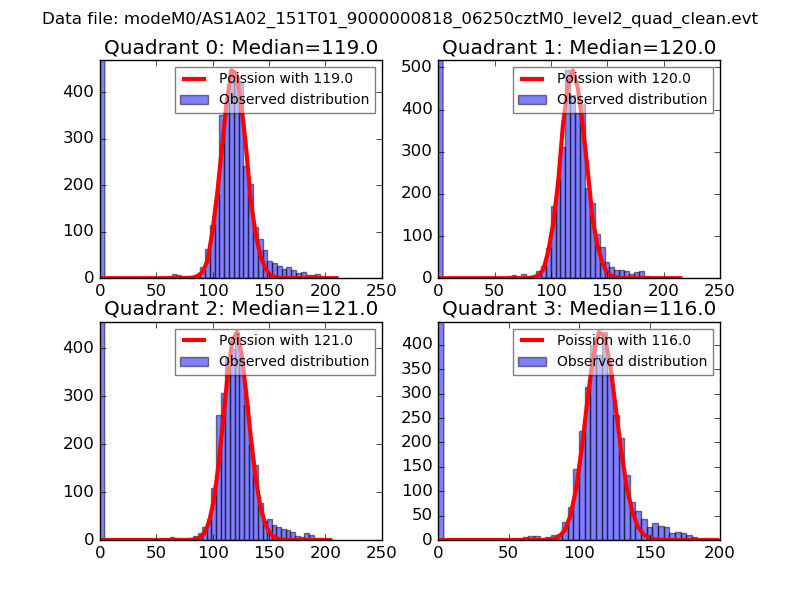 |
 |
| Quadrant-wise count rates Data is divided into 100 sec bins |
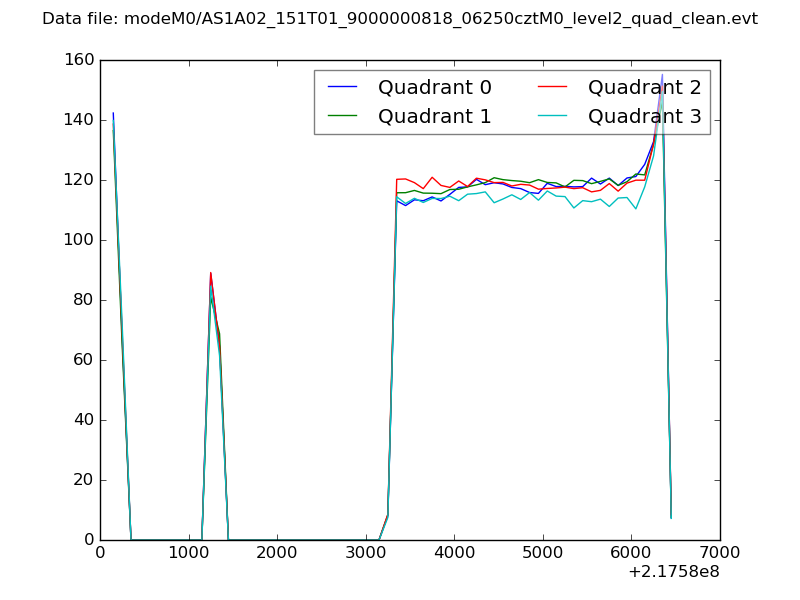 |
|
| Module-wise count rates for Quadrant A Data is divided into 100 sec bins |
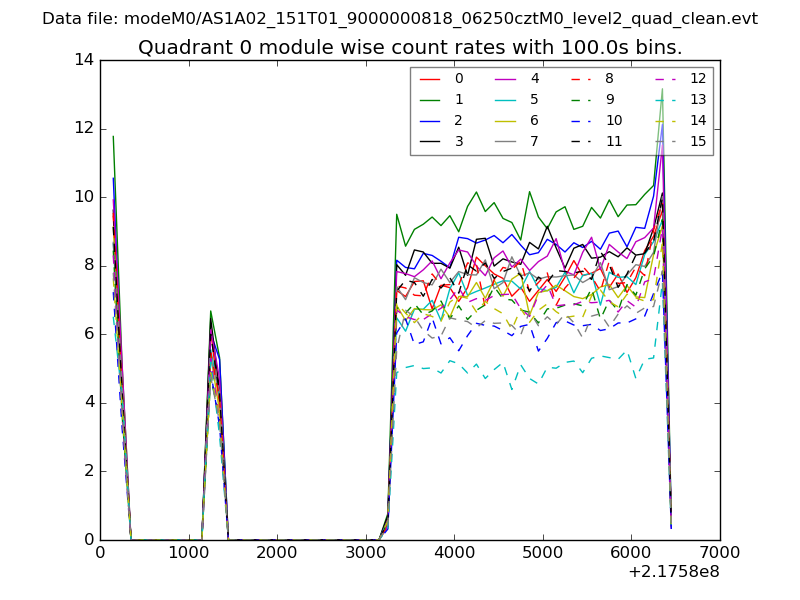 |
 |
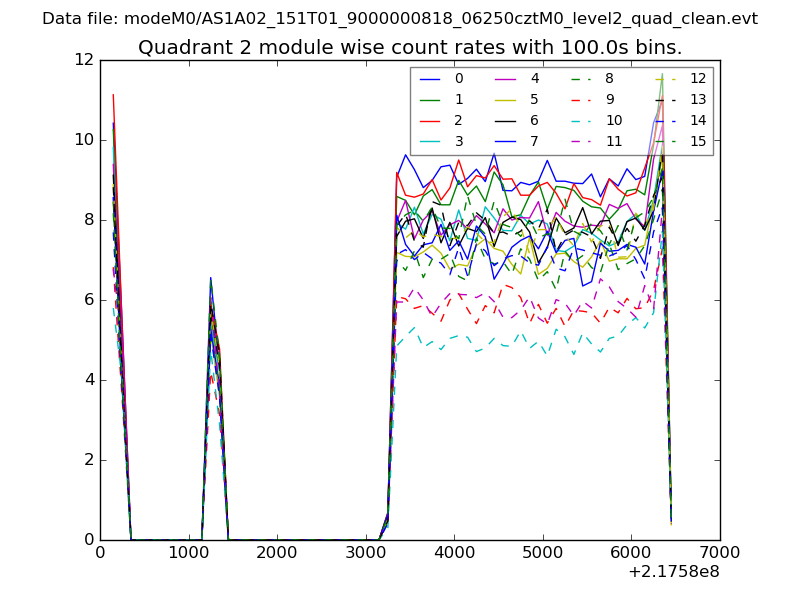
| Module-wise count rates for Quadrant B Data is divided into 100 sec bins |
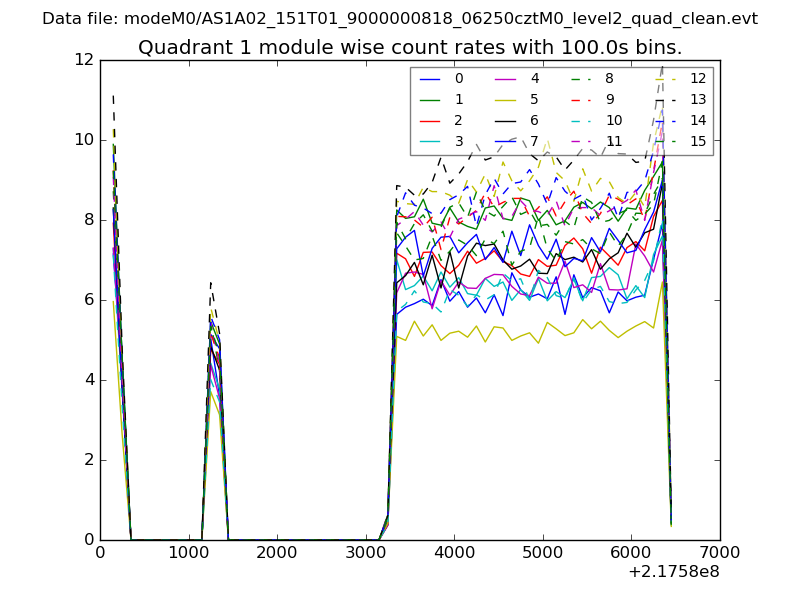 |
 |
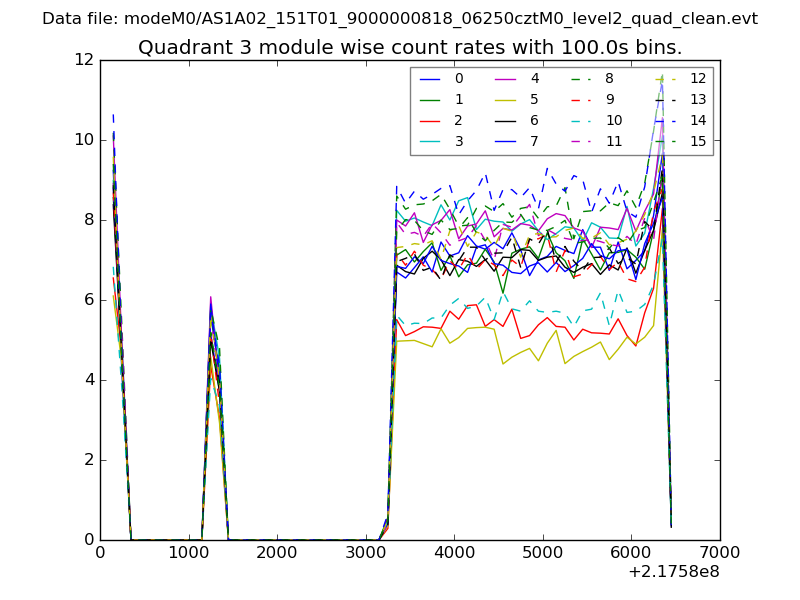
| Module-wise count rates for Quadrant C Data is divided into 100 sec bins |
 |
 |
| Module-wise count rates for Quadrant D Data is divided into 100 sec bins |
 |
 |
| Parameter | Plot |
|---|---|
| CZT HV Monitor | 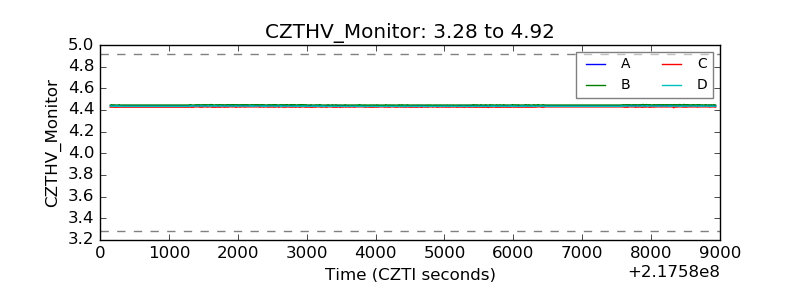 |
| D_VDD | 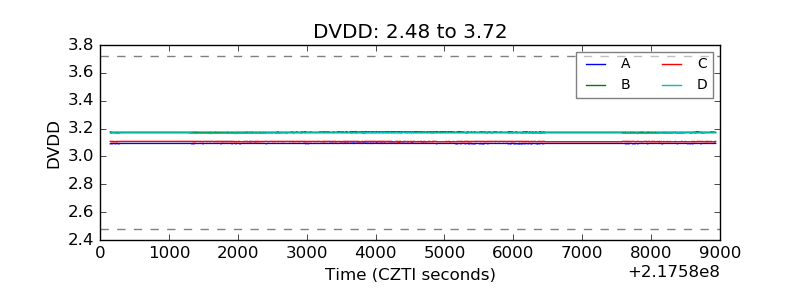 |
| Temperature 1 | 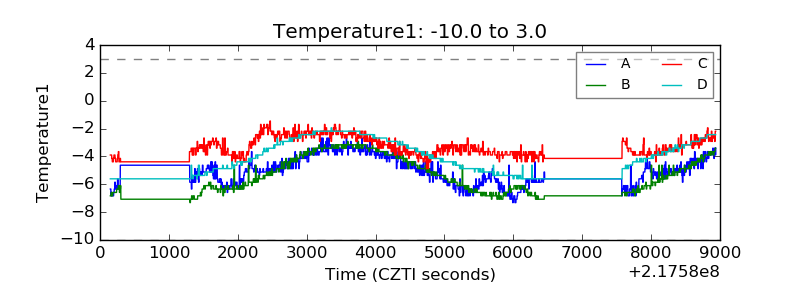 |
| Veto HV Monitor | 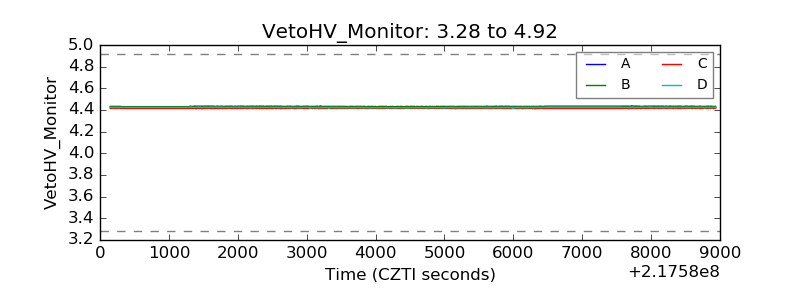 |
| Veto LLD | 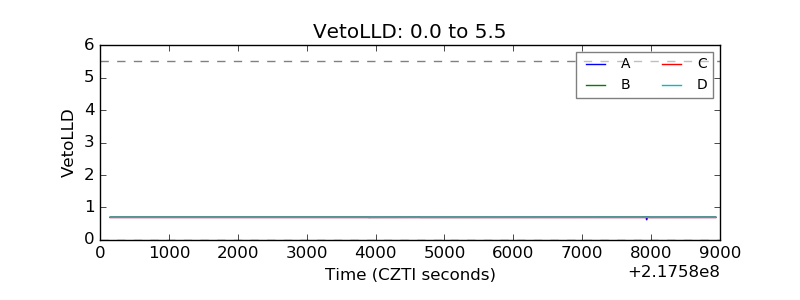 |
| Alpha Counter | 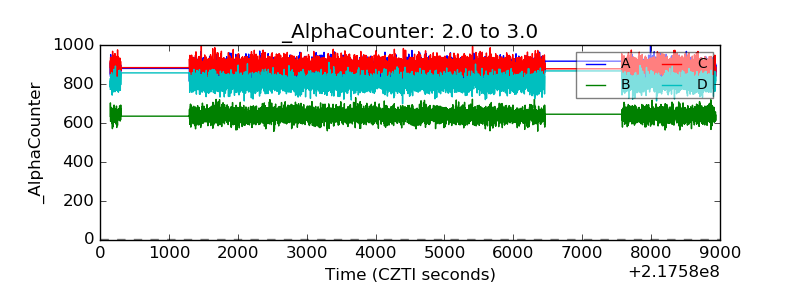 |
| _CPM_Rate | 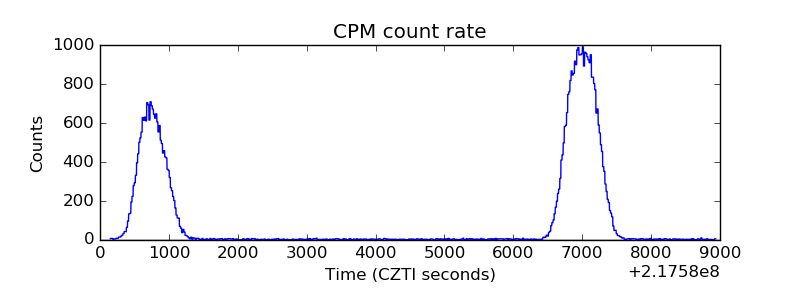 |
| CZT Counter | 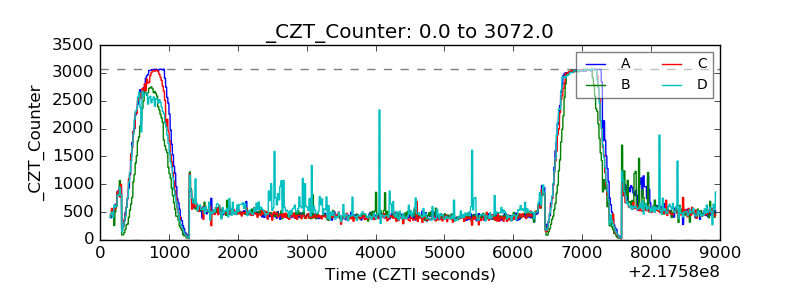 |
| +2.5 Volts monitor | 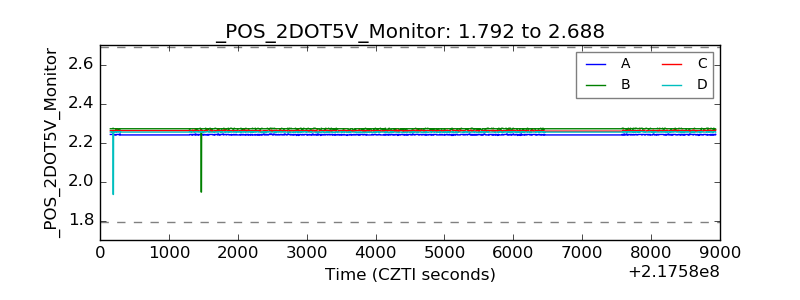 |
| +5 Volts monitor |  |
| _ROLL_ROT | 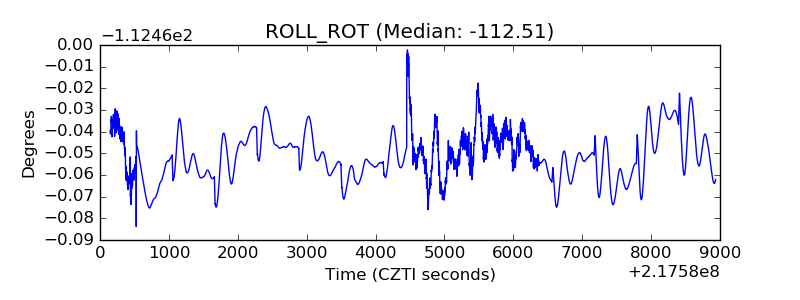 |
| _Roll_DEC | 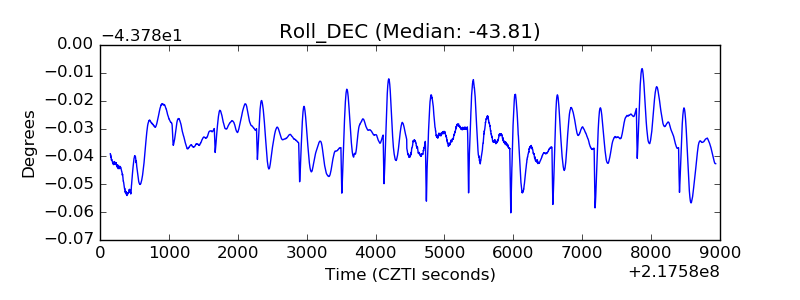 |
| _Roll_RA | 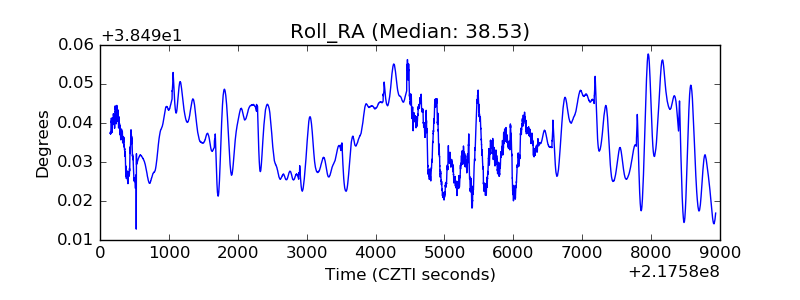 |
| Veto Counter | 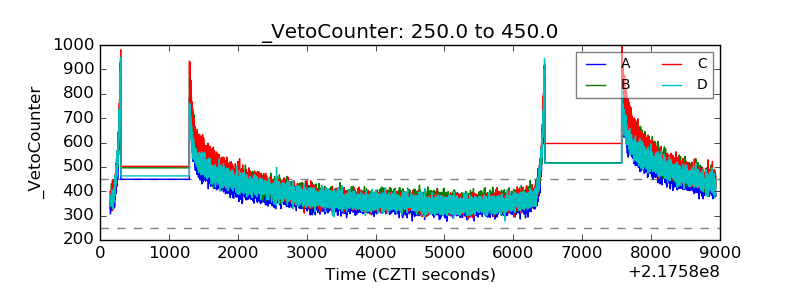 |