| Param | Original file | Final file |
|---|---|---|
| Filename | modeM0/AS1A02_151T01_9000000818_06251cztM0_level2.evt | modeM0/AS1A02_151T01_9000000818_06251cztM0_level2_quad_clean.evt |
| Size (bytes) | 461,816,640 | 73,307,520 |
| Size | 440.4 MB | 69.9 MB |
| Events in quadrant A | 3,230,817 | 444,746 |
| Events in quadrant B | 3,435,946 | 450,845 |
| Events in quadrant C | 3,042,521 | 446,506 |
| Events in quadrant D | 3,839,801 | 428,782 |
| Mode SS | |||
|---|---|---|---|
| Quadrant | BADHDUFLAG | Total packets | Discarded packets |
| A | 0 | 132 | 0 |
| B | 0 | 132 | 0 |
| C | 0 | 132 | 0 |
| D | 0 | 132 | 0 |
| Mode M9 | |||
|---|---|---|---|
| Quadrant | BADHDUFLAG | Total packets | Discarded packets |
| A | 0 | 16 | 0 |
| B | 0 | 16 | 0 |
| C | 0 | 16 | 0 |
| D | 0 | 17 | 0 |
| Mode M0 | |||
|---|---|---|---|
| Quadrant | BADHDUFLAG | Total packets | Discarded packets |
| A | 0 | 13916 | 3 |
| B | 0 | 14447 | 2 |
| C | 0 | 13431 | 2 |
| D | 0 | 15672 | 2 |
| Quadrant | Total seconds | Saturated seconds | Saturation percentage |
|---|---|---|---|
| A | 6428 | 108 | 1.680149% |
| B | 6428 | 170 | 2.644680% |
| C | 6428 | 75 | 1.166770% |
| D | 6428 | 179 | 2.784692% |
Noise dominated data is calculated using 1-second bins in cleaned event files. If a bin has >2000 counts, and if more than 50% of those come from <1% of pixels, then it is considered to be noise-dominated and hence unusable.
| Quadrant | # 1 sec bins | Bins with >0 counts | Bins with >2000 counts | High rate bins dominated by noise | Noise dominated (total time) | Noise dominated (detector-on time) | Marked lightcurve |
|---|---|---|---|---|---|---|---|
| A | 7633 | 6428 | 0 | 0 | 0.00% | 0.00% | 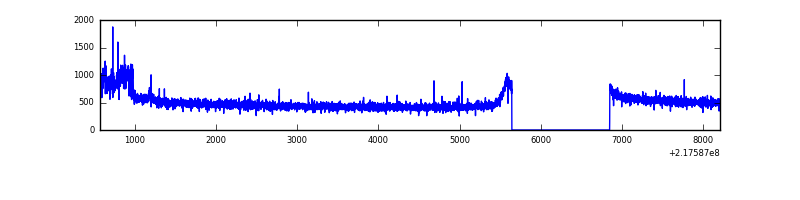 |
| B | 7633 | 6428 | 31 | 31 | 0.41% | 0.48% |  |
| C | 7633 | 6428 | 0 | 0 | 0.00% | 0.00% |  |
| D | 7633 | 6428 | 55 | 55 | 0.72% | 0.86% | 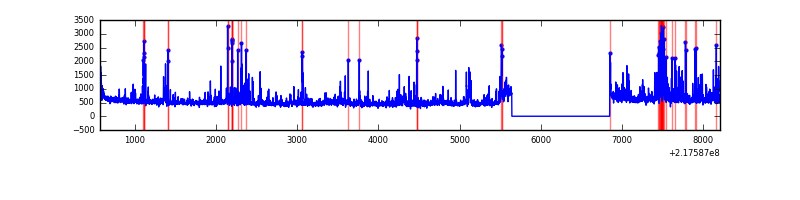 |
Top three noisy pixels from each quadrant. If the there are fewer than three noisy pixels in the level2.evt file, extra rows are filled as -1
| Pixel properties | Quadrant properties | ||||||
|---|---|---|---|---|---|---|---|
| Quadrant | DetID | PixID | Counts | Sigma | Mean | Median | Sigma |
| A | 14 | 111 | 144460 | 896.67 | 800 | 784 | 160.2 |
| A | 8 | 15 | 8228 | 46.46 | 800 | 784 | 160.2 |
| A | 0 | 226 | 7602 | 42.55 | 800 | 784 | 160.2 |
| B | 3 | 64 | 272592 | 1794.85 | 799 | 781 | 151.4 |
| B | 4 | 81 | 28609 | 183.76 | 799 | 781 | 151.4 |
| B | 0 | 219 | 22196 | 141.41 | 799 | 781 | 151.4 |
| C | 13 | 61 | 6204 | 30.57 | 778 | 783 | 177.4 |
| C | 1 | 0 | 5436 | 26.24 | 778 | 783 | 177.4 |
| C | 3 | 202 | 1937 | 6.51 | 778 | 783 | 177.4 |
| D | 12 | 220 | 440174 | 2342.12 | 774 | 748 | 187.6 |
| D | 2 | 152 | 114607 | 606.86 | 774 | 748 | 187.6 |
| D | 12 | 221 | 100002 | 529.02 | 774 | 748 | 187.6 |
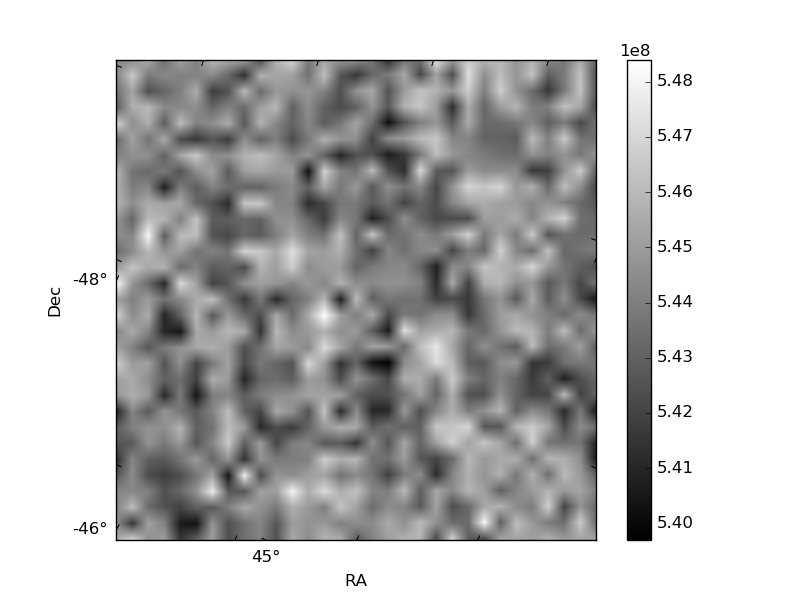
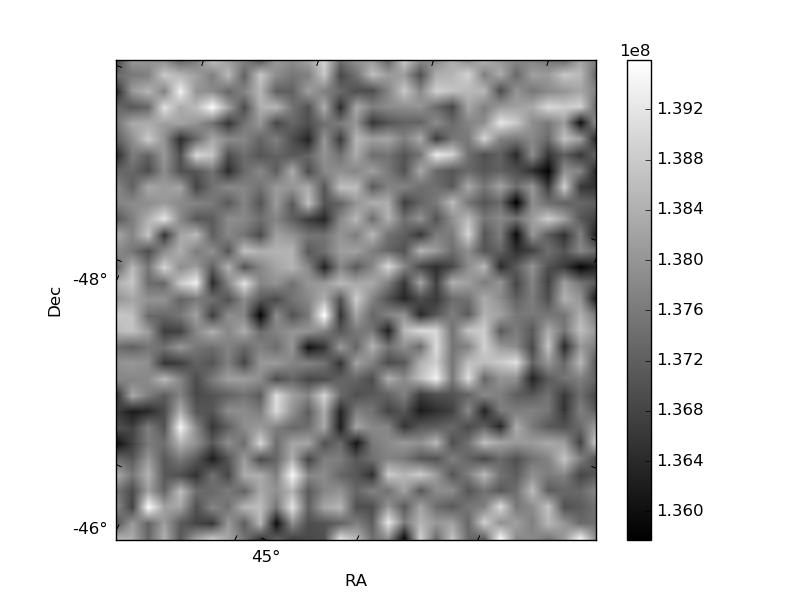
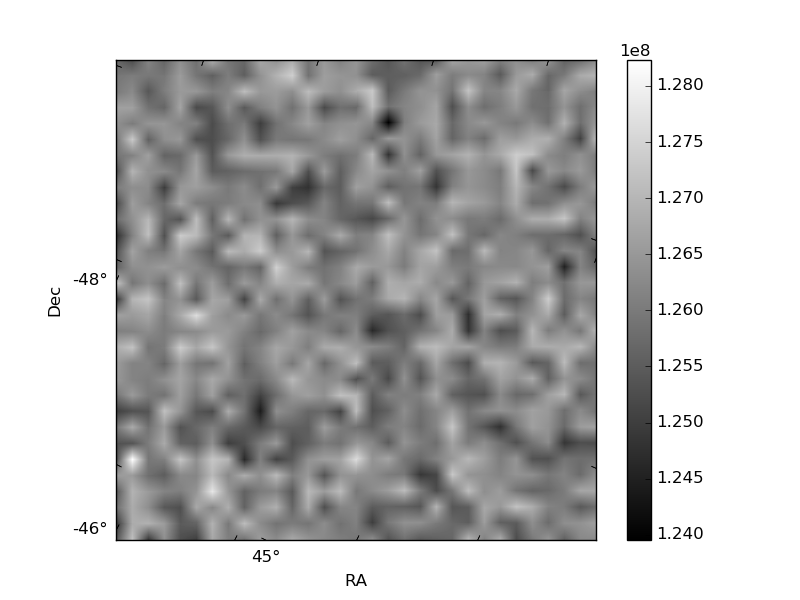
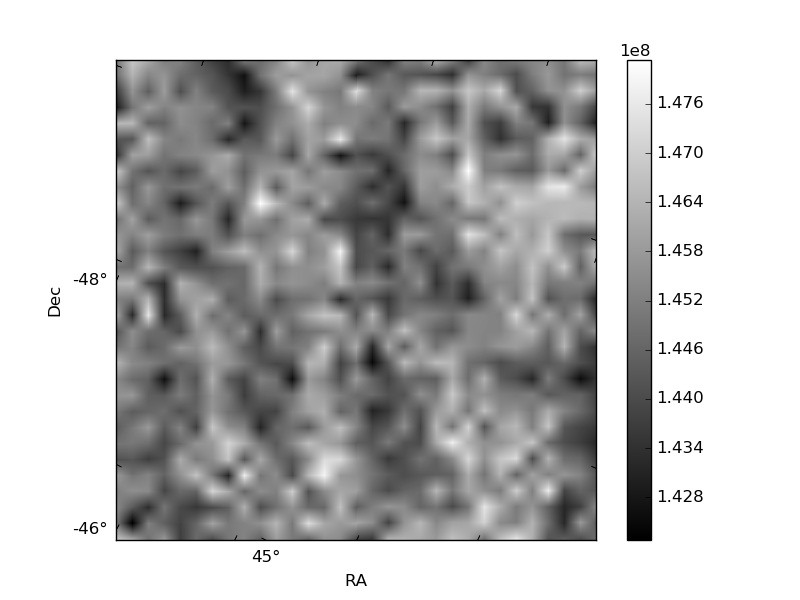
Histogram calculated using DETX and DETY for each event in the final _common_clean file
| Quadrant A | 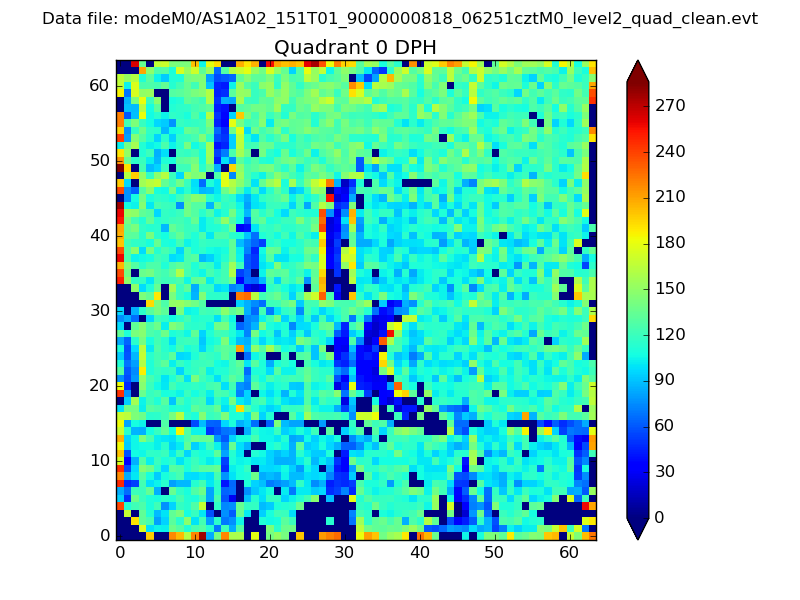 |
 |
Quadrant B |
|---|---|---|---|
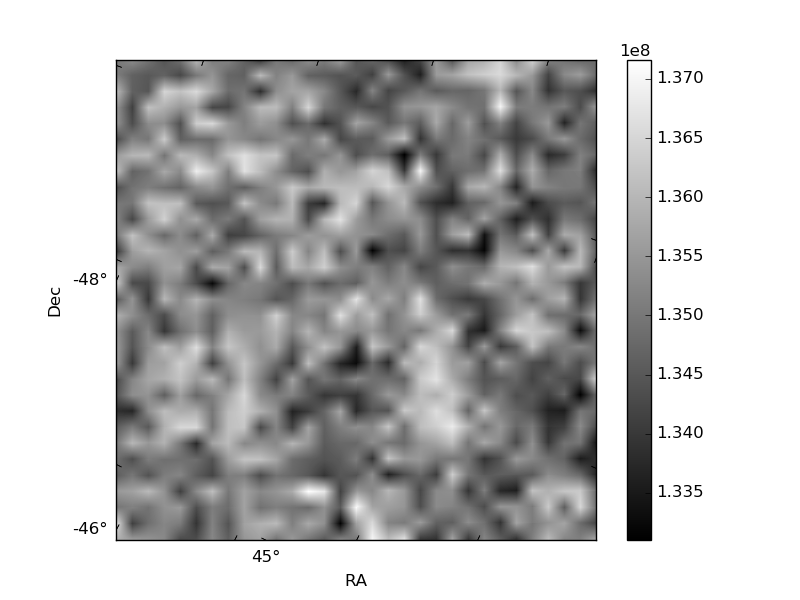
| Quadrant D | 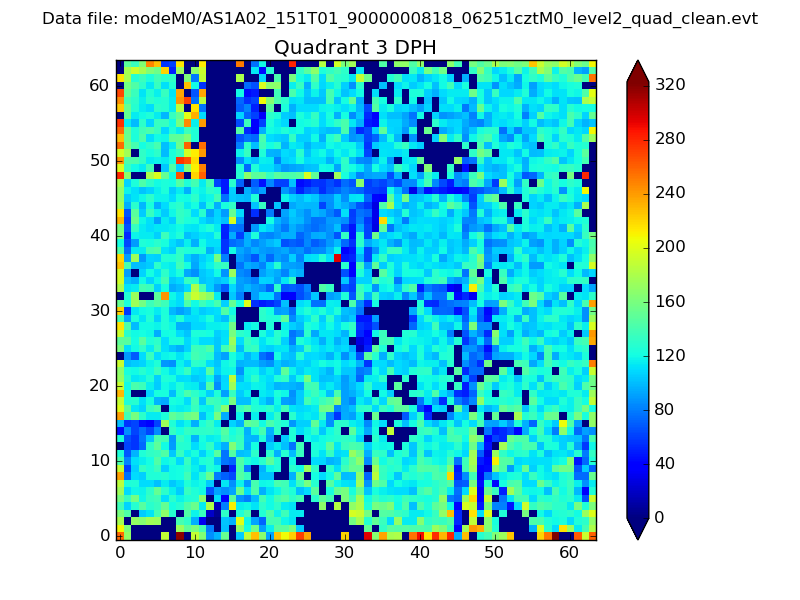 |
 |
Quadrant C |
| Plot type | Count rate plots | Images |
|---|---|---|
| Comparison with Poisson distribution Blue bars denote a histogram of data divided into 1 sec bins. Red curve is a Poisson curve with rate = median count rate of data. |
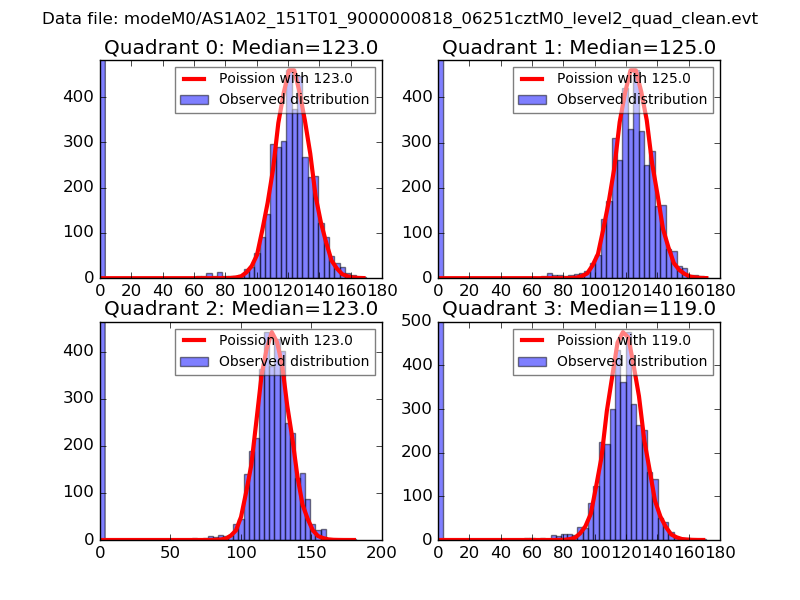 |
 |
| Quadrant-wise count rates Data is divided into 100 sec bins |
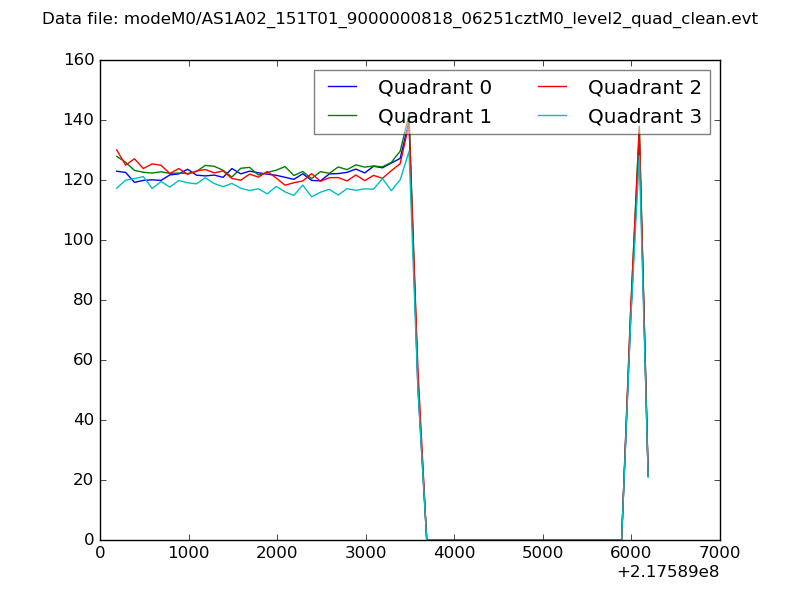 |
|
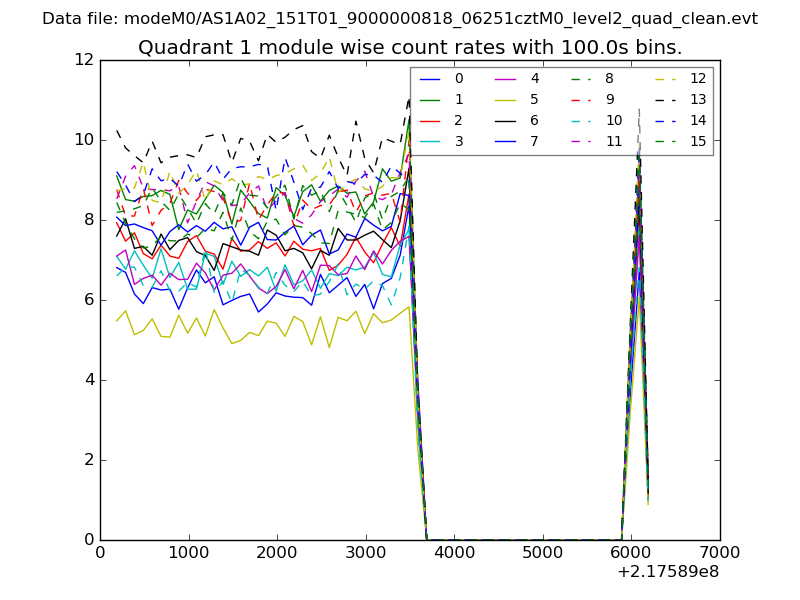
| Module-wise count rates for Quadrant A Data is divided into 100 sec bins |
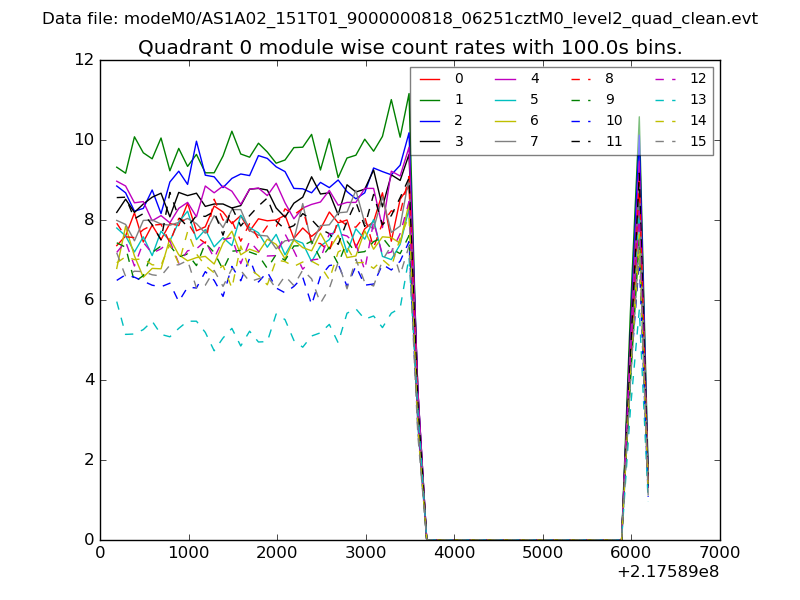 |
 |
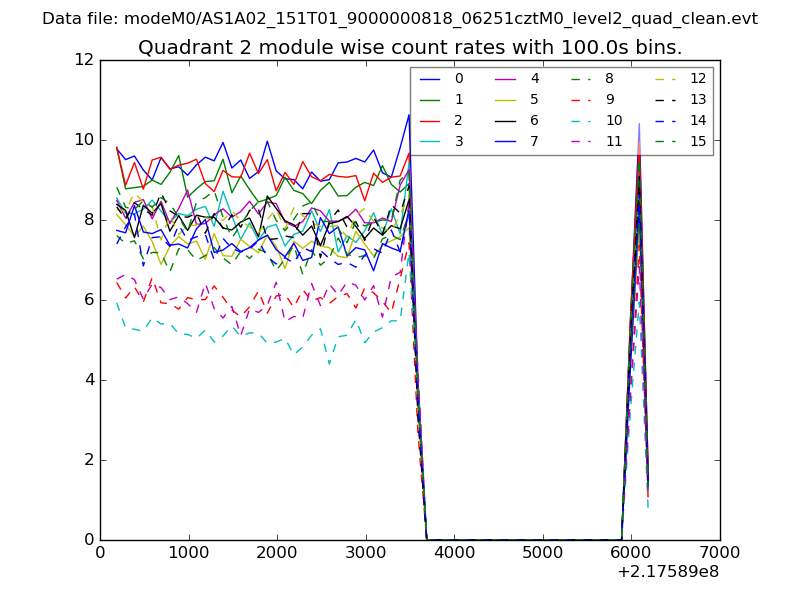
| Module-wise count rates for Quadrant B Data is divided into 100 sec bins |
 |
 |
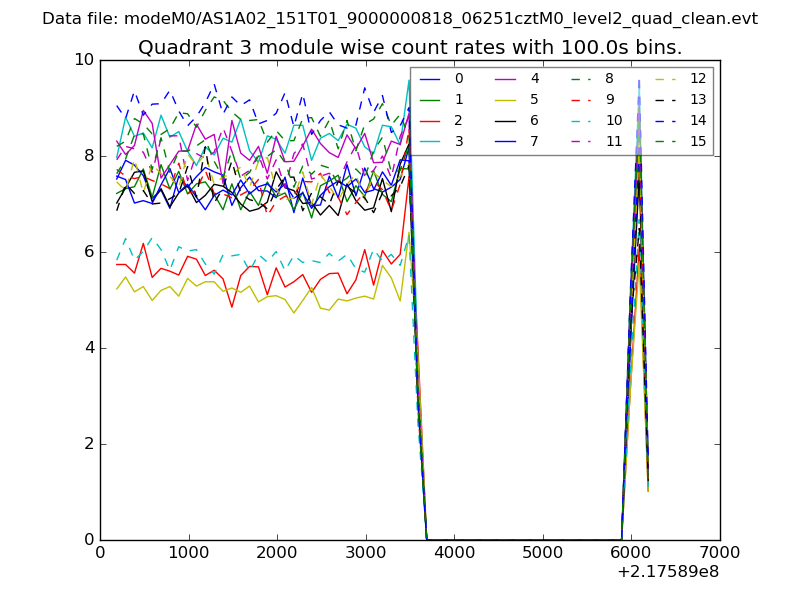
| Module-wise count rates for Quadrant C Data is divided into 100 sec bins |
 |
 |
| Module-wise count rates for Quadrant D Data is divided into 100 sec bins |
 |
 |
| Parameter | Plot |
|---|---|
| CZT HV Monitor | 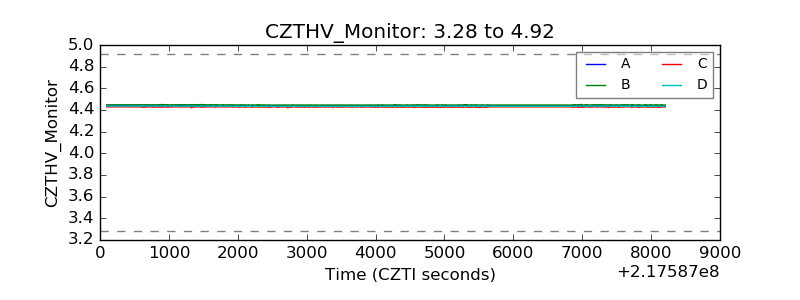 |
| D_VDD | 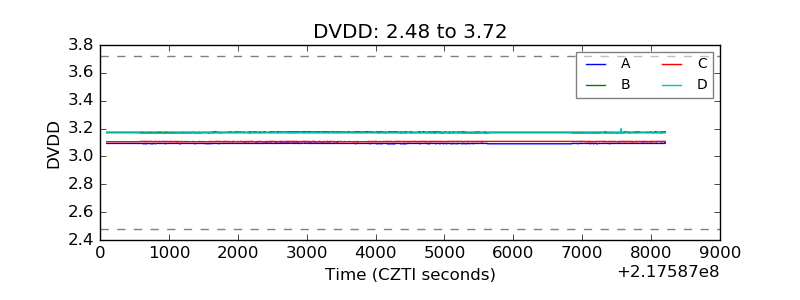 |
| Temperature 1 | 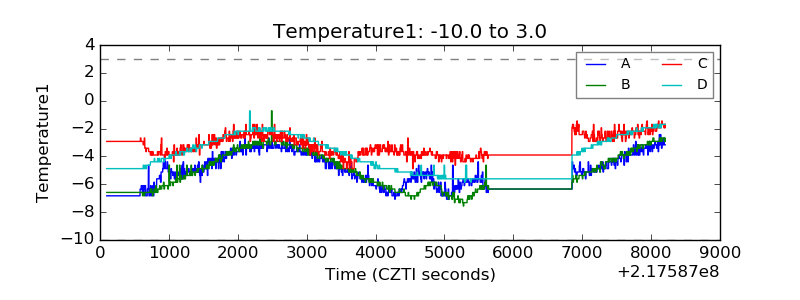 |
| Veto HV Monitor | 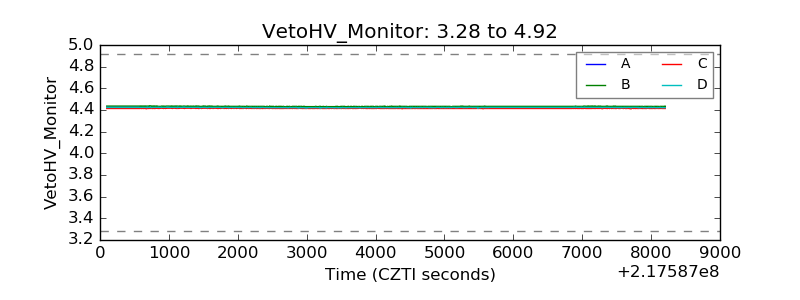 |
| Veto LLD | 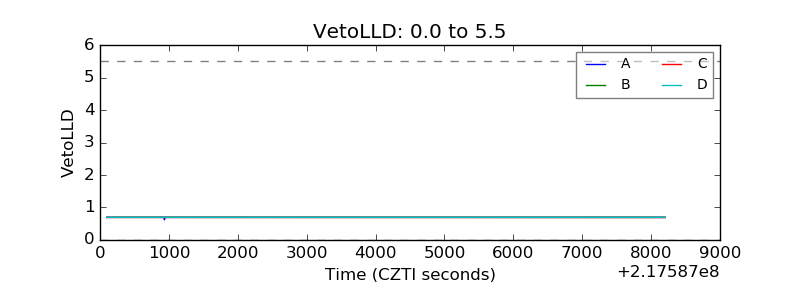 |
| Alpha Counter | 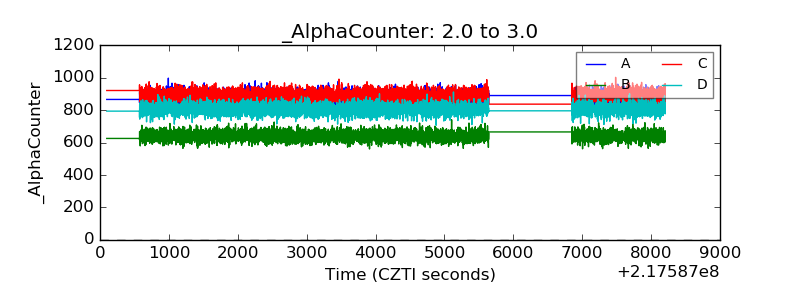 |
| _CPM_Rate | 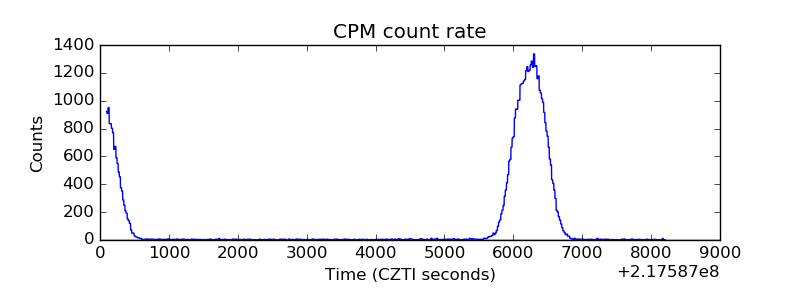 |
| CZT Counter |  |
| +2.5 Volts monitor |  |
| +5 Volts monitor |  |
| _ROLL_ROT | 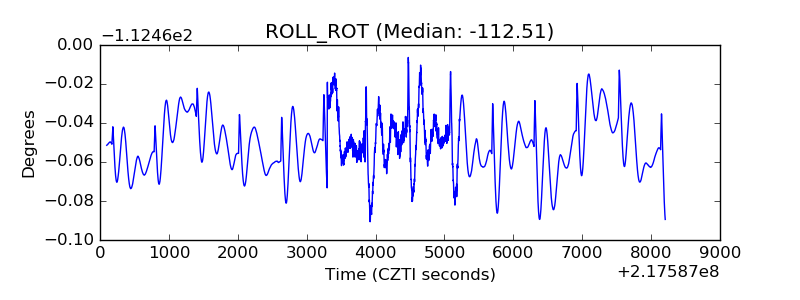 |
| _Roll_DEC | 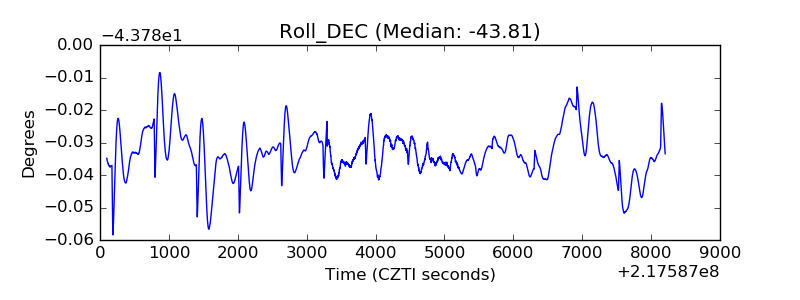 |
| _Roll_RA | 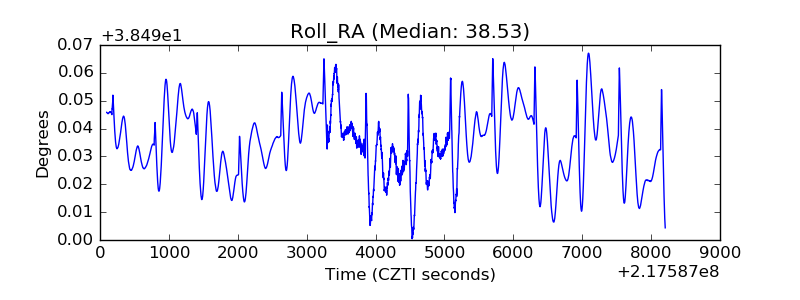 |
| Veto Counter | 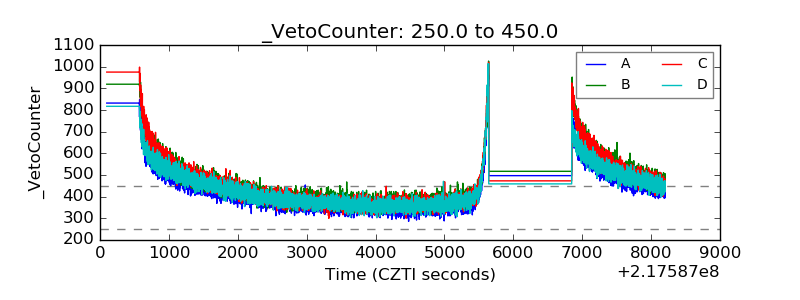 |