| Param | Original file | Final file |
|---|---|---|
| Filename | modeM0/AS1A02_151T01_9000000818_06252cztM0_level2.evt | modeM0/AS1A02_151T01_9000000818_06252cztM0_level2_quad_clean.evt |
| Size (bytes) | 465,408,000 | 86,204,160 |
| Size | 443.8 MB | 82.2 MB |
| Events in quadrant A | 3,054,990 | 550,635 |
| Events in quadrant B | 3,248,517 | 558,007 |
| Events in quadrant C | 2,964,252 | 547,123 |
| Events in quadrant D | 4,401,936 | 517,666 |
| Mode SS | |||
|---|---|---|---|
| Quadrant | BADHDUFLAG | Total packets | Discarded packets |
| A | 0 | 128 | 0 |
| B | 0 | 128 | 0 |
| C | 0 | 128 | 0 |
| D | 0 | 128 | 0 |
| Mode M9 | |||
|---|---|---|---|
| Quadrant | BADHDUFLAG | Total packets | Discarded packets |
| A | 0 | 22 | 0 |
| B | 0 | 22 | 0 |
| C | 0 | 22 | 0 |
| D | 0 | 23 | 0 |
| Mode M0 | |||
|---|---|---|---|
| Quadrant | BADHDUFLAG | Total packets | Discarded packets |
| A | 0 | 13135 | 3 |
| B | 0 | 13689 | 2 |
| C | 0 | 13037 | 2 |
| D | 0 | 17381 | 2 |
| Quadrant | Total seconds | Saturated seconds | Saturation percentage |
|---|---|---|---|
| A | 6257 | 73 | 1.166693% |
| B | 6257 | 78 | 1.246604% |
| C | 6257 | 39 | 0.623302% |
| D | 6257 | 266 | 4.251239% |
Noise dominated data is calculated using 1-second bins in cleaned event files. If a bin has >2000 counts, and if more than 50% of those come from <1% of pixels, then it is considered to be noise-dominated and hence unusable.
| Quadrant | # 1 sec bins | Bins with >0 counts | Bins with >2000 counts | High rate bins dominated by noise | Noise dominated (total time) | Noise dominated (detector-on time) | Marked lightcurve |
|---|---|---|---|---|---|---|---|
| A | 7542 | 6257 | 1 | 1 | 0.01% | 0.02% | 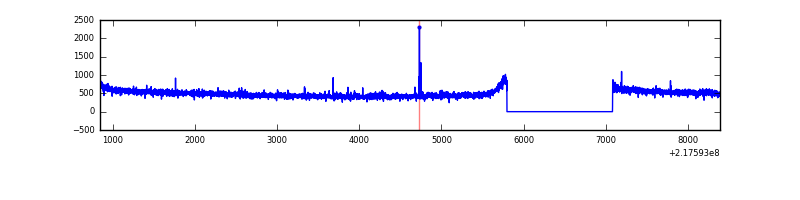 |
| B | 7542 | 6257 | 5 | 5 | 0.07% | 0.08% |  |
| C | 7542 | 6257 | 0 | 0 | 0.00% | 0.00% |  |
| D | 7542 | 6257 | 178 | 178 | 2.36% | 2.84% | 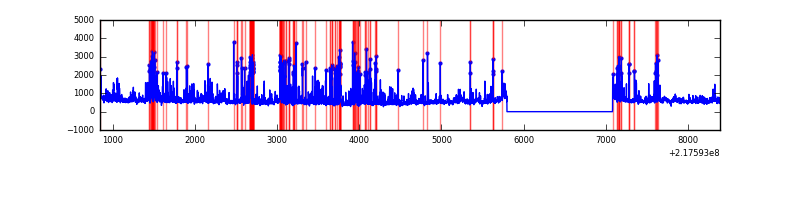 |
Top three noisy pixels from each quadrant. If the there are fewer than three noisy pixels in the level2.evt file, extra rows are filled as -1
| Pixel properties | Quadrant properties | ||||||
|---|---|---|---|---|---|---|---|
| Quadrant | DetID | PixID | Counts | Sigma | Mean | Median | Sigma |
| A | 4 | 2 | 7732 | 44.09 | 787 | 769 | 157.9 |
| A | 12 | 194 | 7601 | 43.26 | 787 | 769 | 157.9 |
| A | 0 | 226 | 7530 | 42.81 | 787 | 769 | 157.9 |
| B | 3 | 64 | 95960 | 644.11 | 789 | 774 | 147.8 |
| B | 4 | 81 | 57017 | 380.59 | 789 | 774 | 147.8 |
| B | 15 | 204 | 29684 | 195.63 | 789 | 774 | 147.8 |
| C | 13 | 61 | 6019 | 30.15 | 759 | 763 | 174.3 |
| C | 9 | 54 | 4206 | 19.75 | 759 | 763 | 174.3 |
| C | 3 | 202 | 1898 | 6.51 | 759 | 763 | 174.3 |
| D | 12 | 220 | 1062105 | 5731.63 | 755 | 732 | 185.2 |
| D | 2 | 63 | 150603 | 809.33 | 755 | 732 | 185.2 |
| D | 2 | 152 | 77117 | 412.49 | 755 | 732 | 185.2 |
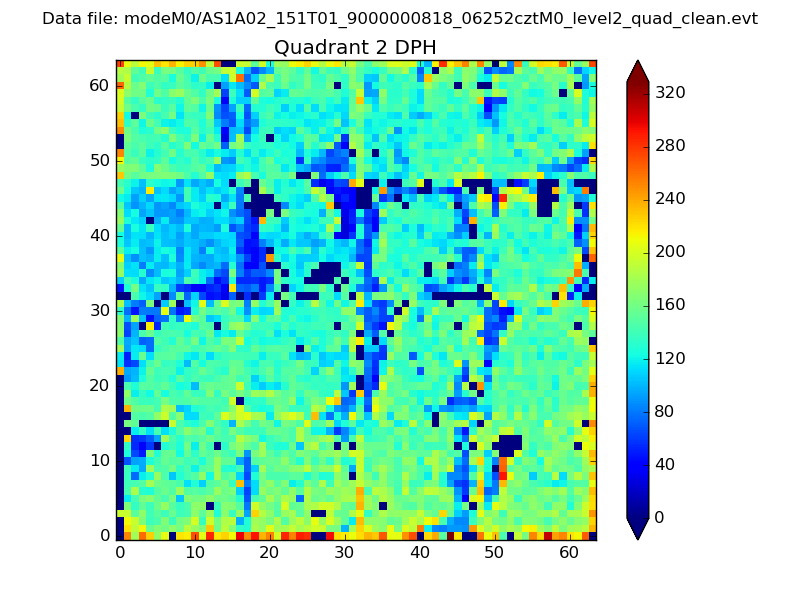
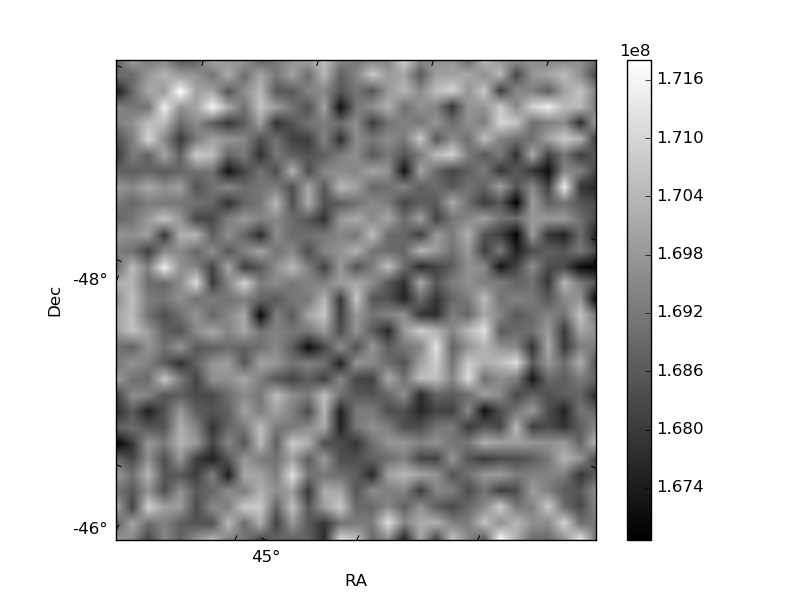
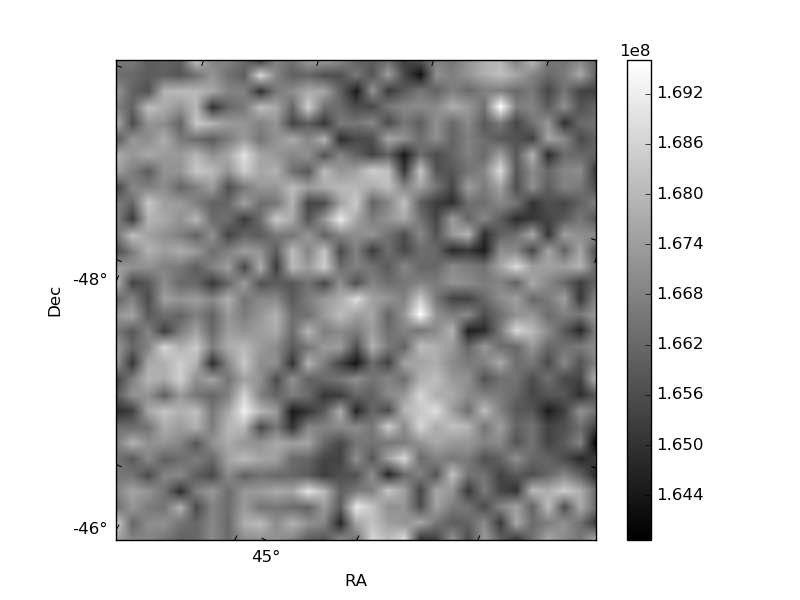
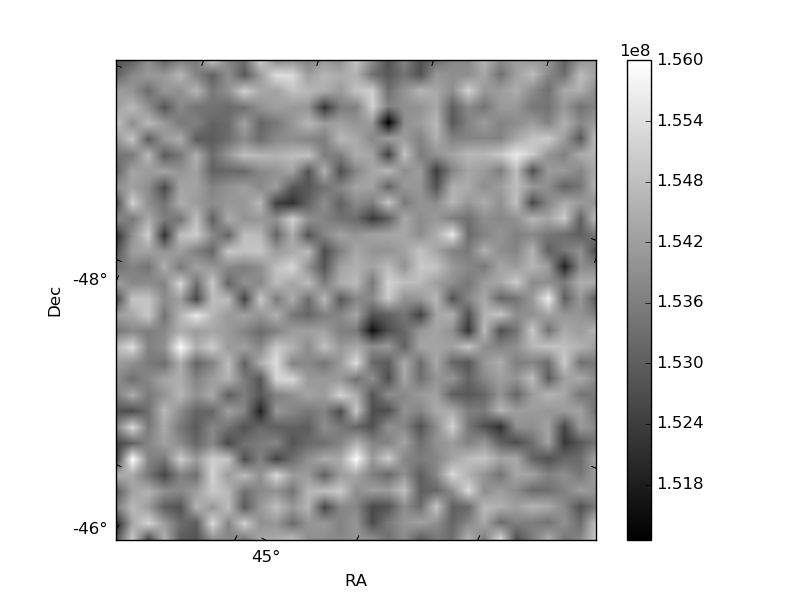
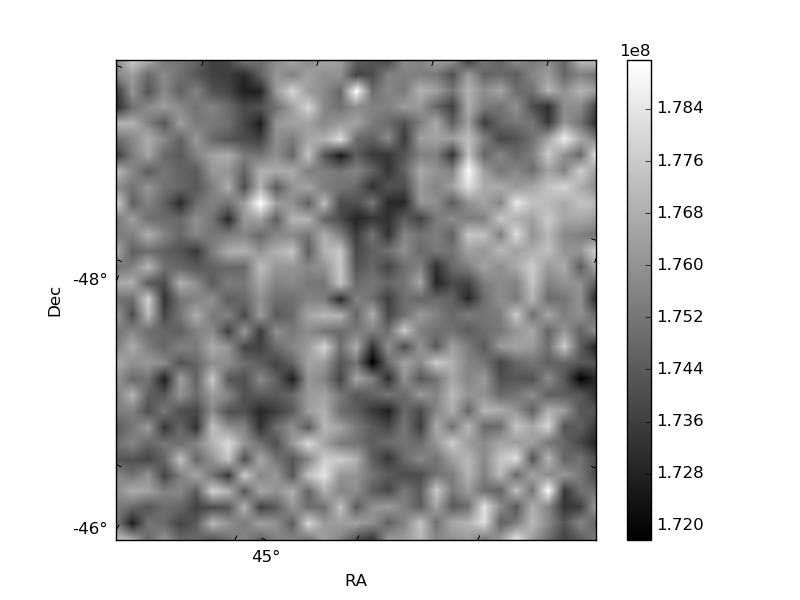
Histogram calculated using DETX and DETY for each event in the final _common_clean file
| Quadrant A | 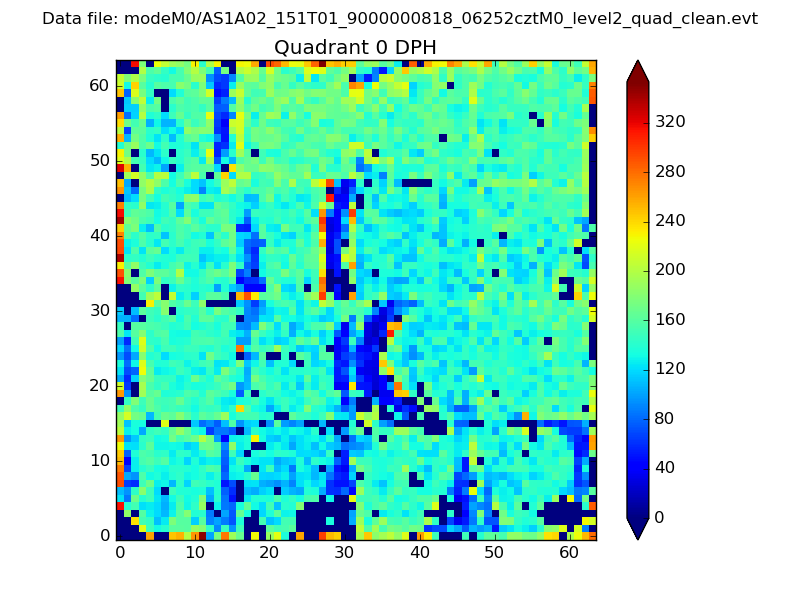 |
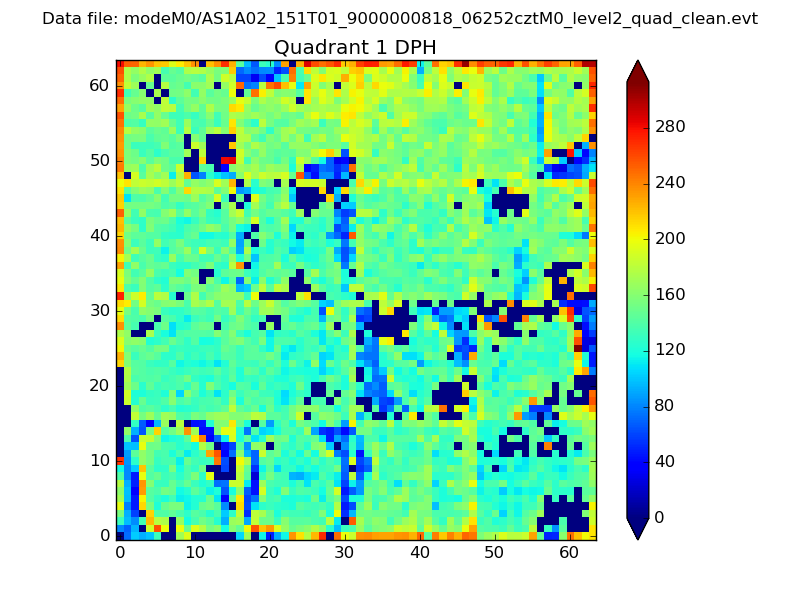 |
Quadrant B |
|---|---|---|---|
| Quadrant D | 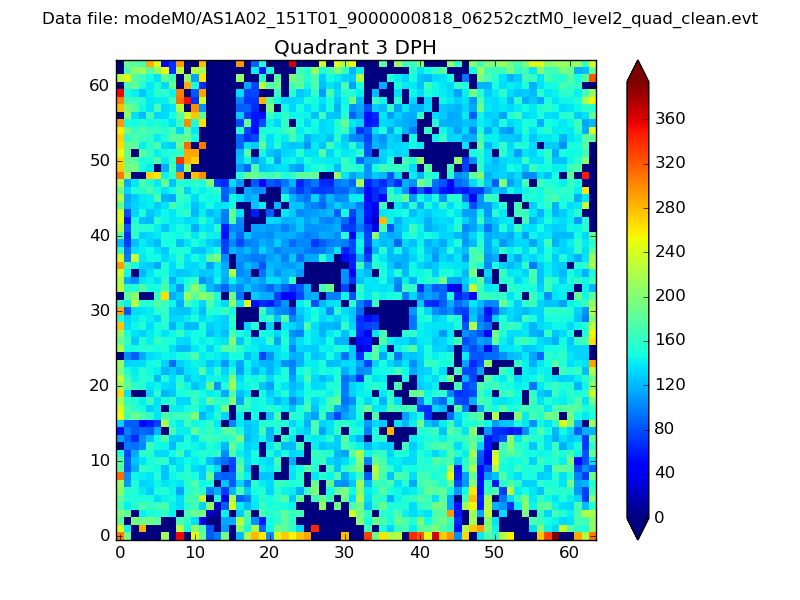 |
 |
Quadrant C |
| Plot type | Count rate plots | Images |
|---|---|---|
| Comparison with Poisson distribution Blue bars denote a histogram of data divided into 1 sec bins. Red curve is a Poisson curve with rate = median count rate of data. |
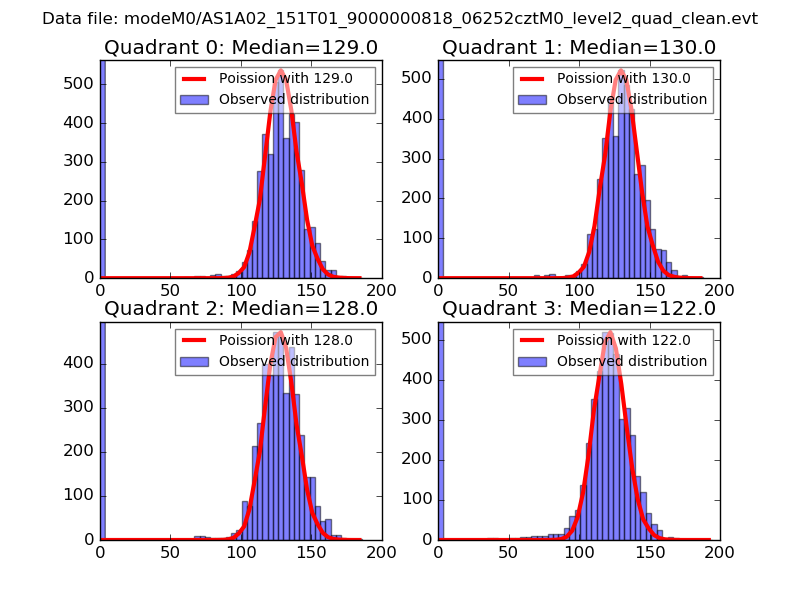 |
 |
| Quadrant-wise count rates Data is divided into 100 sec bins |
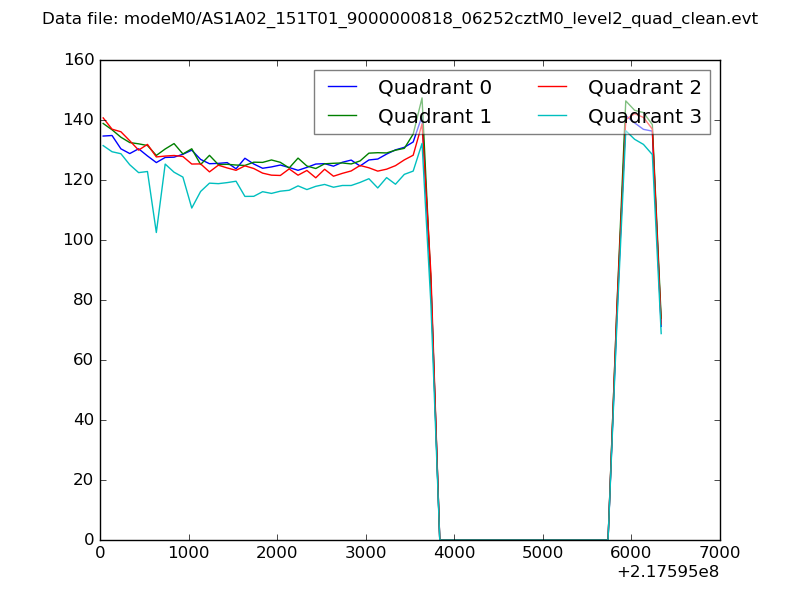 |
|
| Module-wise count rates for Quadrant A Data is divided into 100 sec bins |
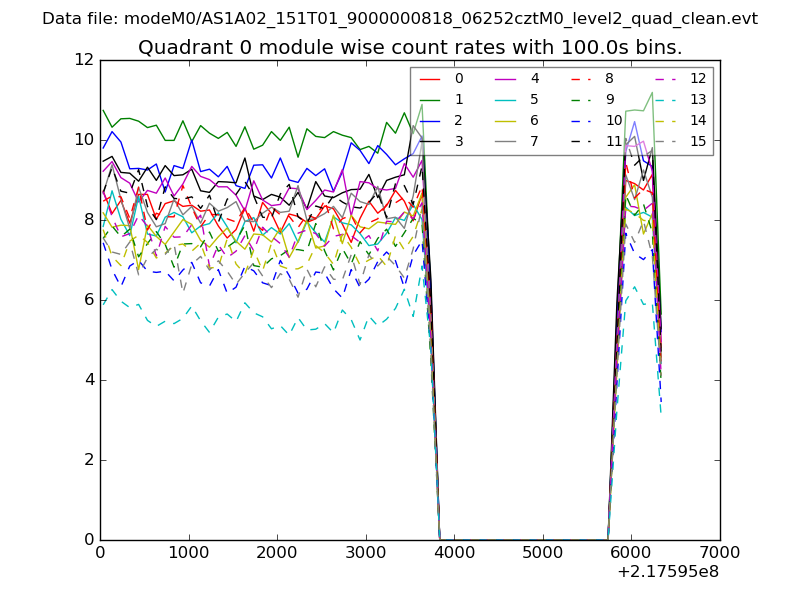 |
 |
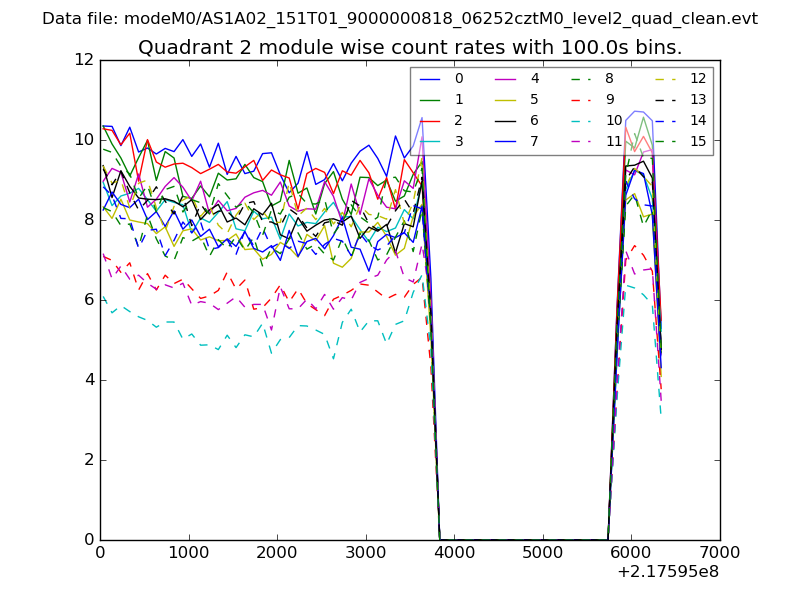
| Module-wise count rates for Quadrant B Data is divided into 100 sec bins |
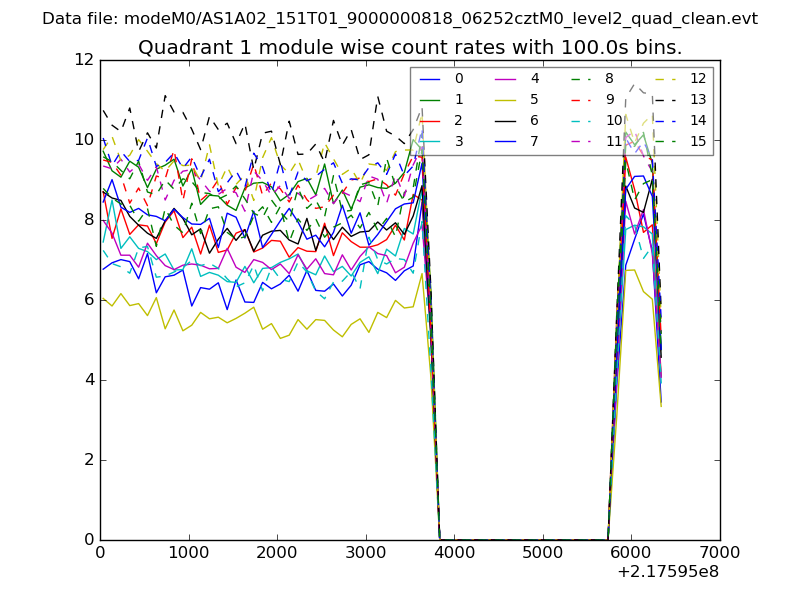 |
 |
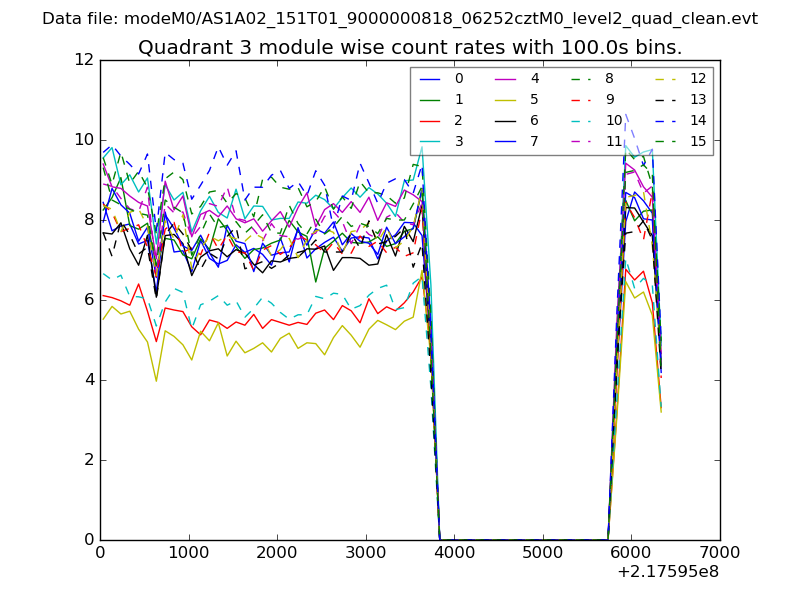
| Module-wise count rates for Quadrant C Data is divided into 100 sec bins |
 |
 |
| Module-wise count rates for Quadrant D Data is divided into 100 sec bins |
 |
 |
| Parameter | Plot |
|---|---|
| CZT HV Monitor | 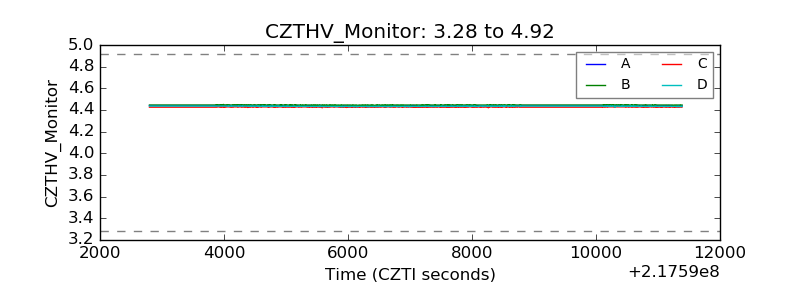 |
| D_VDD | 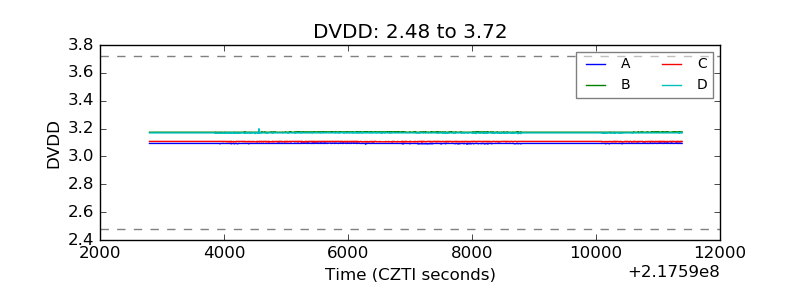 |
| Temperature 1 | 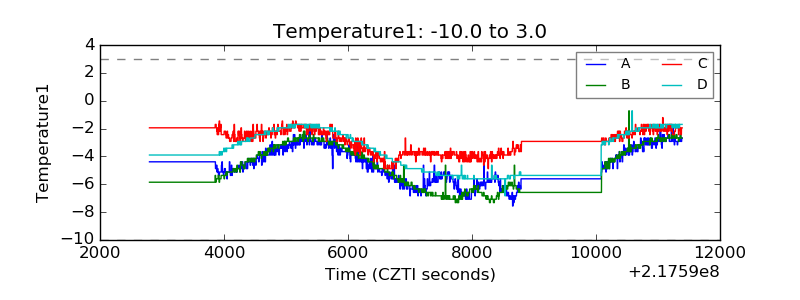 |
| Veto HV Monitor | 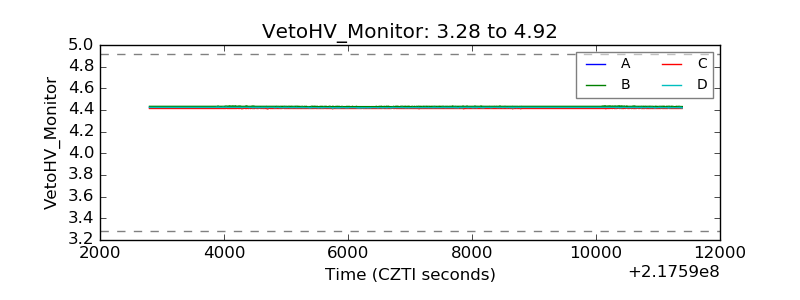 |
| Veto LLD |  |
| Alpha Counter | 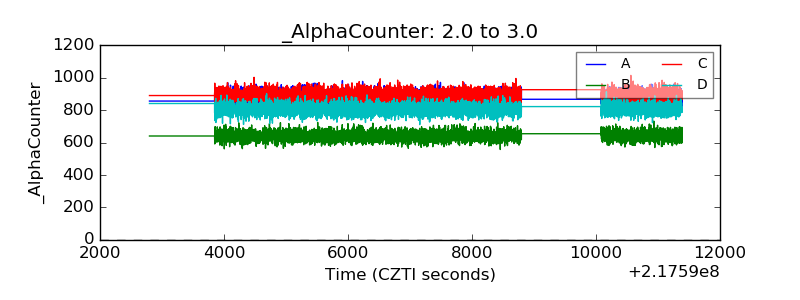 |
| _CPM_Rate | 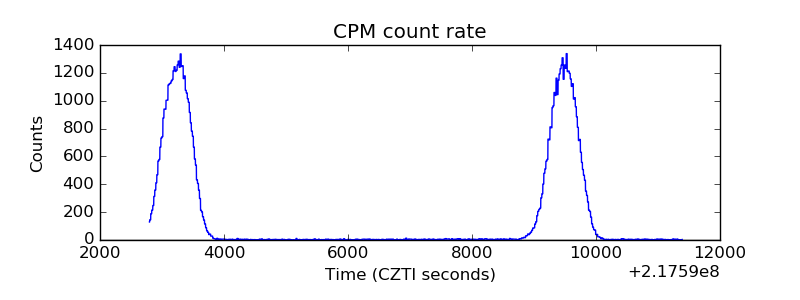 |
| CZT Counter | 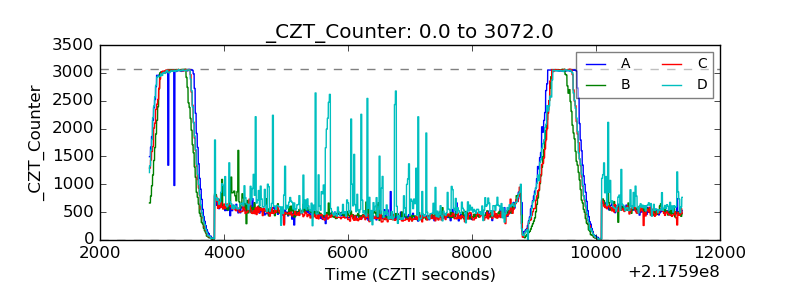 |
| +2.5 Volts monitor |  |
| +5 Volts monitor |  |
| _ROLL_ROT | 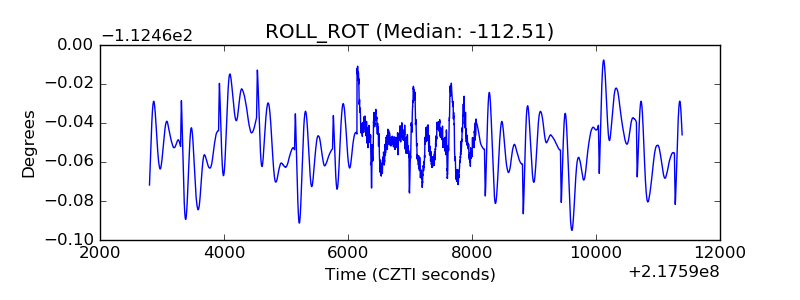 |
| _Roll_DEC | 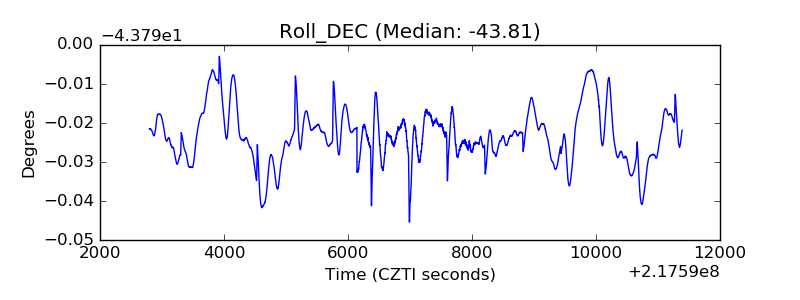 |
| _Roll_RA | 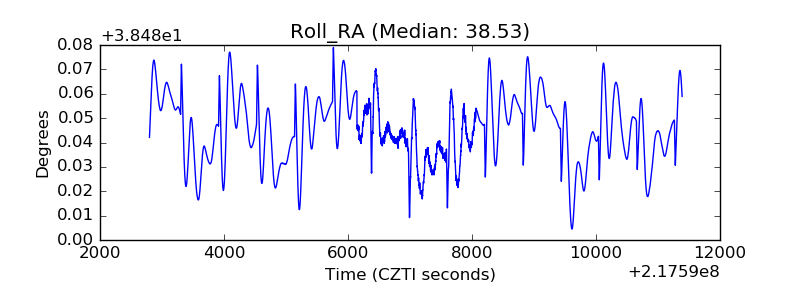 |
| Veto Counter | 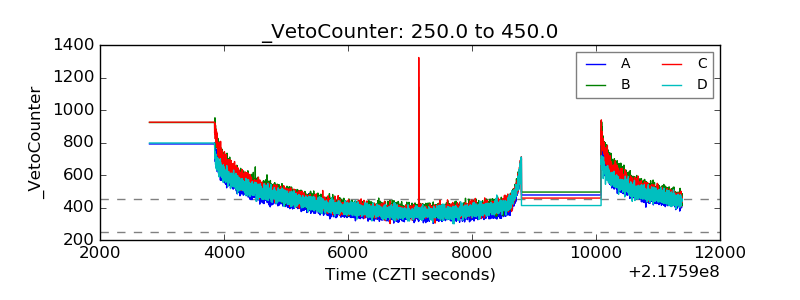 |