| Param | Original file | Final file |
|---|---|---|
| Filename | modeM0/AS1A02_151T01_9000000818_06254cztM0_level2.evt | modeM0/AS1A02_151T01_9000000818_06254cztM0_level2_quad_clean.evt |
| Size (bytes) | 2,352,836,160 | 457,349,760 |
| Size | 2.2 GB | 436.2 MB |
| Events in quadrant A | 16,800,325 | 2,867,657 |
| Events in quadrant B | 17,314,421 | 2,886,926 |
| Events in quadrant C | 15,767,838 | 2,855,829 |
| Events in quadrant D | 18,916,868 | 2,745,636 |
| Mode SS | |||
|---|---|---|---|
| Quadrant | BADHDUFLAG | Total packets | Discarded packets |
| A | 0 | 740 | 0 |
| B | 0 | 740 | 0 |
| C | 0 | 740 | 0 |
| D | 0 | 740 | 0 |
| Mode M9 | |||
|---|---|---|---|
| Quadrant | BADHDUFLAG | Total packets | Discarded packets |
| A | 0 | 57 | 0 |
| B | 0 | 57 | 0 |
| C | 0 | 57 | 0 |
| D | 0 | 58 | 0 |
| Mode M0 | |||
|---|---|---|---|
| Quadrant | BADHDUFLAG | Total packets | Discarded packets |
| A | 0 | 75118 | 9 |
| B | 0 | 76668 | 8 |
| C | 0 | 73787 | 8 |
| D | 0 | 81209 | 8 |
| Quadrant | Total seconds | Saturated seconds | Saturation percentage |
|---|---|---|---|
| A | 36351 | 352 | 0.968336% |
| B | 36351 | 604 | 1.661577% |
| C | 36351 | 259 | 0.712498% |
| D | 36351 | 506 | 1.391984% |
Noise dominated data is calculated using 1-second bins in cleaned event files. If a bin has >2000 counts, and if more than 50% of those come from <1% of pixels, then it is considered to be noise-dominated and hence unusable.
| Quadrant | # 1 sec bins | Bins with >0 counts | Bins with >2000 counts | High rate bins dominated by noise | Noise dominated (total time) | Noise dominated (detector-on time) | Marked lightcurve |
|---|---|---|---|---|---|---|---|
| A | 64811 | 36355 | 10 | 10 | 0.02% | 0.03% | 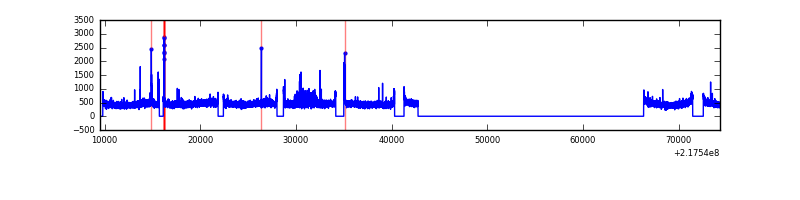 |
| B | 64811 | 36355 | 197 | 197 | 0.30% | 0.54% | 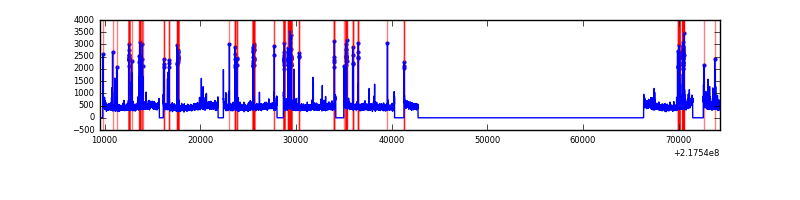 |
| C | 64811 | 36355 | 0 | 0 | 0.00% | 0.00% | 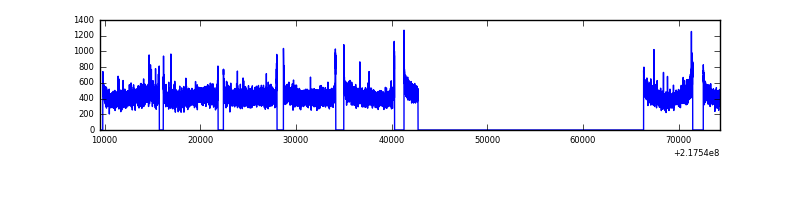 |
| D | 64811 | 36355 | 199 | 199 | 0.31% | 0.55% |  |
Top three noisy pixels from each quadrant. If the there are fewer than three noisy pixels in the level2.evt file, extra rows are filled as -1
| Pixel properties | Quadrant properties | ||||||
|---|---|---|---|---|---|---|---|
| Quadrant | DetID | PixID | Counts | Sigma | Mean | Median | Sigma |
| A | 15 | 236 | 676324 | 799.76 | 4148 | 4056 | 840.6 |
| A | 4 | 2 | 69520 | 77.88 | 4148 | 4056 | 840.6 |
| A | 8 | 15 | 54860 | 60.44 | 4148 | 4056 | 840.6 |
| B | 0 | 219 | 594081 | 744.96 | 4180 | 4075 | 792.0 |
| B | 3 | 64 | 296182 | 368.82 | 4180 | 4075 | 792.0 |
| B | 4 | 81 | 88699 | 106.85 | 4180 | 4075 | 792.0 |
| C | 13 | 61 | 31574 | 29.79 | 4037 | 4049 | 923.9 |
| C | 8 | 222 | 16370 | 13.34 | 4037 | 4049 | 923.9 |
| C | 14 | 67 | 10545 | 7.03 | 4037 | 4049 | 923.9 |
| D | 2 | 63 | 1125830 | 1149.19 | 4028 | 3899 | 976.3 |
| D | 12 | 220 | 1111287 | 1134.29 | 4028 | 3899 | 976.3 |
| D | 2 | 152 | 563735 | 573.44 | 4028 | 3899 | 976.3 |
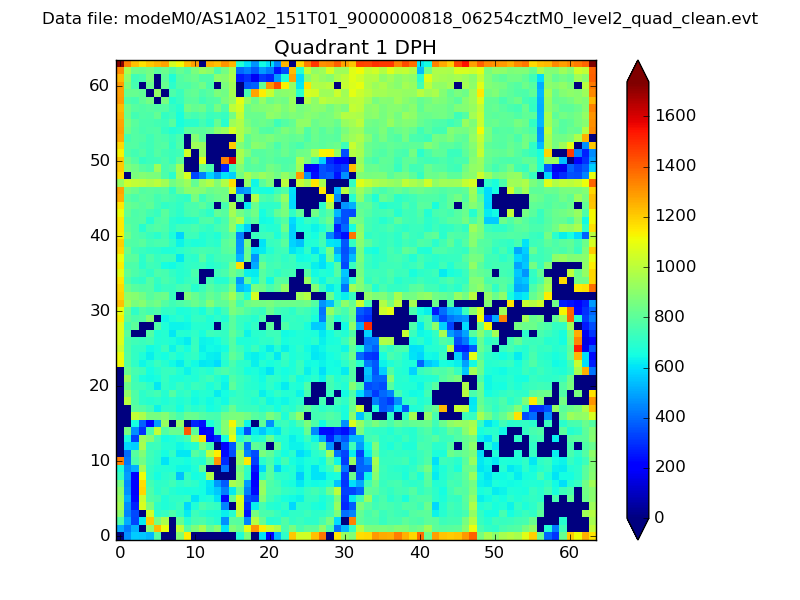
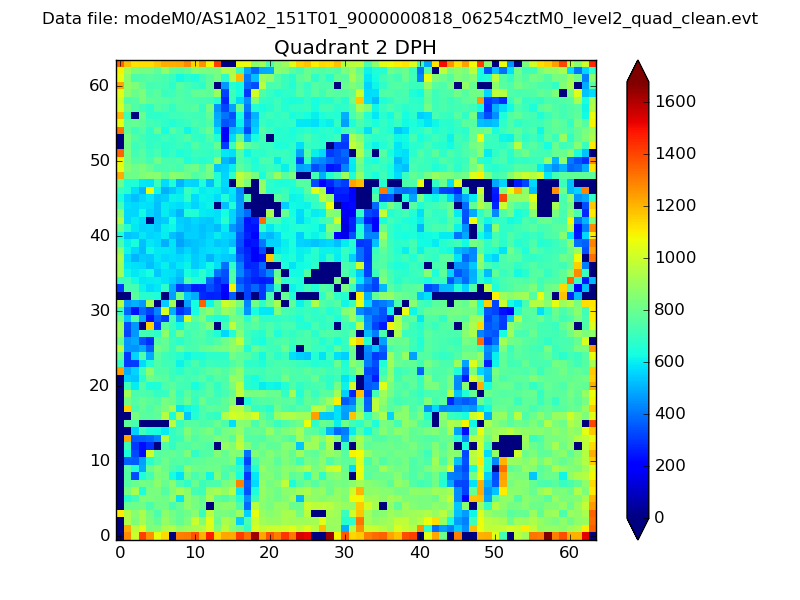
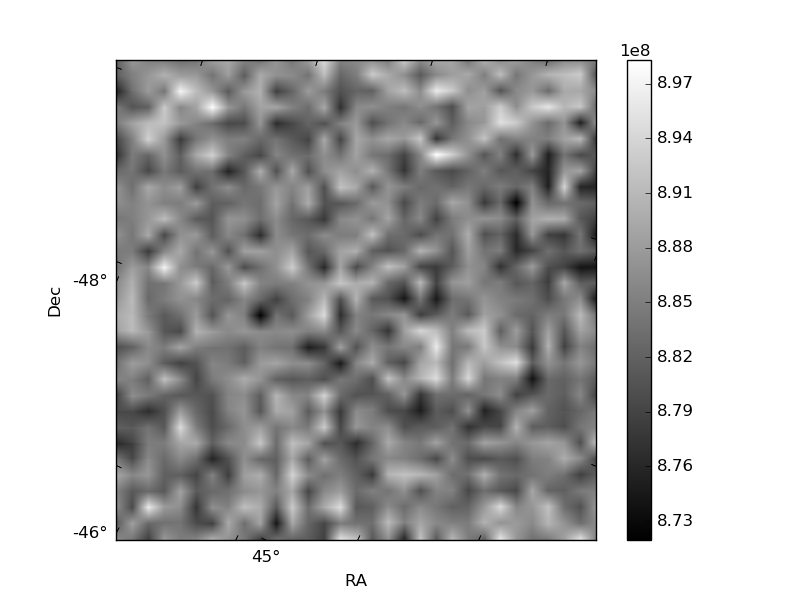
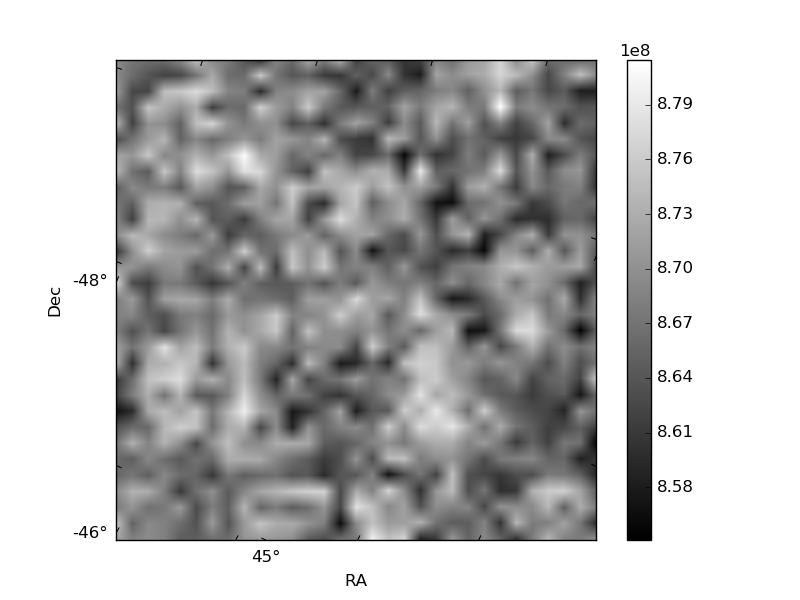
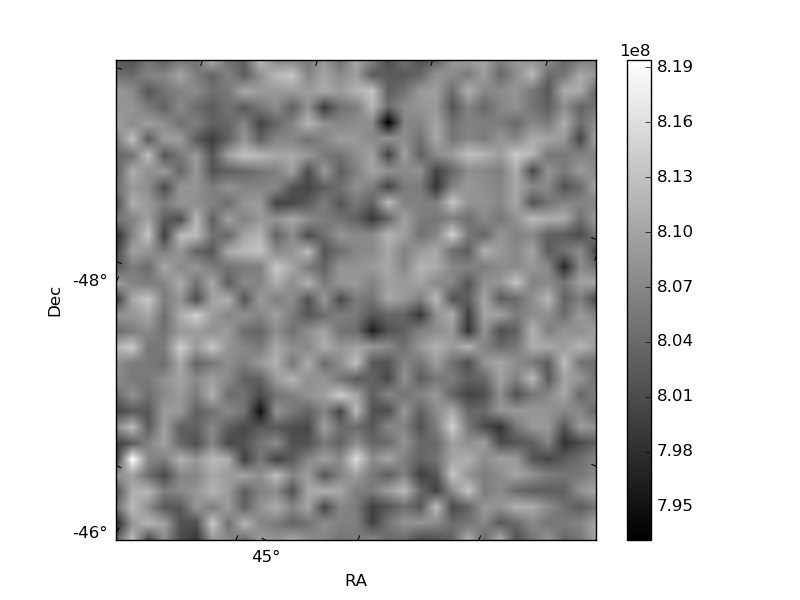
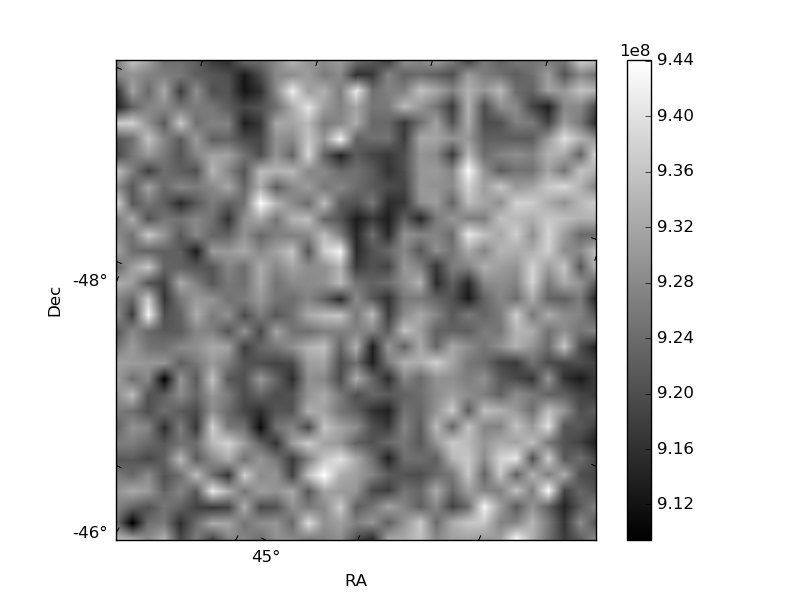
Histogram calculated using DETX and DETY for each event in the final _common_clean file
| Quadrant A | 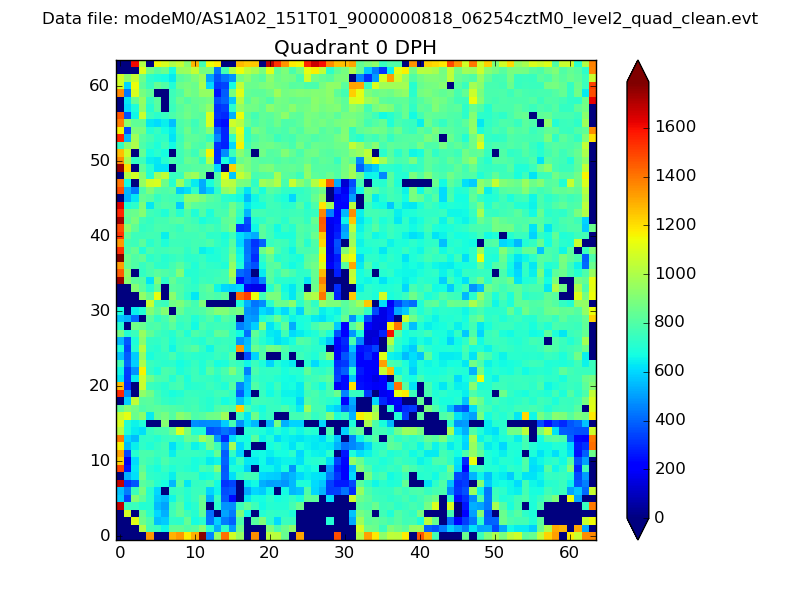 |
 |
Quadrant B |
|---|---|---|---|
| Quadrant D | 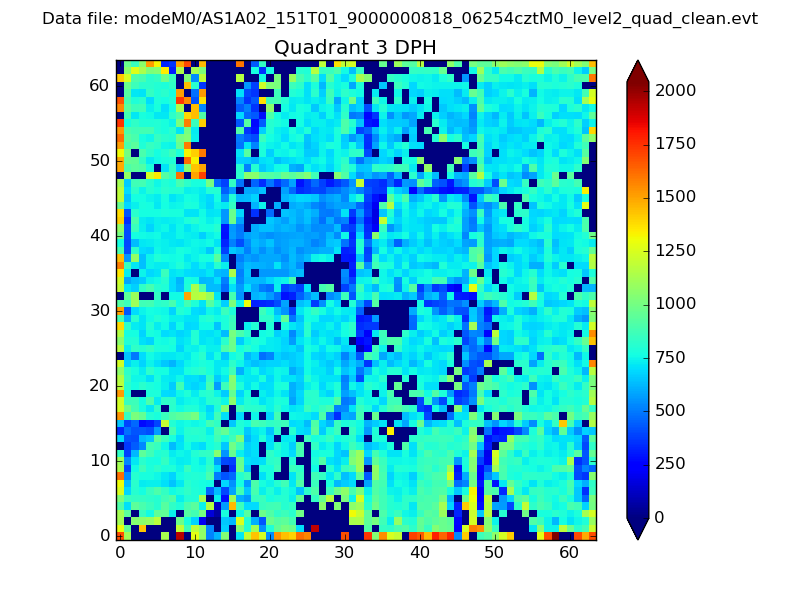 |
 |
Quadrant C |
| Plot type | Count rate plots | Images |
|---|---|---|
| Comparison with Poisson distribution Blue bars denote a histogram of data divided into 1 sec bins. Red curve is a Poisson curve with rate = median count rate of data. |
 |
 |
| Quadrant-wise count rates Data is divided into 100 sec bins |
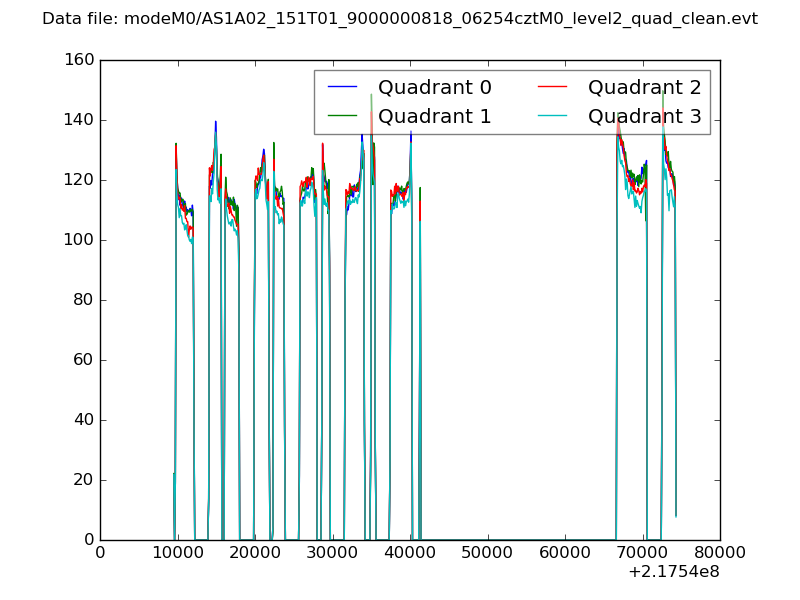 |
|
| Module-wise count rates for Quadrant A Data is divided into 100 sec bins |
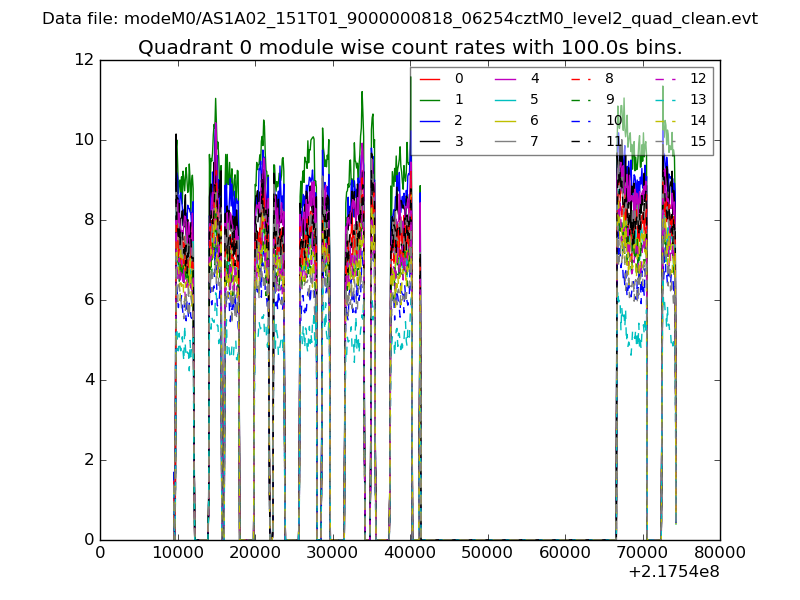 |
 |
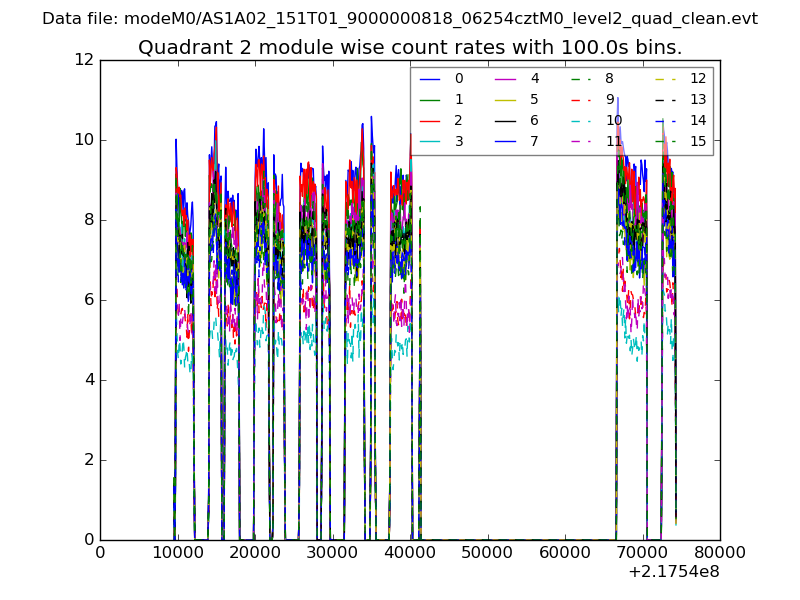
| Module-wise count rates for Quadrant B Data is divided into 100 sec bins |
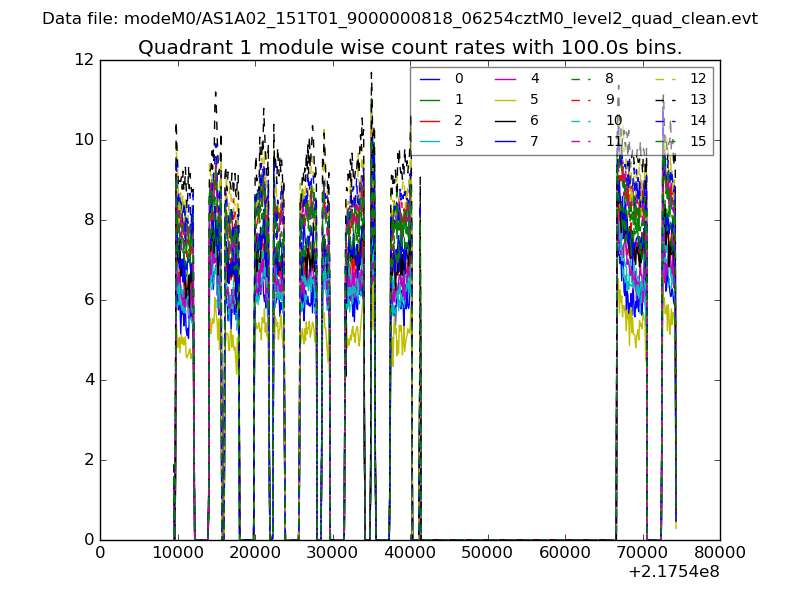 |
 |
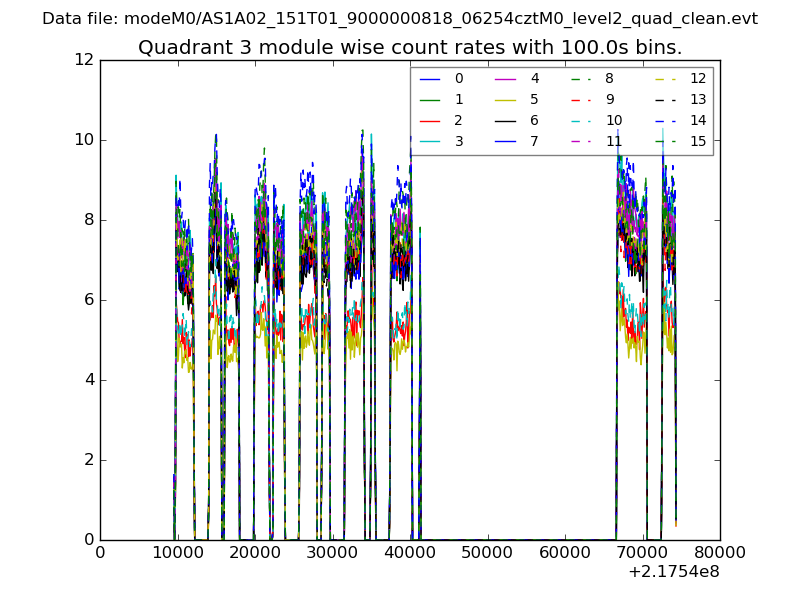
| Module-wise count rates for Quadrant C Data is divided into 100 sec bins |
 |
 |
| Module-wise count rates for Quadrant D Data is divided into 100 sec bins |
 |
 |
| Parameter | Plot |
|---|---|
| CZT HV Monitor | 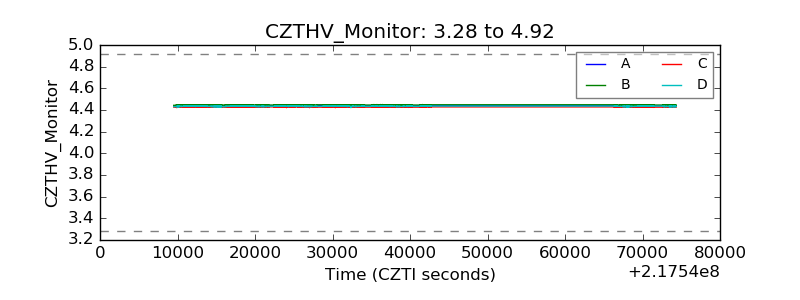 |
| D_VDD | 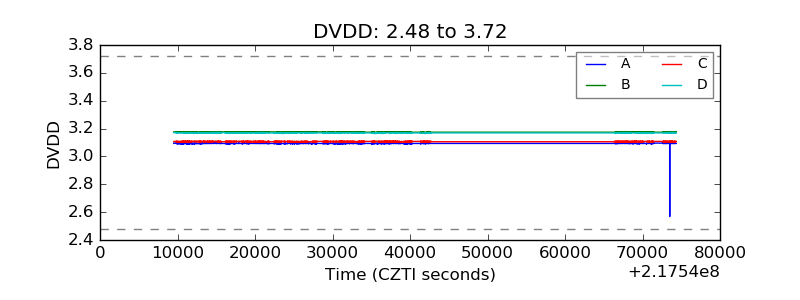 |
| Temperature 1 | 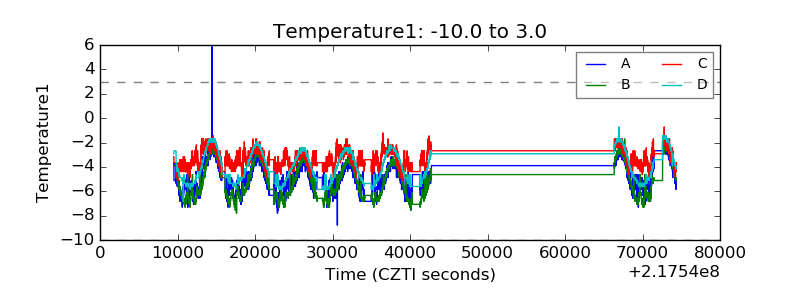 |
| Veto HV Monitor | 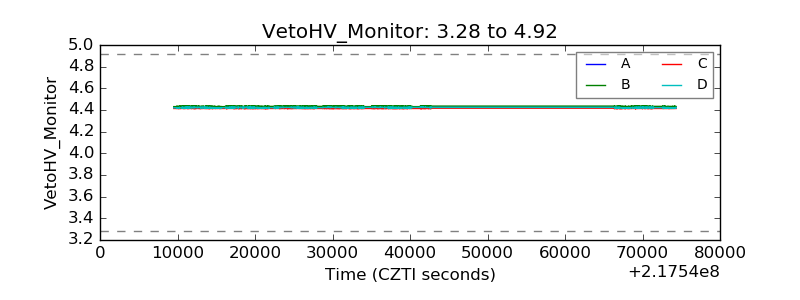 |
| Veto LLD | 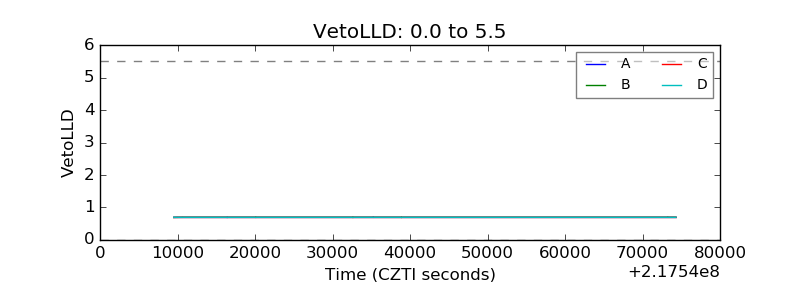 |
| Alpha Counter | 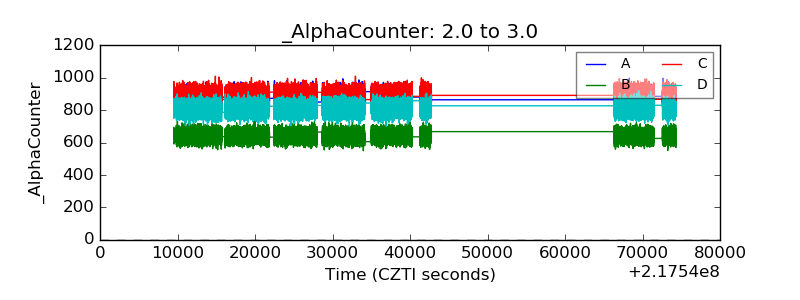 |
| _CPM_Rate | 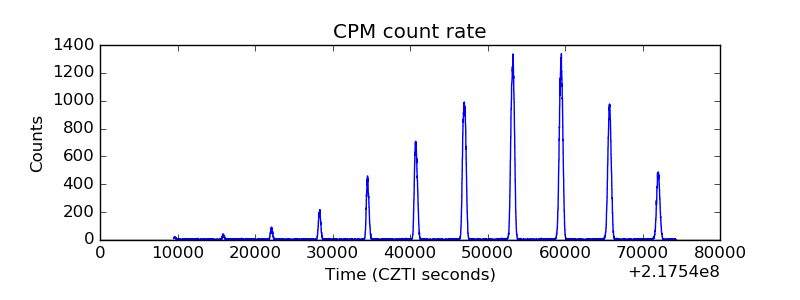 |
| CZT Counter | 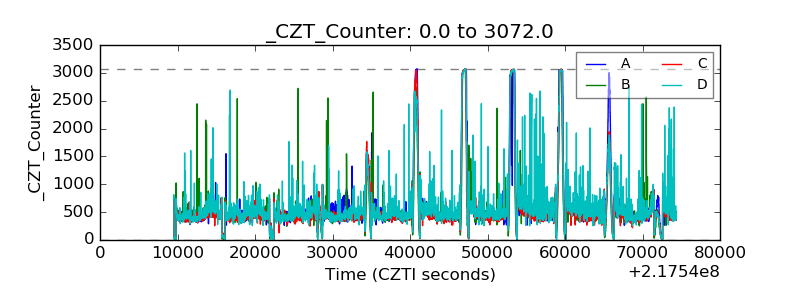 |
| +2.5 Volts monitor |  |
| +5 Volts monitor |  |
| _ROLL_ROT | 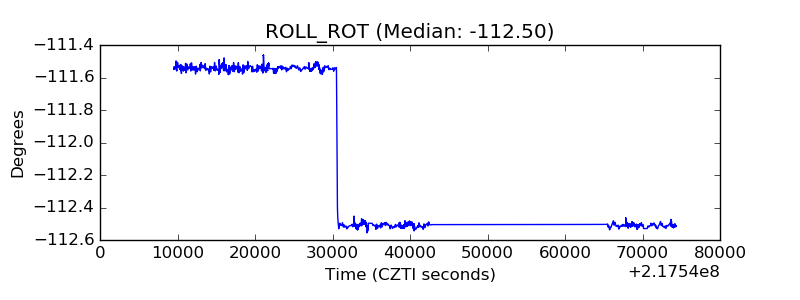 |
| _Roll_DEC | 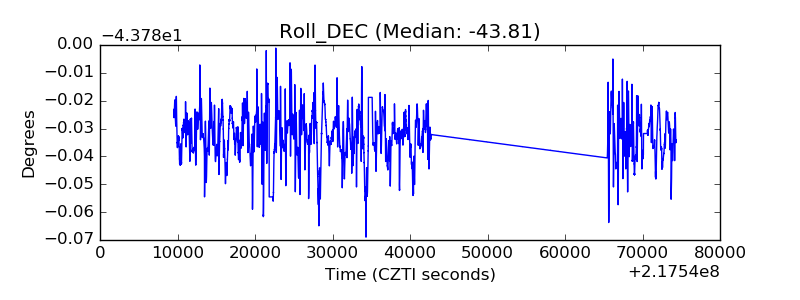 |
| _Roll_RA | 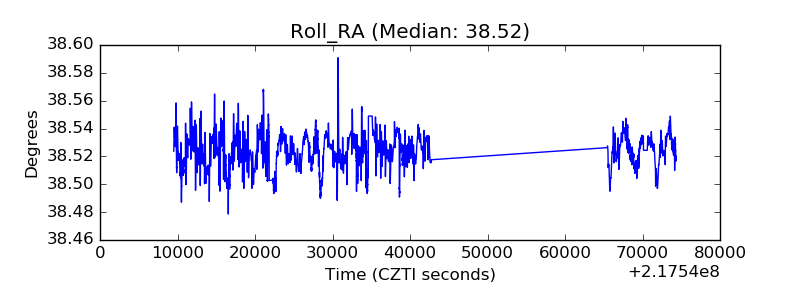 |
| Veto Counter | 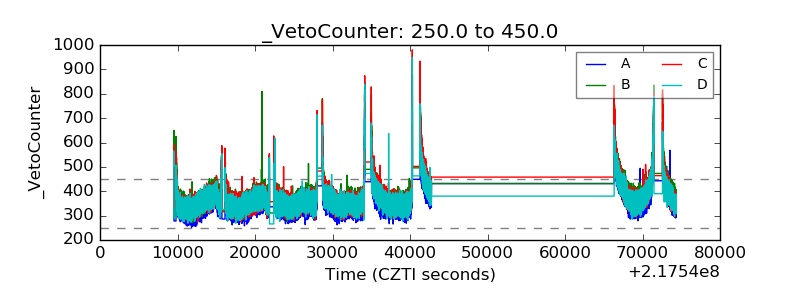 |