| Param | Original file | Final file |
|---|---|---|
| Filename | modeM0/AS1A02_151T01_9000000818_06256cztM0_level2.evt | modeM0/AS1A02_151T01_9000000818_06256cztM0_level2_quad_clean.evt |
| Size (bytes) | 509,172,480 | 97,248,960 |
| Size | 485.6 MB | 92.7 MB |
| Events in quadrant A | 3,228,603 | 623,623 |
| Events in quadrant B | 3,304,428 | 627,734 |
| Events in quadrant C | 3,156,584 | 615,137 |
| Events in quadrant D | 5,239,294 | 574,855 |
| Mode SS | |||
|---|---|---|---|
| Quadrant | BADHDUFLAG | Total packets | Discarded packets |
| A | 0 | 146 | 0 |
| B | 0 | 146 | 0 |
| C | 0 | 146 | 0 |
| D | 0 | 146 | 0 |
| Mode M9 | |||
|---|---|---|---|
| Quadrant | BADHDUFLAG | Total packets | Discarded packets |
| A | 0 | 7 | 0 |
| B | 0 | 7 | 0 |
| C | 0 | 7 | 0 |
| D | 0 | 8 | 0 |
| Mode M0 | |||
|---|---|---|---|
| Quadrant | BADHDUFLAG | Total packets | Discarded packets |
| A | 0 | 14883 | 3 |
| B | 0 | 14923 | 2 |
| C | 0 | 14815 | 2 |
| D | 0 | 20729 | 2 |
| Quadrant | Total seconds | Saturated seconds | Saturation percentage |
|---|---|---|---|
| A | 7236 | 49 | 0.677170% |
| B | 7236 | 53 | 0.732449% |
| C | 7236 | 26 | 0.359315% |
| D | 7236 | 421 | 5.818132% |
Noise dominated data is calculated using 1-second bins in cleaned event files. If a bin has >2000 counts, and if more than 50% of those come from <1% of pixels, then it is considered to be noise-dominated and hence unusable.
| Quadrant | # 1 sec bins | Bins with >0 counts | Bins with >2000 counts | High rate bins dominated by noise | Noise dominated (total time) | Noise dominated (detector-on time) | Marked lightcurve |
|---|---|---|---|---|---|---|---|
| A | 7741 | 7237 | 0 | 0 | 0.00% | 0.00% | 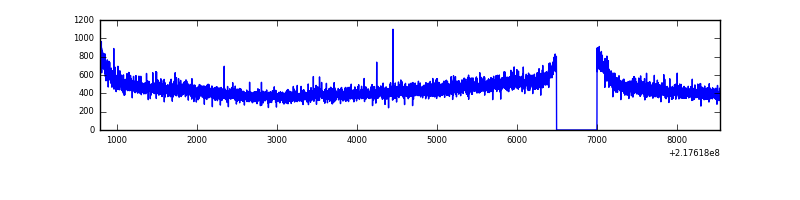 |
| B | 7741 | 7237 | 0 | 0 | 0.00% | 0.00% | 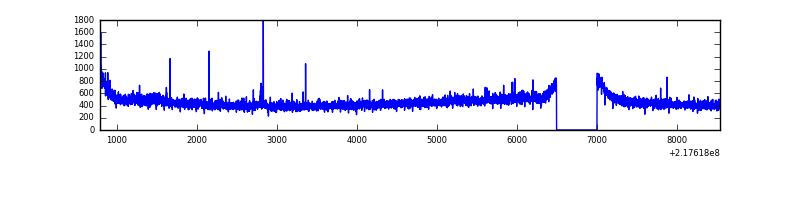 |
| C | 7741 | 7237 | 0 | 0 | 0.00% | 0.00% | 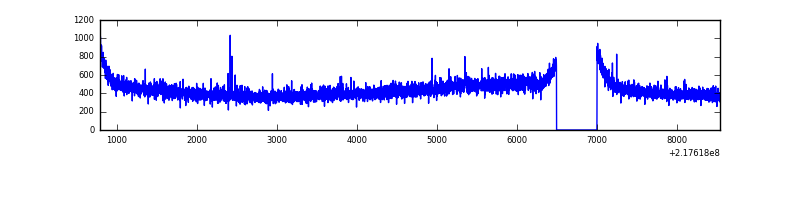 |
| D | 7741 | 7237 | 334 | 334 | 4.31% | 4.62% | 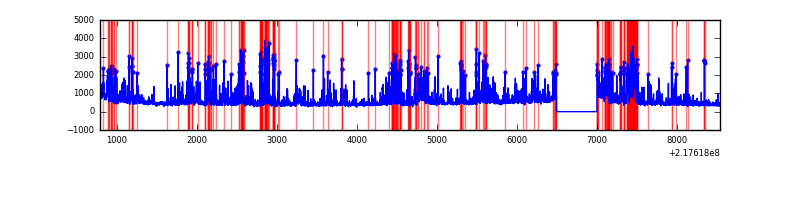 |
Top three noisy pixels from each quadrant. If the there are fewer than three noisy pixels in the level2.evt file, extra rows are filled as -1
| Pixel properties | Quadrant properties | ||||||
|---|---|---|---|---|---|---|---|
| Quadrant | DetID | PixID | Counts | Sigma | Mean | Median | Sigma |
| A | 8 | 15 | 18585 | 104.08 | 830 | 811 | 170.8 |
| A | 0 | 226 | 8220 | 43.38 | 830 | 811 | 170.8 |
| A | 12 | 194 | 8013 | 42.17 | 830 | 811 | 170.8 |
| B | 15 | 204 | 17517 | 102.59 | 840 | 818 | 162.8 |
| B | 12 | 111 | 15772 | 91.87 | 840 | 818 | 162.8 |
| B | 11 | 111 | 12439 | 71.39 | 840 | 818 | 162.8 |
| C | 8 | 128 | 10684 | 52.92 | 802 | 804 | 186.7 |
| C | 9 | 54 | 9043 | 44.13 | 802 | 804 | 186.7 |
| C | 13 | 61 | 6416 | 30.06 | 802 | 804 | 186.7 |
| D | 12 | 220 | 1745815 | 9059.0 | 785 | 762 | 192.6 |
| D | 13 | 137 | 206017 | 1065.53 | 785 | 762 | 192.6 |
| D | 2 | 206 | 107945 | 556.41 | 785 | 762 | 192.6 |
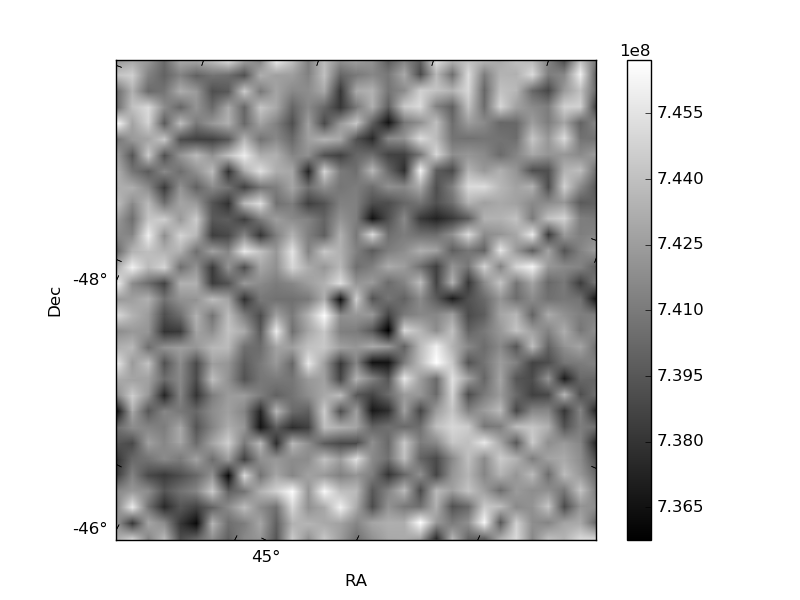
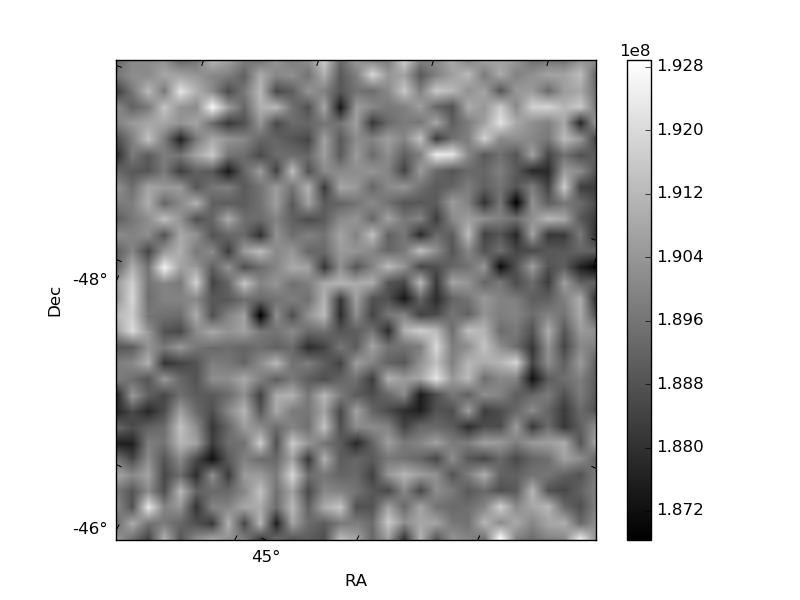
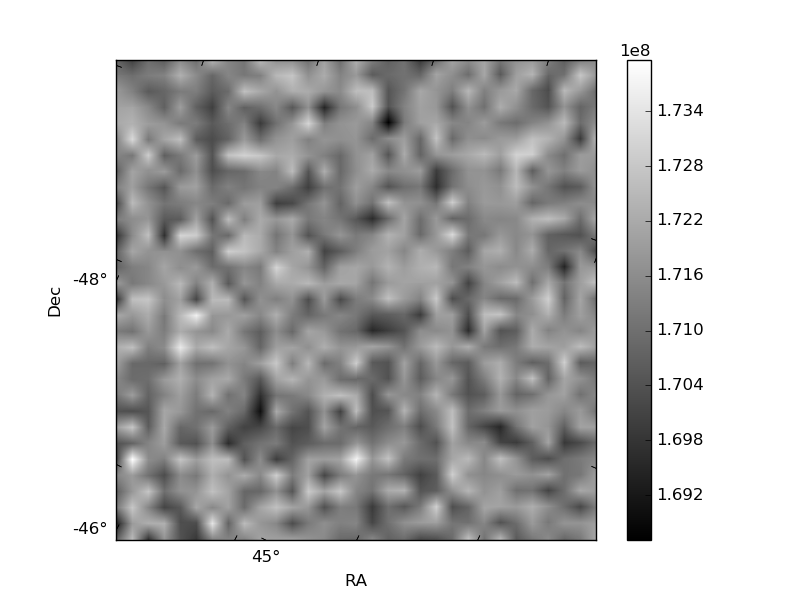
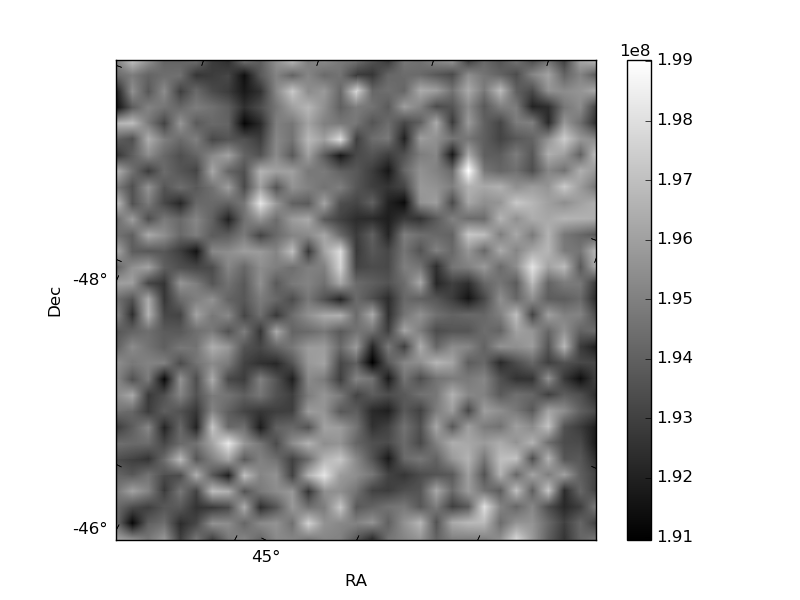
Histogram calculated using DETX and DETY for each event in the final _common_clean file
| Quadrant A | 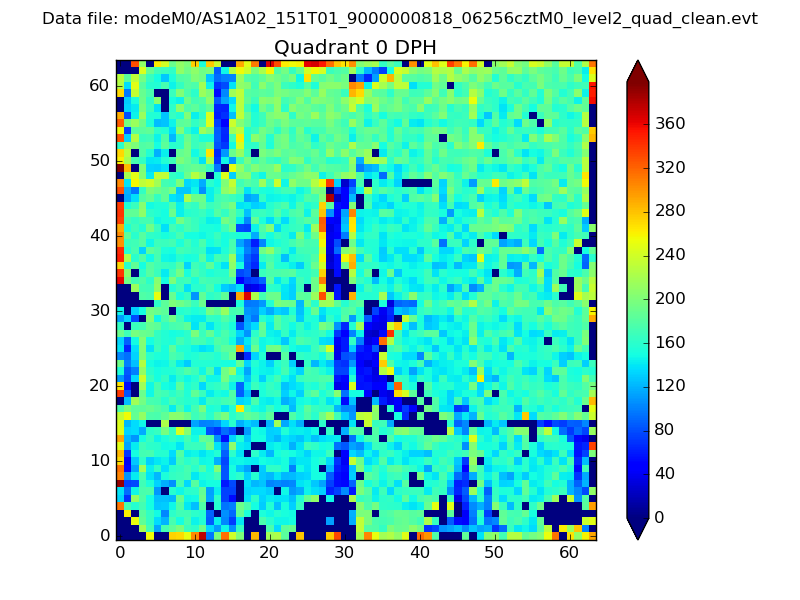 |
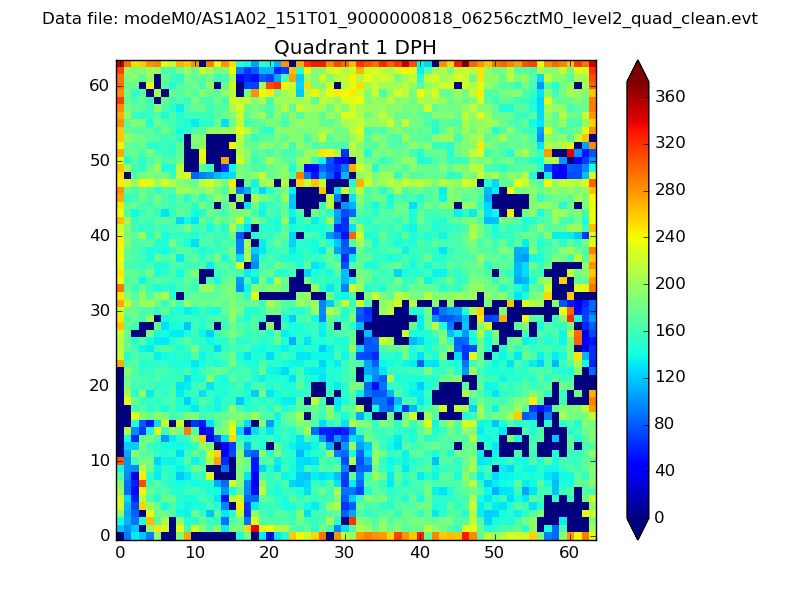 |
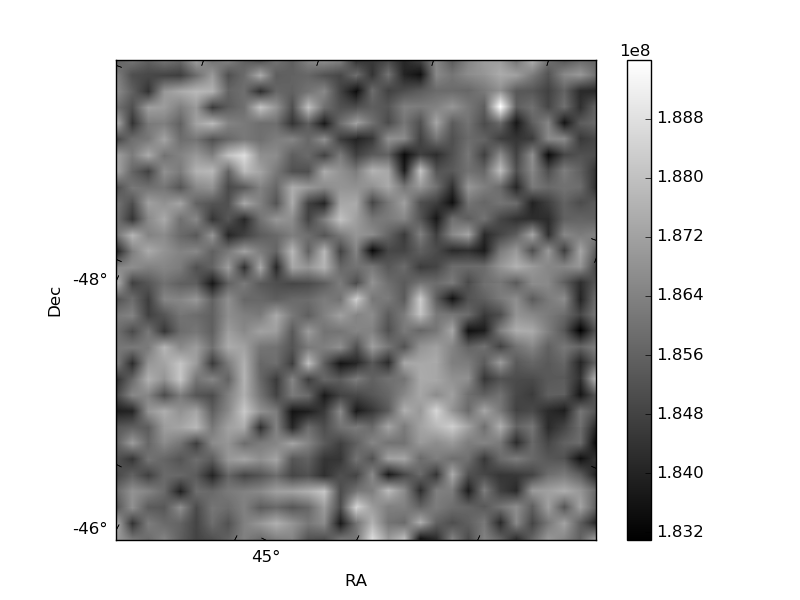
Quadrant B |
|---|---|---|---|
| Quadrant D | 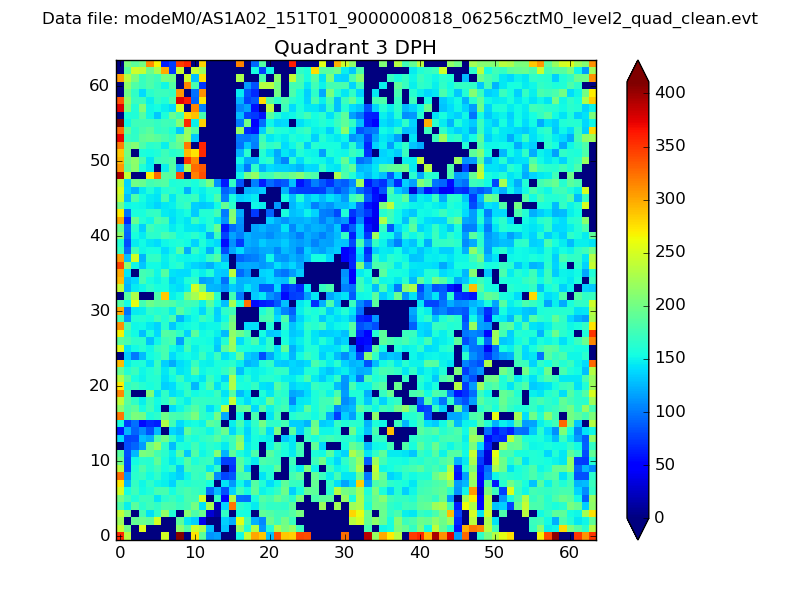 |
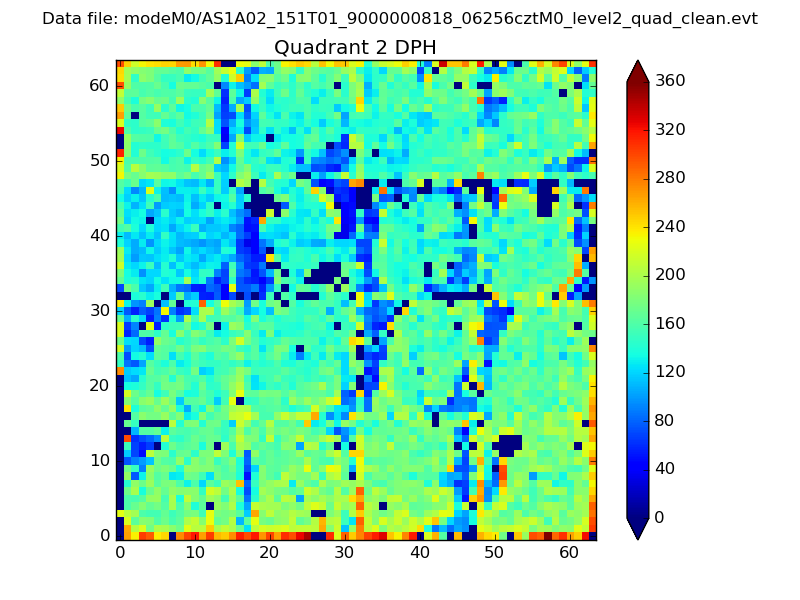 |
Quadrant C |
| Plot type | Count rate plots | Images |
|---|---|---|
| Comparison with Poisson distribution Blue bars denote a histogram of data divided into 1 sec bins. Red curve is a Poisson curve with rate = median count rate of data. |
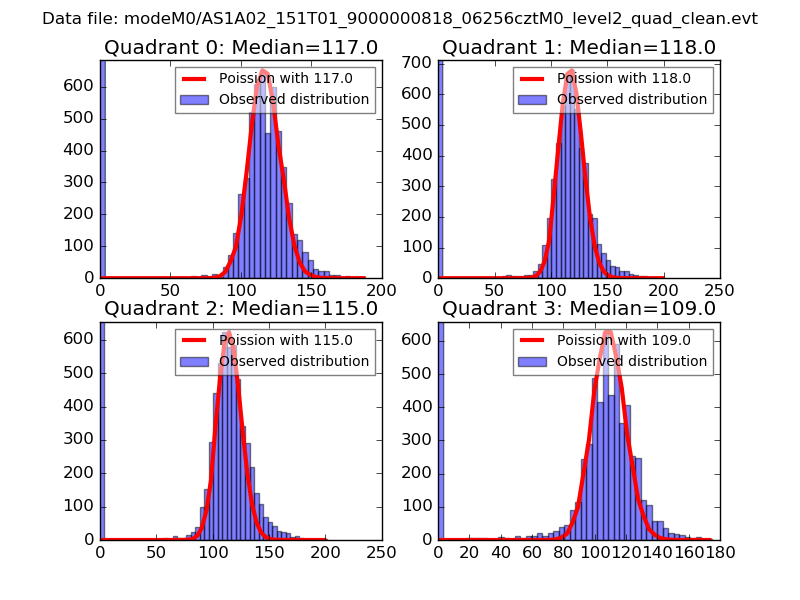 |
 |
| Quadrant-wise count rates Data is divided into 100 sec bins |
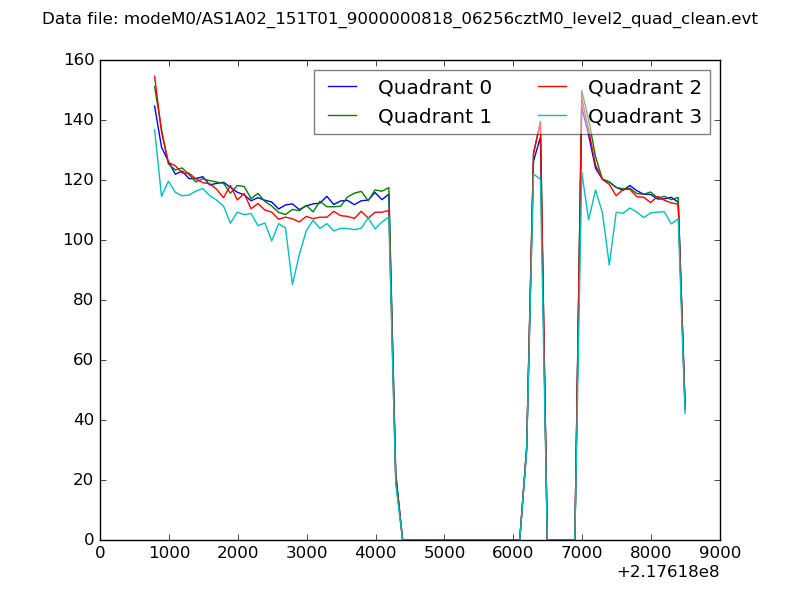 |
|
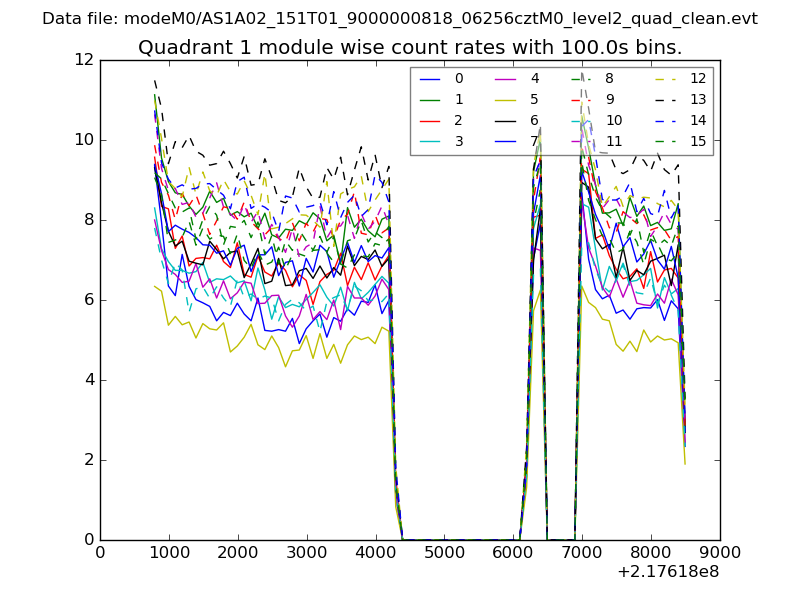
| Module-wise count rates for Quadrant A Data is divided into 100 sec bins |
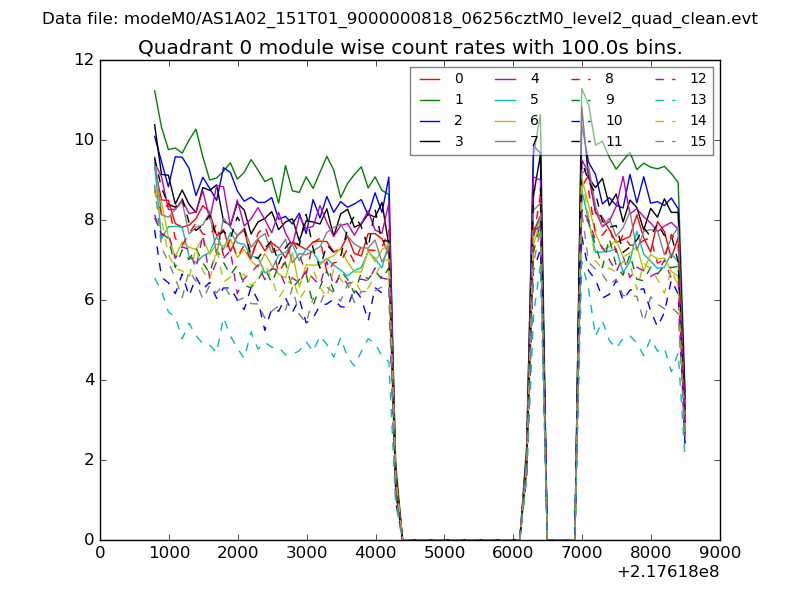 |
 |
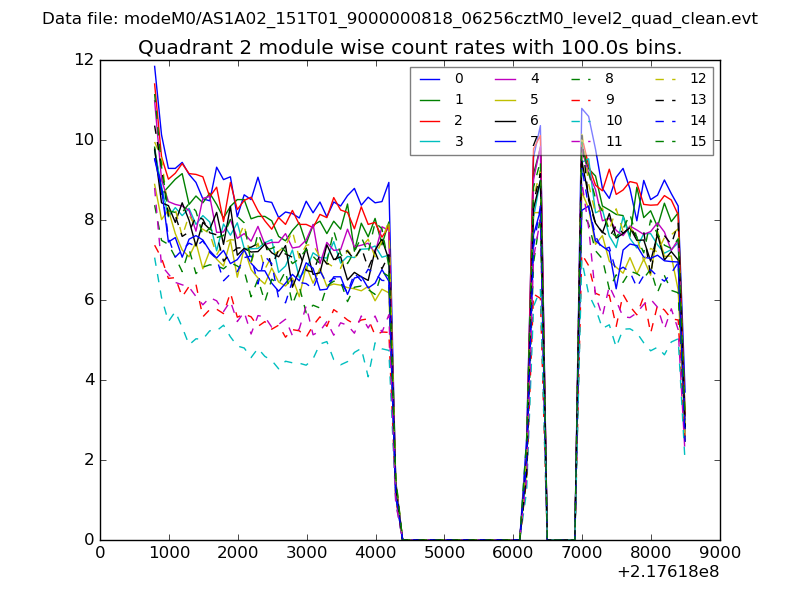
| Module-wise count rates for Quadrant B Data is divided into 100 sec bins |
 |
 |
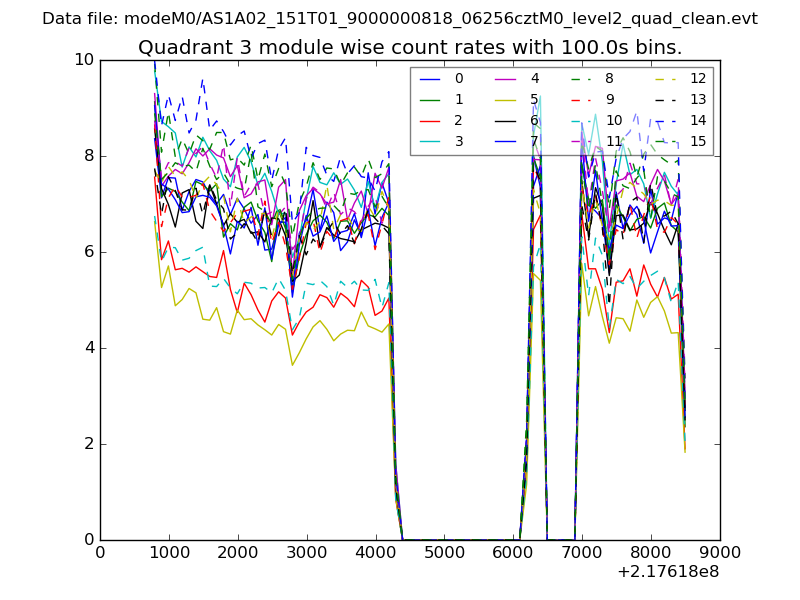
| Module-wise count rates for Quadrant C Data is divided into 100 sec bins |
 |
 |
| Module-wise count rates for Quadrant D Data is divided into 100 sec bins |
 |
 |
| Parameter | Plot |
|---|---|
| CZT HV Monitor | 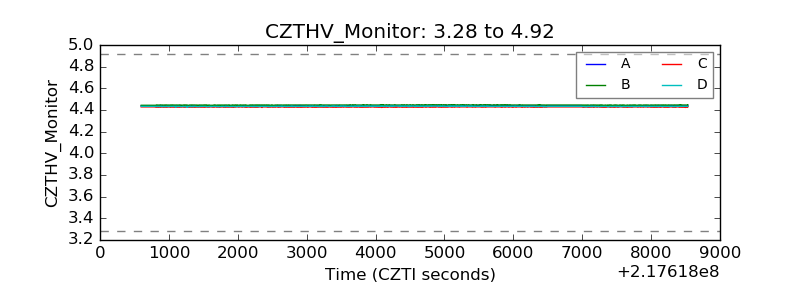 |
| D_VDD | 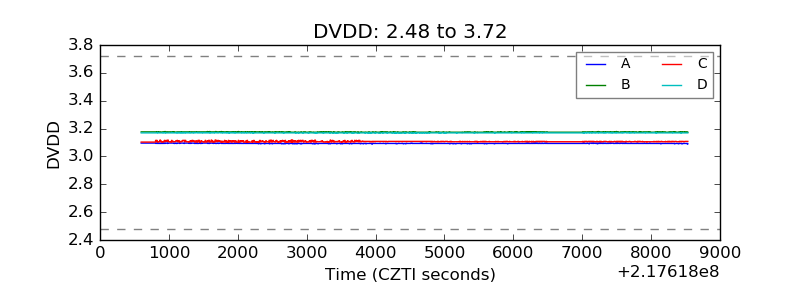 |
| Temperature 1 |  |
| Veto HV Monitor | 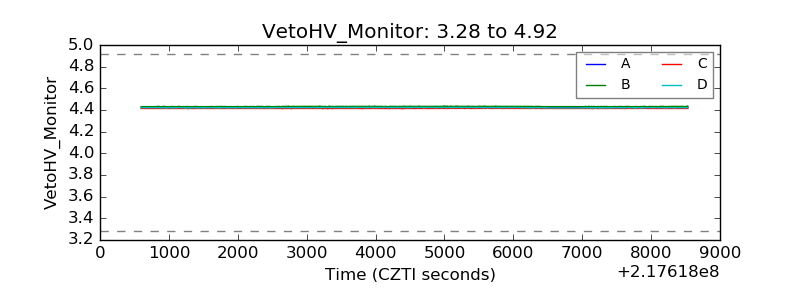 |
| Veto LLD | 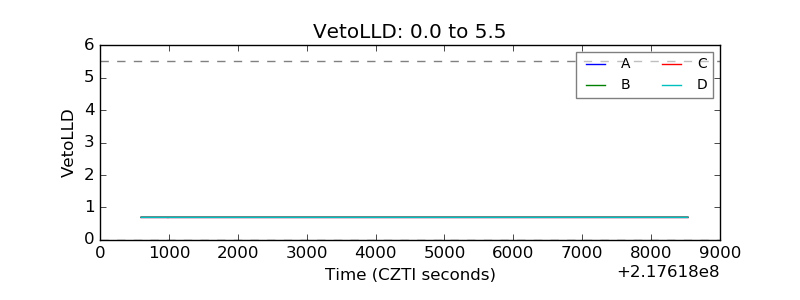 |
| Alpha Counter | 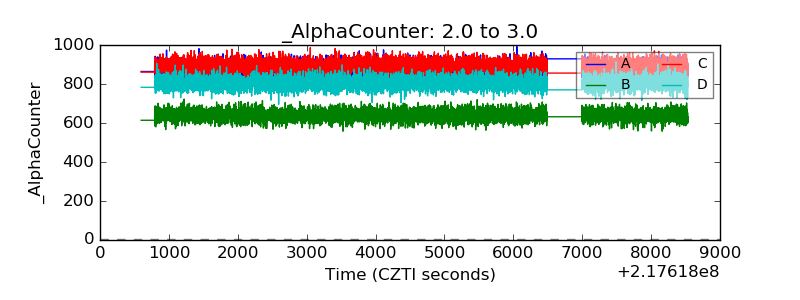 |
| _CPM_Rate |  |
| CZT Counter | 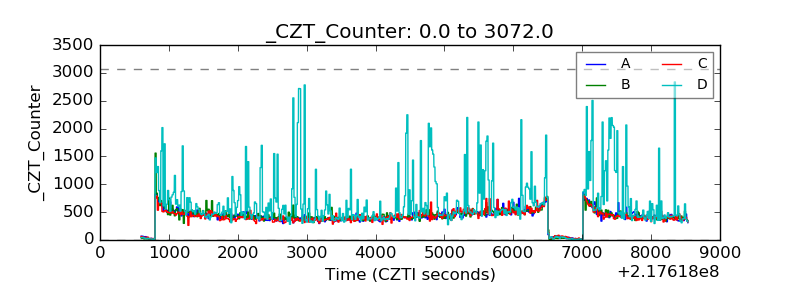 |
| +2.5 Volts monitor |  |
| +5 Volts monitor |  |
| _ROLL_ROT | 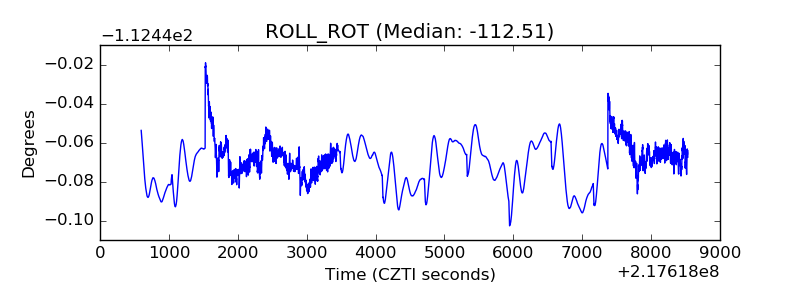 |
| _Roll_DEC | 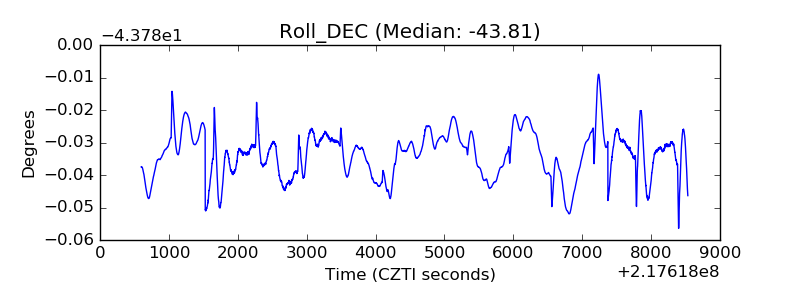 |
| _Roll_RA | 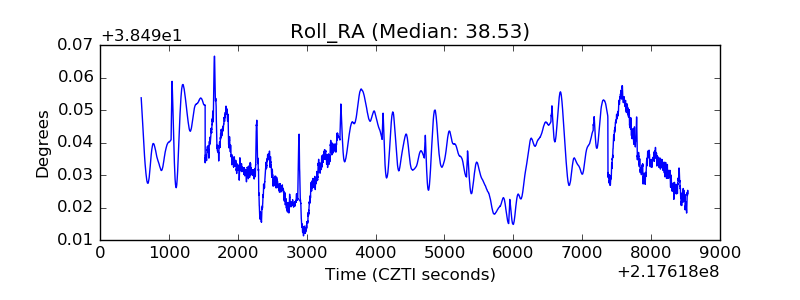 |
| Veto Counter | 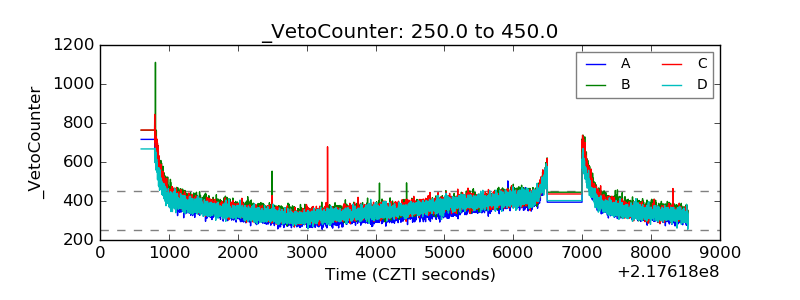 |