| Param | Original file | Final file |
|---|---|---|
| Filename | modeM0/AS1A02_151T01_9000000818_06257cztM0_level2.evt | modeM0/AS1A02_151T01_9000000818_06257cztM0_level2_quad_clean.evt |
| Size (bytes) | 514,425,600 | 103,158,720 |
| Size | 490.6 MB | 98.4 MB |
| Events in quadrant A | 3,361,025 | 661,360 |
| Events in quadrant B | 3,583,534 | 667,929 |
| Events in quadrant C | 3,269,379 | 652,453 |
| Events in quadrant D | 4,849,344 | 613,629 |
| Mode SS | |||
|---|---|---|---|
| Quadrant | BADHDUFLAG | Total packets | Discarded packets |
| A | 0 | 154 | 0 |
| B | 0 | 154 | 0 |
| C | 0 | 154 | 0 |
| D | 0 | 154 | 0 |
| Mode M9 | |||
|---|---|---|---|
| Quadrant | BADHDUFLAG | Total packets | Discarded packets |
| A | 0 | 2 | 0 |
| B | 0 | 2 | 0 |
| C | 0 | 2 | 0 |
| D | 0 | 2 | 0 |
| Mode M0 | |||
|---|---|---|---|
| Quadrant | BADHDUFLAG | Total packets | Discarded packets |
| A | 0 | 15591 | 3 |
| B | 0 | 16130 | 2 |
| C | 0 | 15523 | 2 |
| D | 0 | 19983 | 2 |
| Quadrant | Total seconds | Saturated seconds | Saturation percentage |
|---|---|---|---|
| A | 7598 | 24 | 0.315873% |
| B | 7598 | 63 | 0.829166% |
| C | 7598 | 16 | 0.210582% |
| D | 7598 | 323 | 4.251119% |
Noise dominated data is calculated using 1-second bins in cleaned event files. If a bin has >2000 counts, and if more than 50% of those come from <1% of pixels, then it is considered to be noise-dominated and hence unusable.
| Quadrant | # 1 sec bins | Bins with >0 counts | Bins with >2000 counts | High rate bins dominated by noise | Noise dominated (total time) | Noise dominated (detector-on time) | Marked lightcurve |
|---|---|---|---|---|---|---|---|
| A | 7803 | 7599 | 0 | 0 | 0.00% | 0.00% | 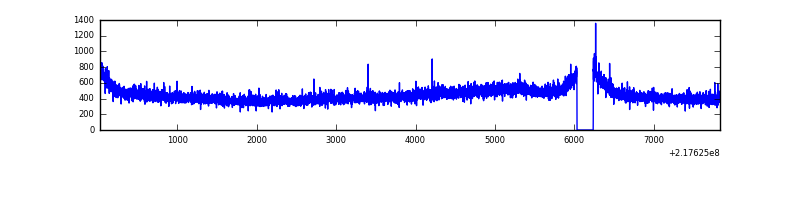 |
| B | 7803 | 7599 | 13 | 13 | 0.17% | 0.17% | 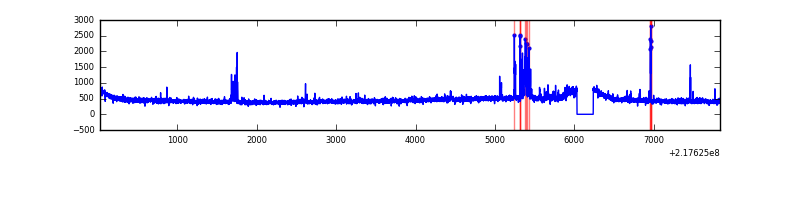 |
| C | 7803 | 7599 | 0 | 0 | 0.00% | 0.00% |  |
| D | 7803 | 7599 | 263 | 263 | 3.37% | 3.46% | 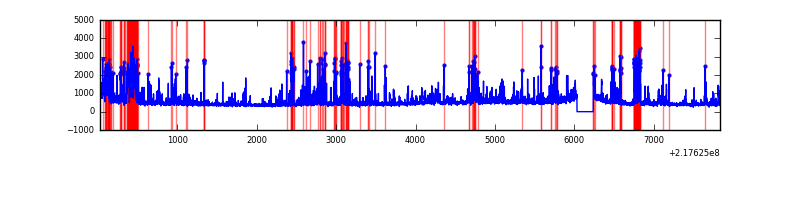 |
Top three noisy pixels from each quadrant. If the there are fewer than three noisy pixels in the level2.evt file, extra rows are filled as -1
| Pixel properties | Quadrant properties | ||||||
|---|---|---|---|---|---|---|---|
| Quadrant | DetID | PixID | Counts | Sigma | Mean | Median | Sigma |
| A | 13 | 210 | 15327 | 82.13 | 864 | 845 | 176.3 |
| A | 8 | 15 | 14044 | 74.86 | 864 | 845 | 176.3 |
| A | 0 | 226 | 8406 | 42.88 | 864 | 845 | 176.3 |
| B | 11 | 51 | 120186 | 711.83 | 874 | 852 | 167.6 |
| B | 15 | 35 | 32282 | 187.48 | 874 | 852 | 167.6 |
| B | 3 | 64 | 27304 | 157.79 | 874 | 852 | 167.6 |
| C | 13 | 61 | 6592 | 29.66 | 836 | 838 | 194.0 |
| C | 9 | 54 | 3162 | 11.98 | 836 | 838 | 194.0 |
| C | 15 | 159 | 2530 | 8.72 | 836 | 838 | 194.0 |
| D | 12 | 220 | 1347237 | 6594.92 | 823 | 798 | 204.2 |
| D | 13 | 137 | 207020 | 1010.08 | 823 | 798 | 204.2 |
| D | 2 | 152 | 80345 | 389.62 | 823 | 798 | 204.2 |
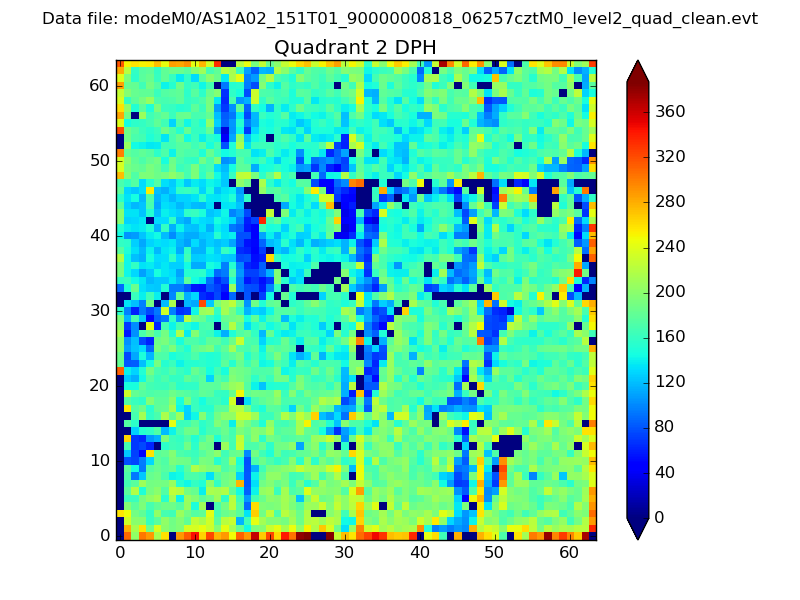
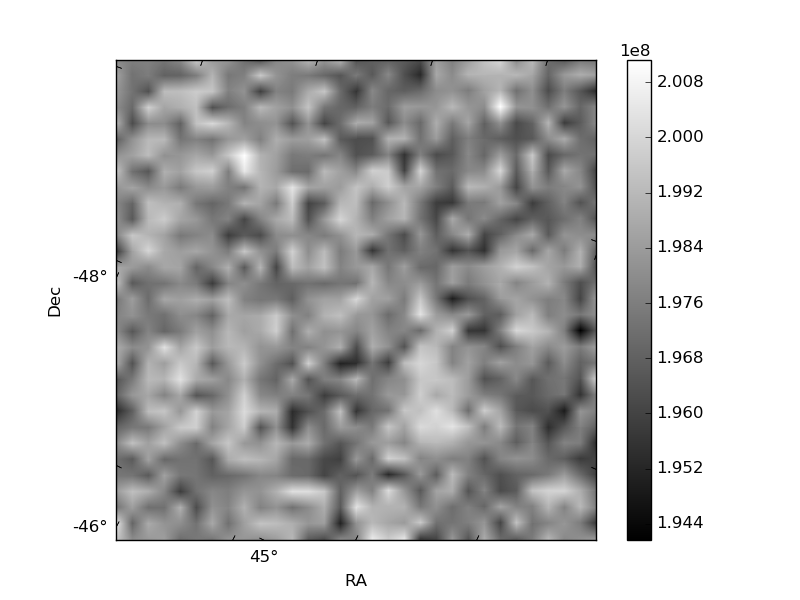
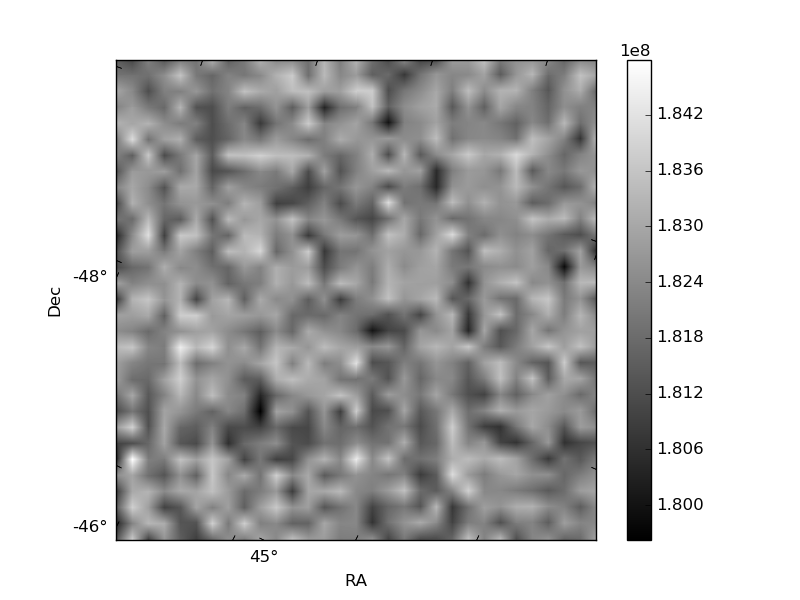
Histogram calculated using DETX and DETY for each event in the final _common_clean file
| Quadrant A | 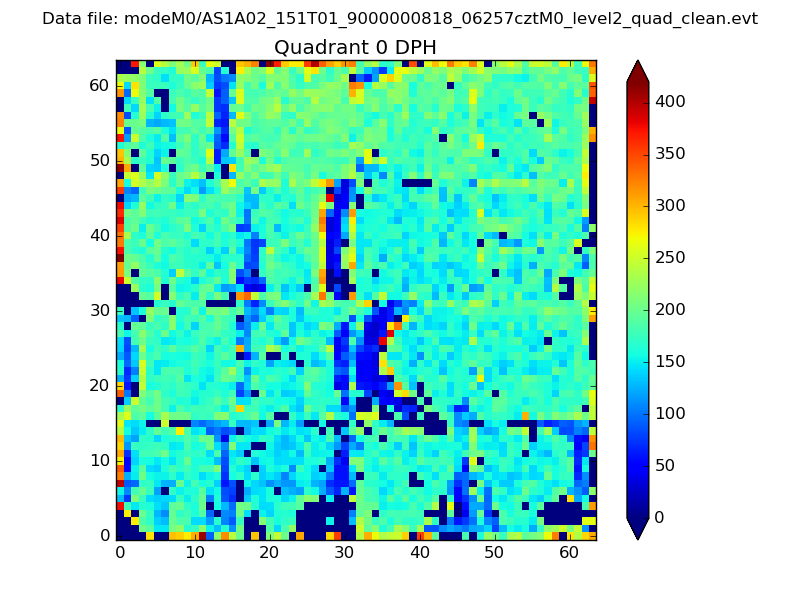 |
 |
Quadrant B |
|---|---|---|---|
| Quadrant D | 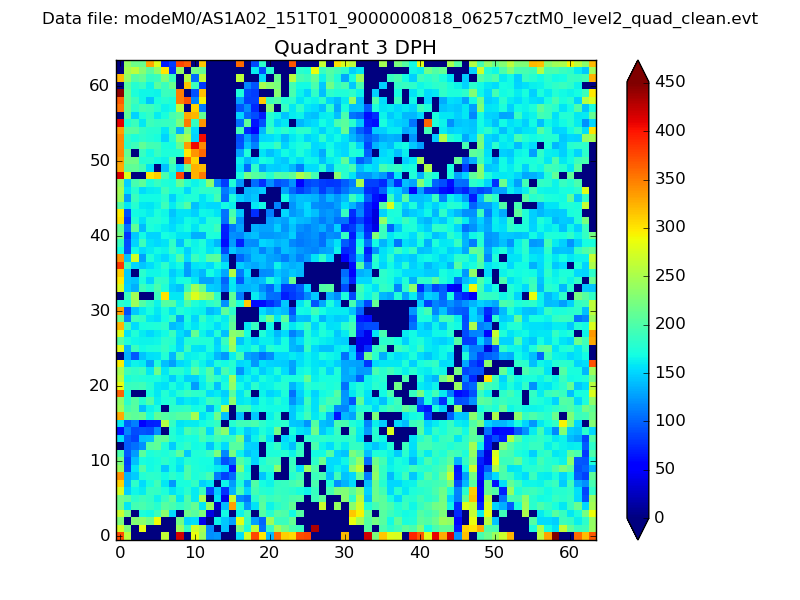 |
 |
Quadrant C |
| Plot type | Count rate plots | Images |
|---|---|---|
| Comparison with Poisson distribution Blue bars denote a histogram of data divided into 1 sec bins. Red curve is a Poisson curve with rate = median count rate of data. |
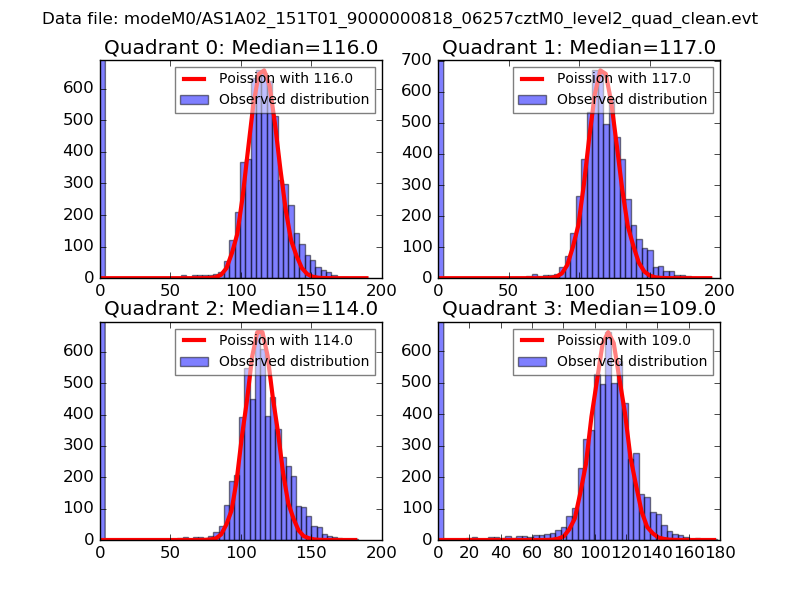 |
 |
| Quadrant-wise count rates Data is divided into 100 sec bins |
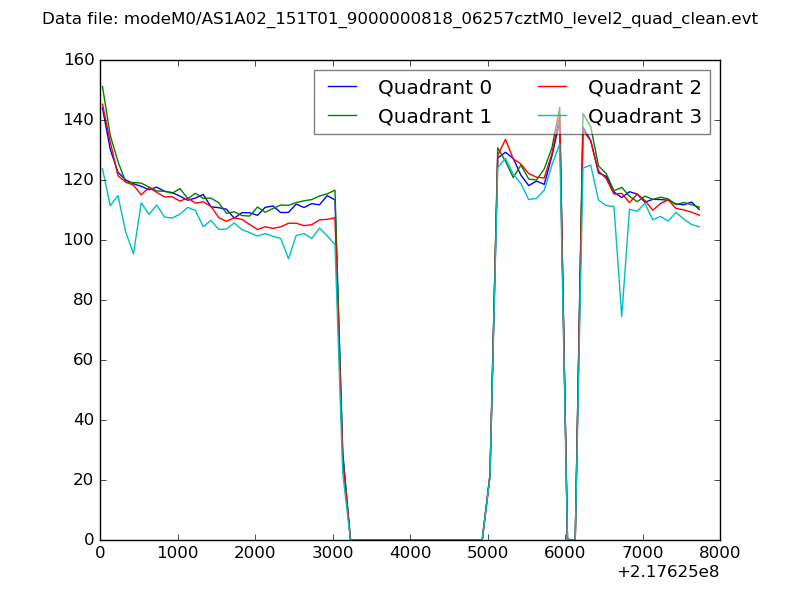 |
|
| Module-wise count rates for Quadrant A Data is divided into 100 sec bins |
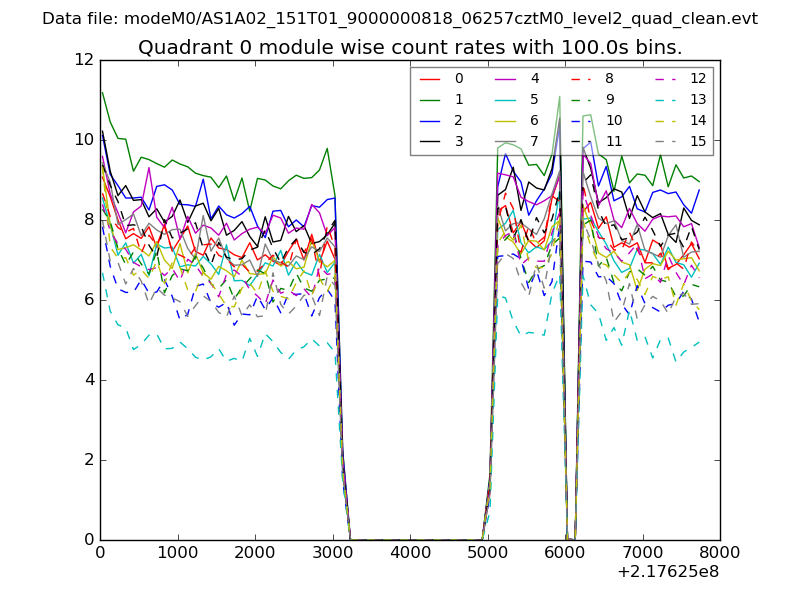 |
 |
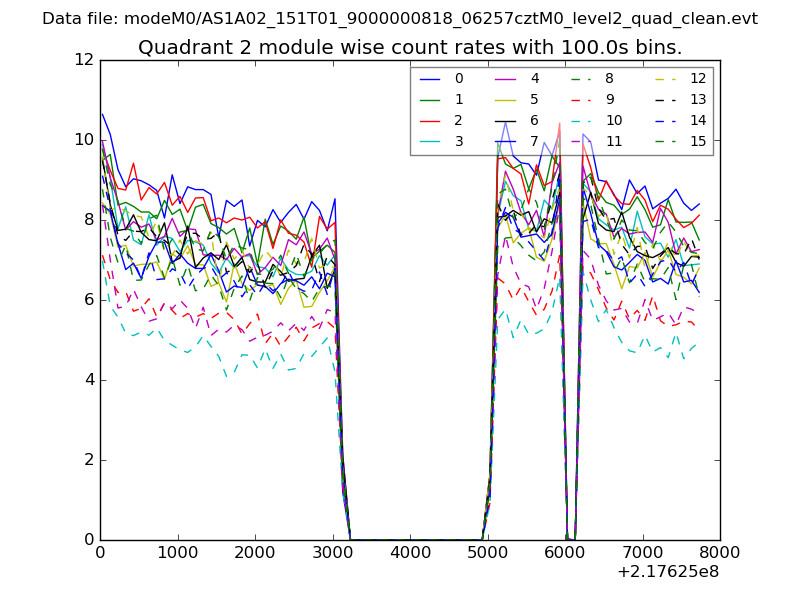
| Module-wise count rates for Quadrant B Data is divided into 100 sec bins |
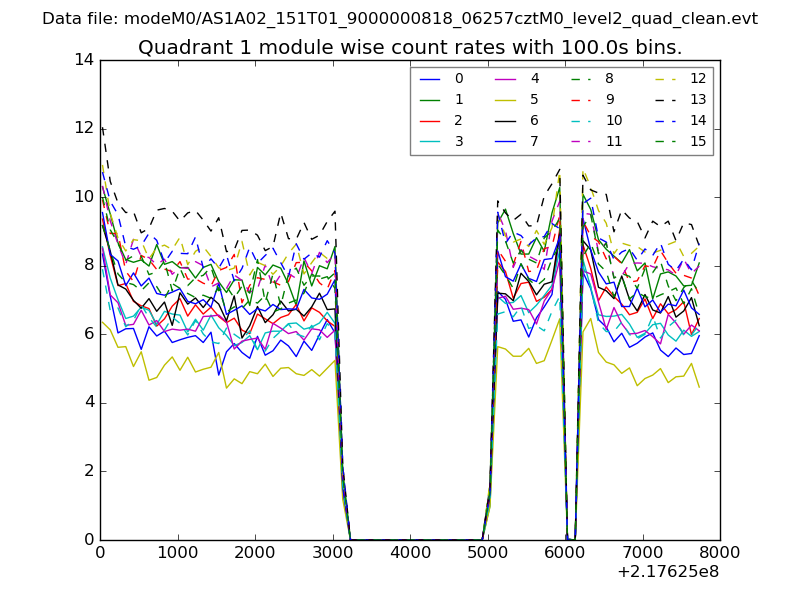 |
 |
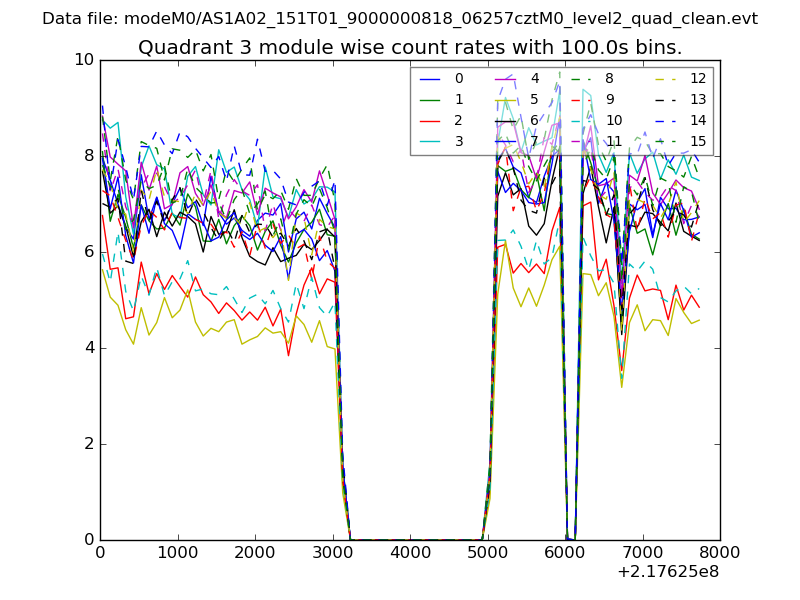
| Module-wise count rates for Quadrant C Data is divided into 100 sec bins |
 |
 |
| Module-wise count rates for Quadrant D Data is divided into 100 sec bins |
 |
 |
| Parameter | Plot |
|---|---|
| CZT HV Monitor | 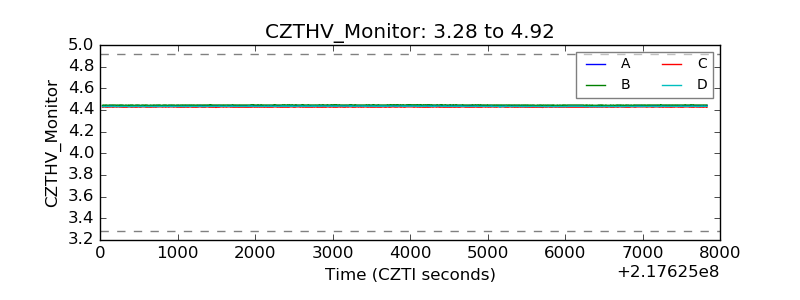 |
| D_VDD | 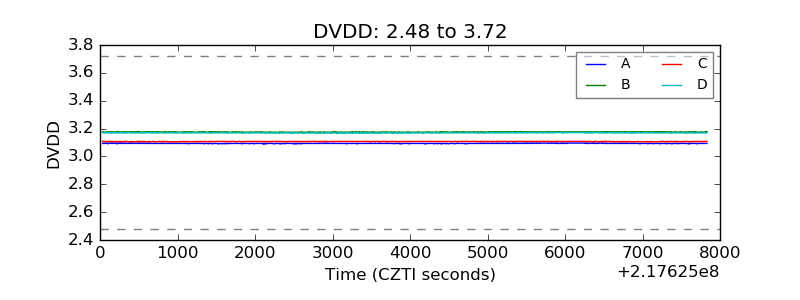 |
| Temperature 1 | 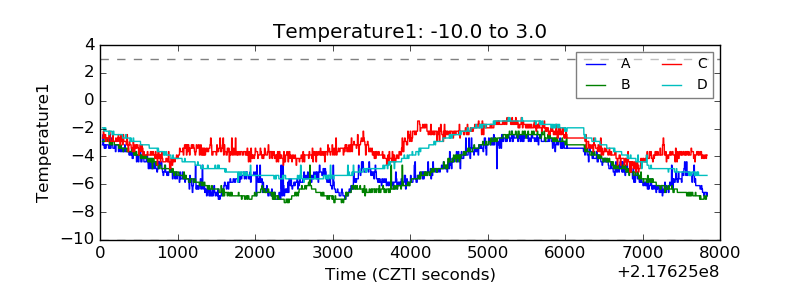 |
| Veto HV Monitor | 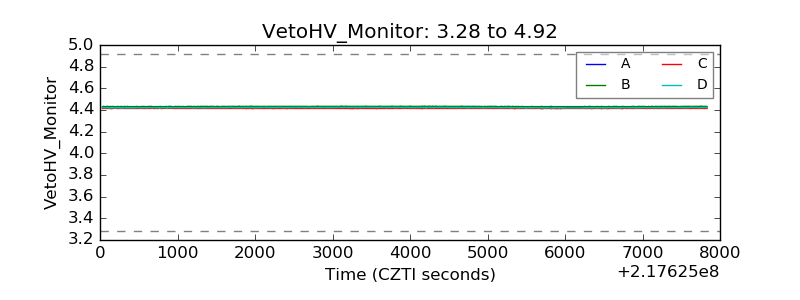 |
| Veto LLD | 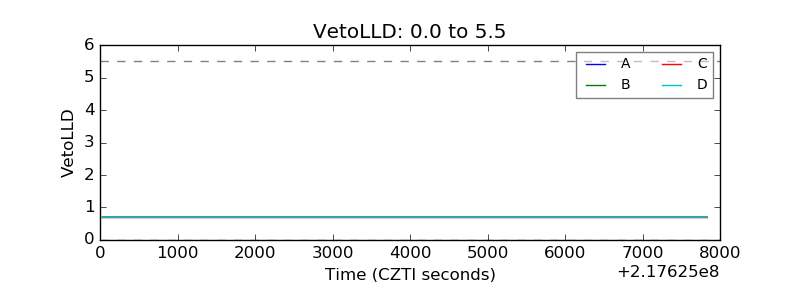 |
| Alpha Counter | 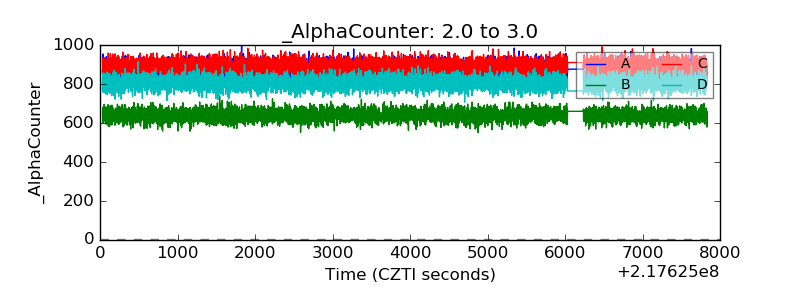 |
| _CPM_Rate | 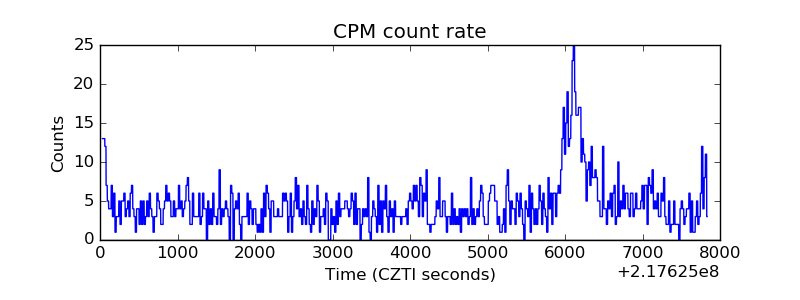 |
| CZT Counter | 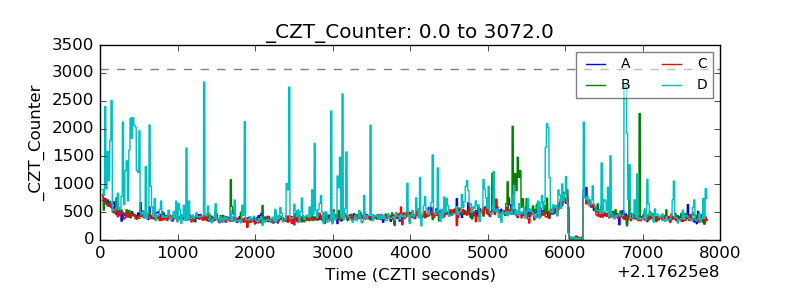 |
| +2.5 Volts monitor |  |
| +5 Volts monitor | 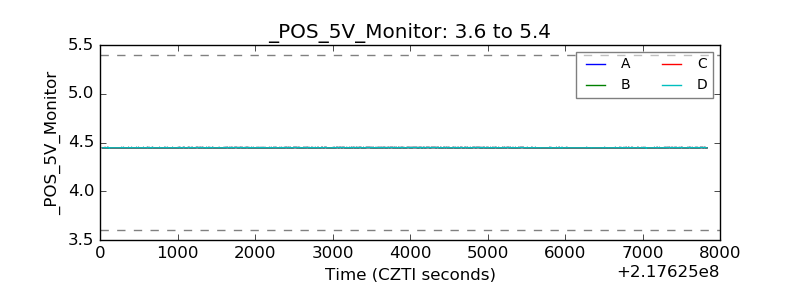 |
| _ROLL_ROT | 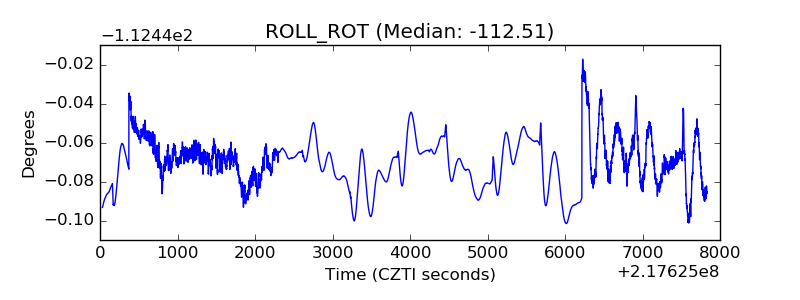 |
| _Roll_DEC | 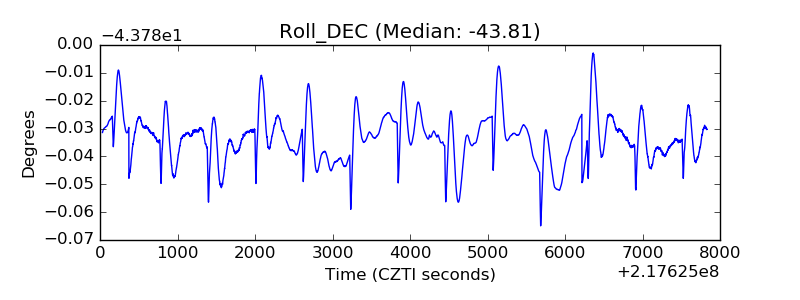 |
| _Roll_RA | 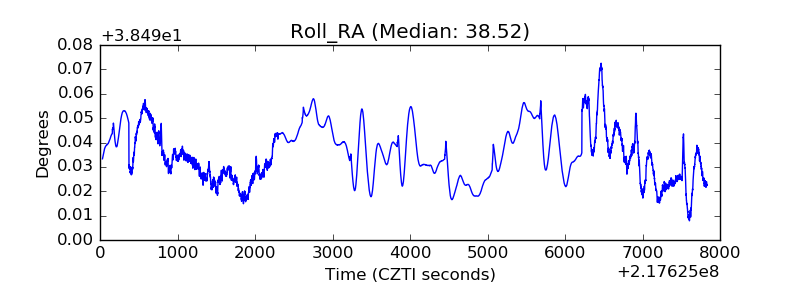 |
| Veto Counter | 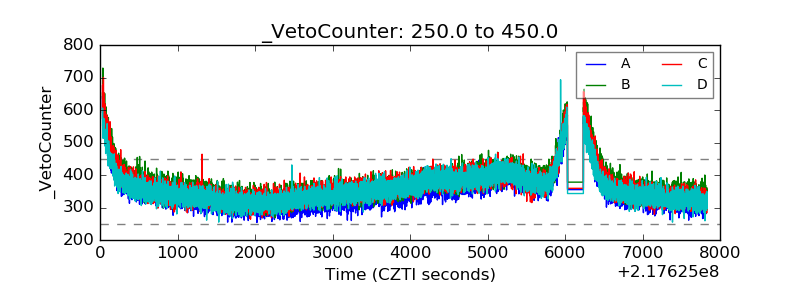 |