| Param | Original file | Final file |
|---|---|---|
| Filename | modeM0/AS1A02_151T01_9000000818_06258cztM0_level2.evt | modeM0/AS1A02_151T01_9000000818_06258cztM0_level2_quad_clean.evt |
| Size (bytes) | 551,269,440 | 113,846,400 |
| Size | 525.7 MB | 108.6 MB |
| Events in quadrant A | 3,667,650 | 732,095 |
| Events in quadrant B | 3,942,254 | 736,325 |
| Events in quadrant C | 3,552,864 | 723,856 |
| Events in quadrant D | 4,975,376 | 685,377 |
| Mode SS | |||
|---|---|---|---|
| Quadrant | BADHDUFLAG | Total packets | Discarded packets |
| A | 0 | 168 | 0 |
| B | 0 | 168 | 0 |
| C | 0 | 168 | 0 |
| D | 0 | 168 | 0 |
| Mode M9 | |||
|---|---|---|---|
| Quadrant | BADHDUFLAG | Total packets | Discarded packets |
| A | 0 | 4 | 0 |
| B | 0 | 4 | 0 |
| C | 0 | 4 | 0 |
| D | 0 | 4 | 0 |
| Mode M0 | |||
|---|---|---|---|
| Quadrant | BADHDUFLAG | Total packets | Discarded packets |
| A | 0 | 16888 | 3 |
| B | 0 | 17574 | 2 |
| C | 0 | 16806 | 2 |
| D | 0 | 20914 | 2 |
| Quadrant | Total seconds | Saturated seconds | Saturation percentage |
|---|---|---|---|
| A | 8204 | 50 | 0.609459% |
| B | 8204 | 136 | 1.657728% |
| C | 8204 | 39 | 0.475378% |
| D | 8204 | 296 | 3.607996% |
Noise dominated data is calculated using 1-second bins in cleaned event files. If a bin has >2000 counts, and if more than 50% of those come from <1% of pixels, then it is considered to be noise-dominated and hence unusable.
| Quadrant | # 1 sec bins | Bins with >0 counts | Bins with >2000 counts | High rate bins dominated by noise | Noise dominated (total time) | Noise dominated (detector-on time) | Marked lightcurve |
|---|---|---|---|---|---|---|---|
| A | 8674 | 8206 | 1 | 1 | 0.01% | 0.01% |  |
| B | 8674 | 8206 | 18 | 18 | 0.21% | 0.22% |  |
| C | 8674 | 8206 | 0 | 0 | 0.00% | 0.00% |  |
| D | 8674 | 8206 | 225 | 225 | 2.59% | 2.74% | 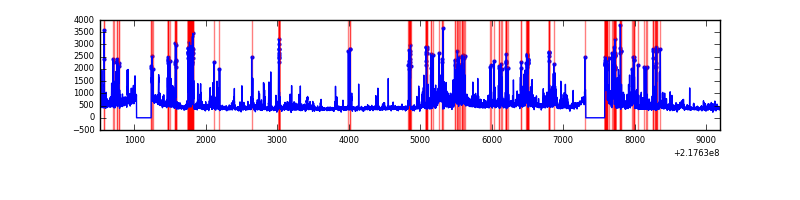 |
Top three noisy pixels from each quadrant. If the there are fewer than three noisy pixels in the level2.evt file, extra rows are filled as -1
| Pixel properties | Quadrant properties | ||||||
|---|---|---|---|---|---|---|---|
| Quadrant | DetID | PixID | Counts | Sigma | Mean | Median | Sigma |
| A | 8 | 15 | 17288 | 85.98 | 935 | 913 | 190.4 |
| A | 13 | 210 | 16148 | 80.0 | 935 | 913 | 190.4 |
| A | 5 | 112 | 13538 | 66.29 | 935 | 913 | 190.4 |
| B | 3 | 64 | 206018 | 1126.01 | 946 | 924 | 182.1 |
| B | 11 | 51 | 28203 | 149.77 | 946 | 924 | 182.1 |
| B | 12 | 111 | 18569 | 96.88 | 946 | 924 | 182.1 |
| C | 13 | 61 | 7236 | 29.81 | 910 | 912 | 212.2 |
| C | 3 | 202 | 2251 | 6.31 | 910 | 912 | 212.2 |
| C | 8 | 222 | 2083 | 5.52 | 910 | 912 | 212.2 |
| D | 12 | 220 | 1167999 | 5306.01 | 892 | 863 | 220.0 |
| D | 13 | 105 | 199358 | 902.39 | 892 | 863 | 220.0 |
| D | 2 | 152 | 95271 | 429.19 | 892 | 863 | 220.0 |
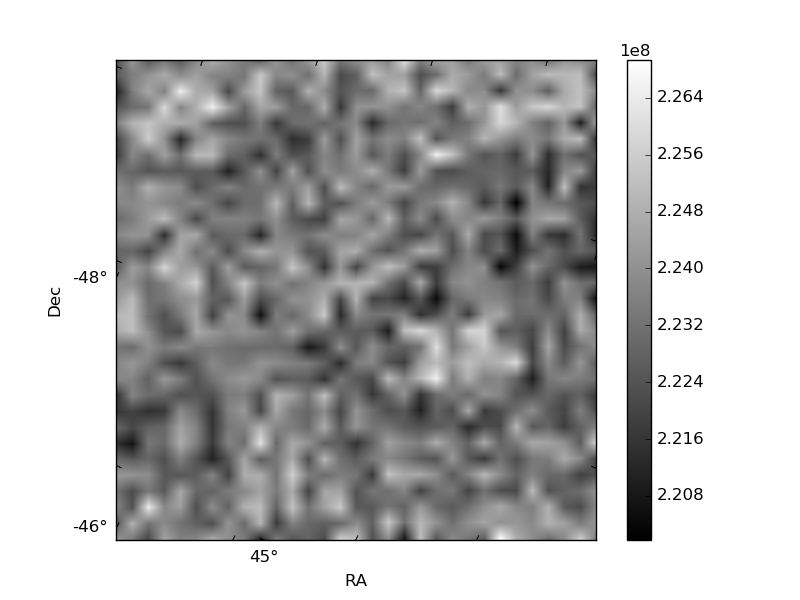
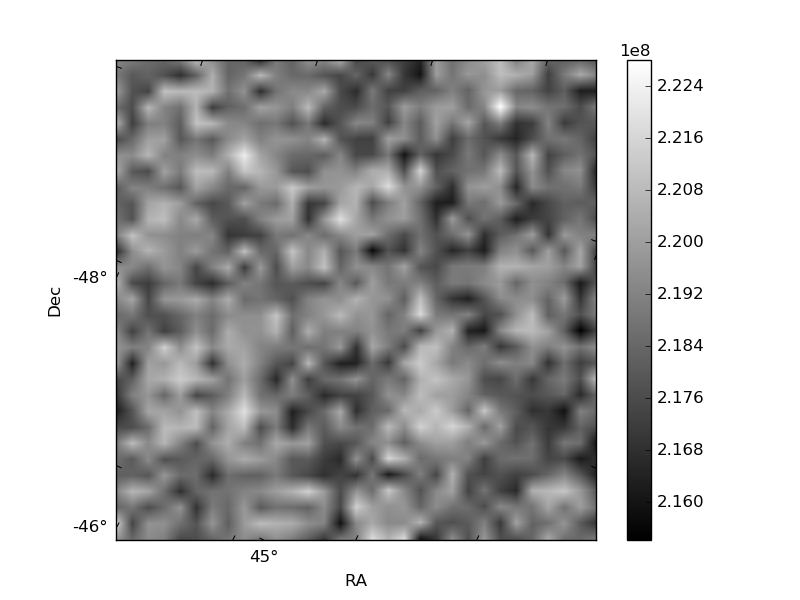
Histogram calculated using DETX and DETY for each event in the final _common_clean file
| Quadrant A | 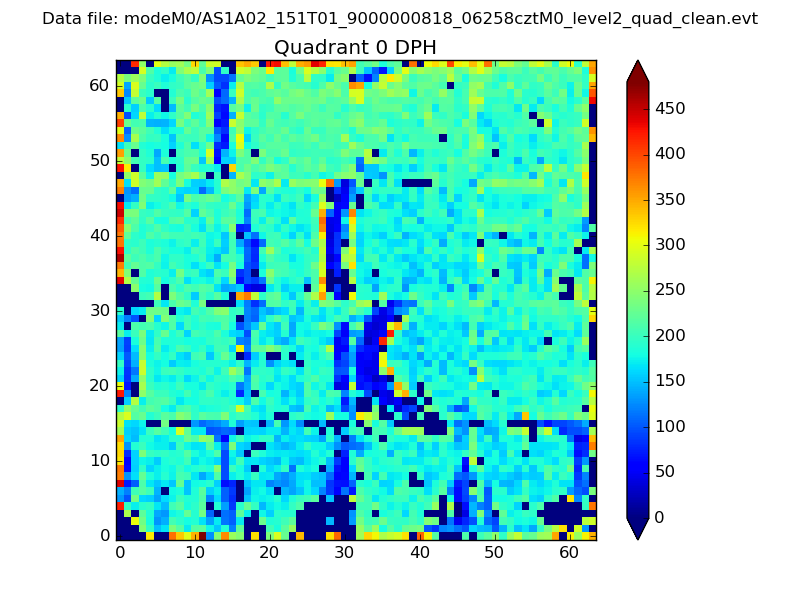 |
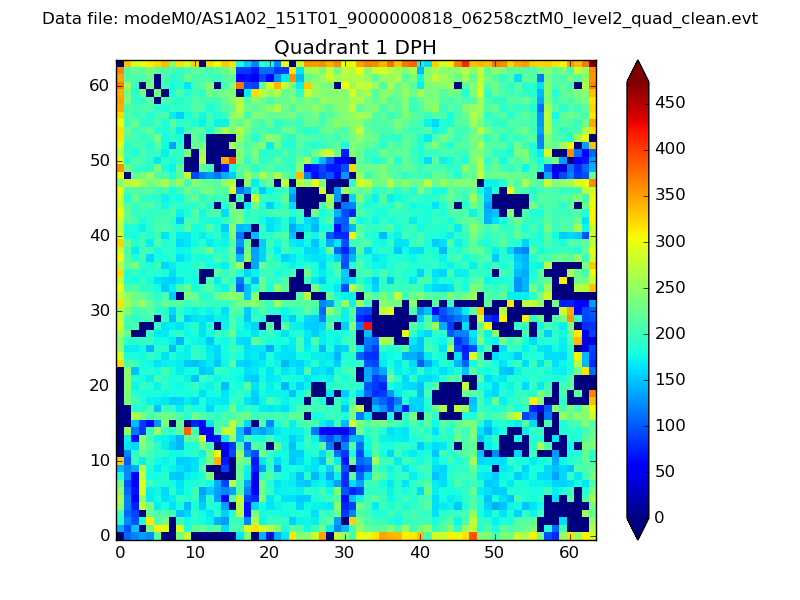 |
Quadrant B |
|---|---|---|---|
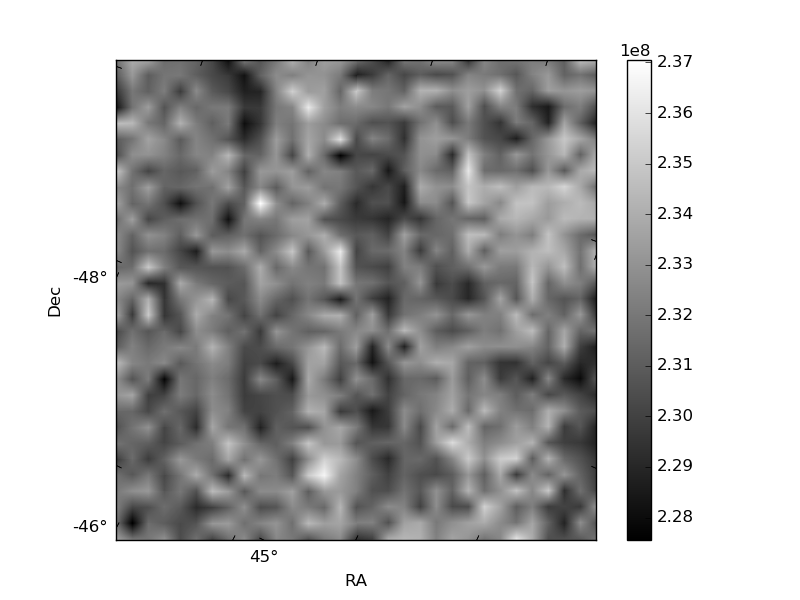
| Quadrant D | 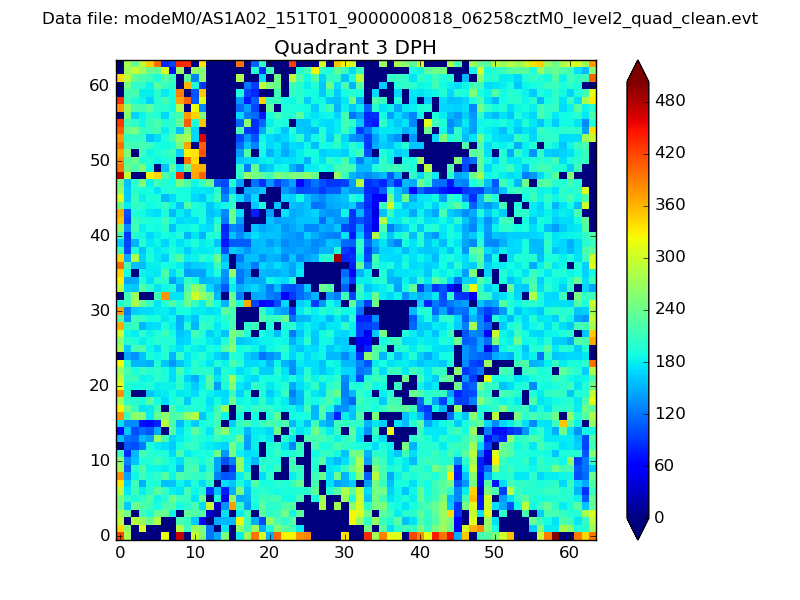 |
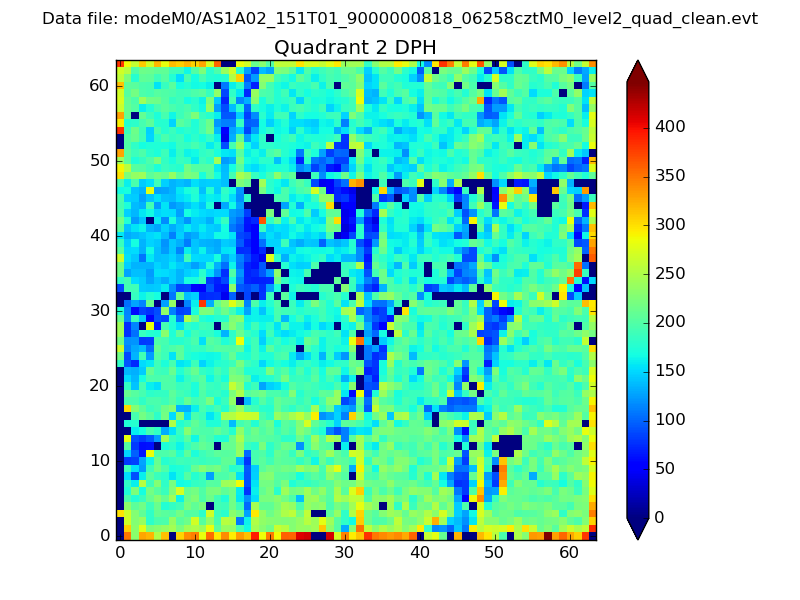 |
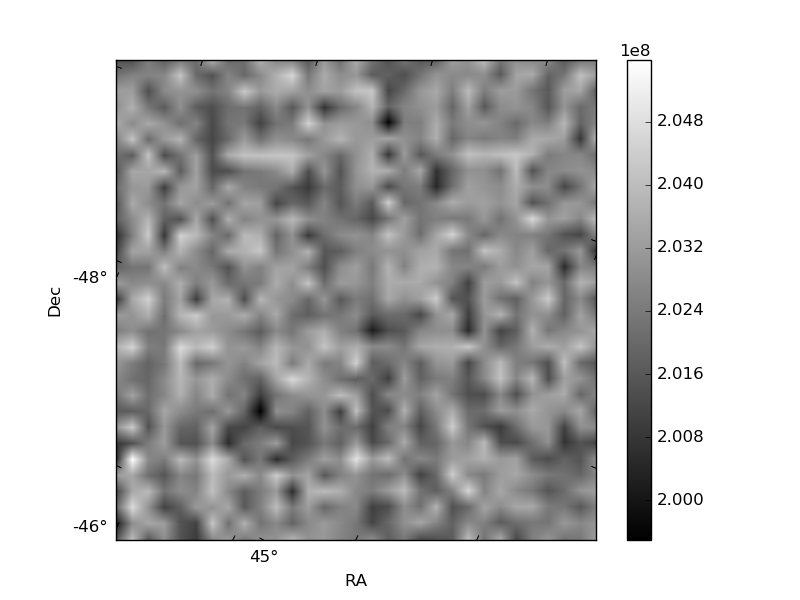
Quadrant C |
| Plot type | Count rate plots | Images |
|---|---|---|
| Comparison with Poisson distribution Blue bars denote a histogram of data divided into 1 sec bins. Red curve is a Poisson curve with rate = median count rate of data. |
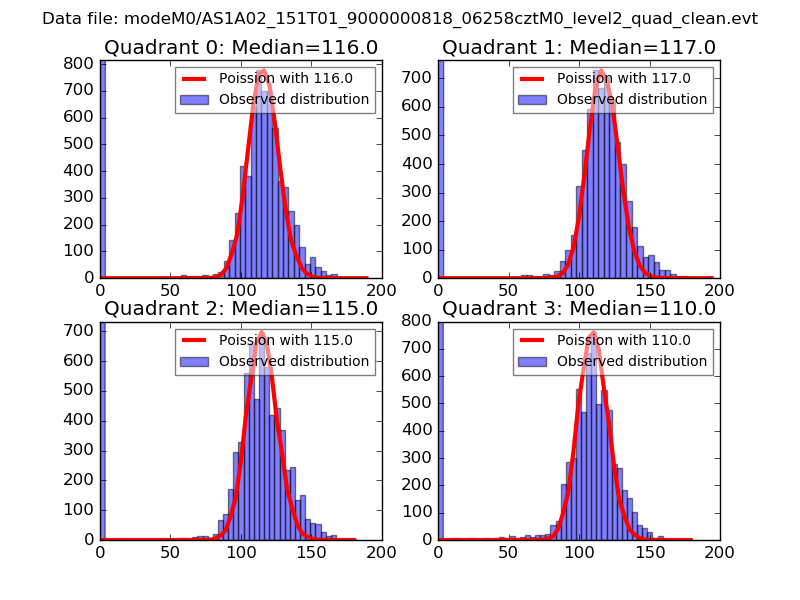 |
 |
| Quadrant-wise count rates Data is divided into 100 sec bins |
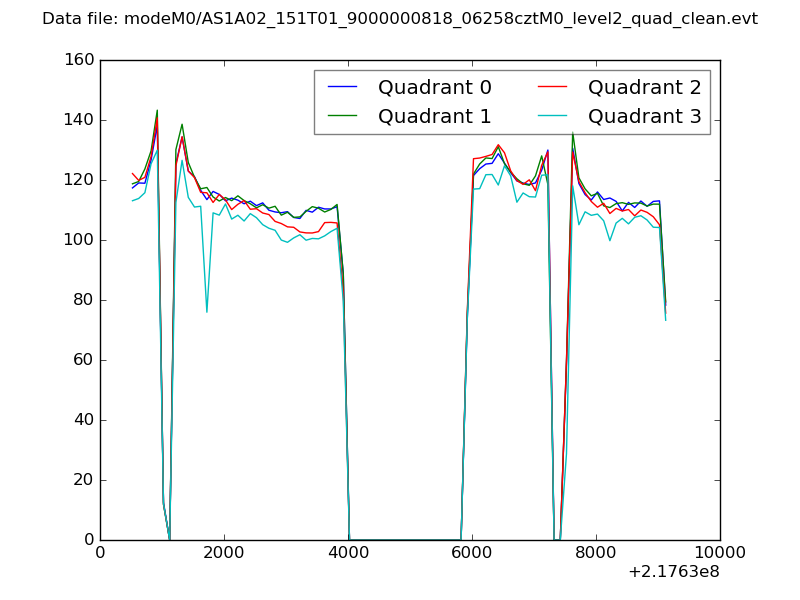 |
|
| Module-wise count rates for Quadrant A Data is divided into 100 sec bins |
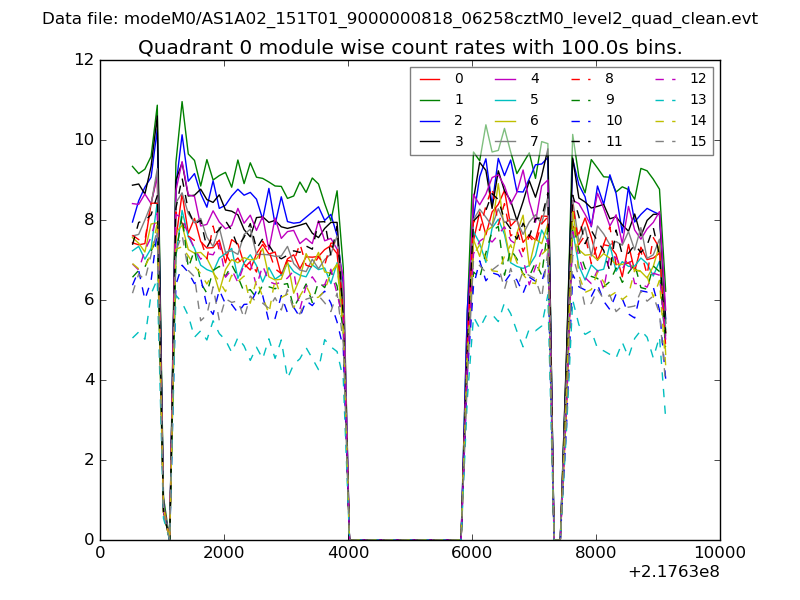 |
 |
| Module-wise count rates for Quadrant B Data is divided into 100 sec bins |
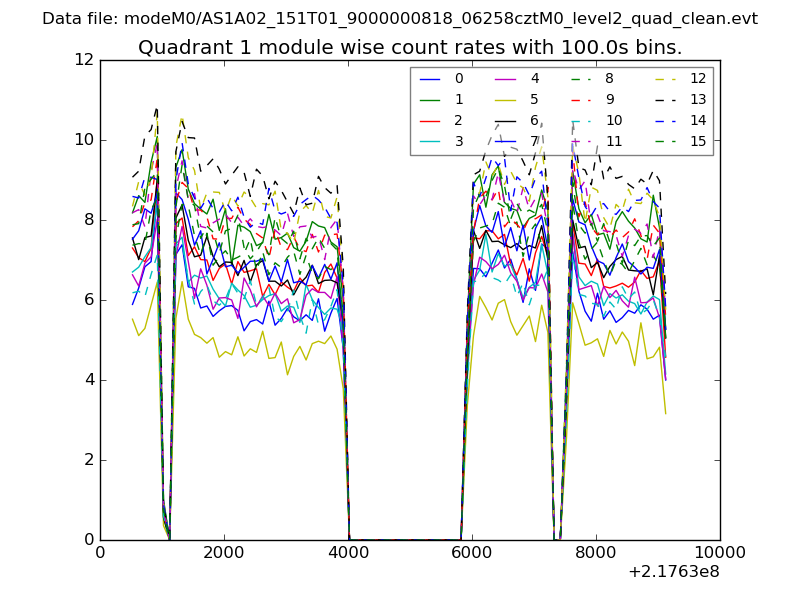 |
 |
| Module-wise count rates for Quadrant C Data is divided into 100 sec bins |
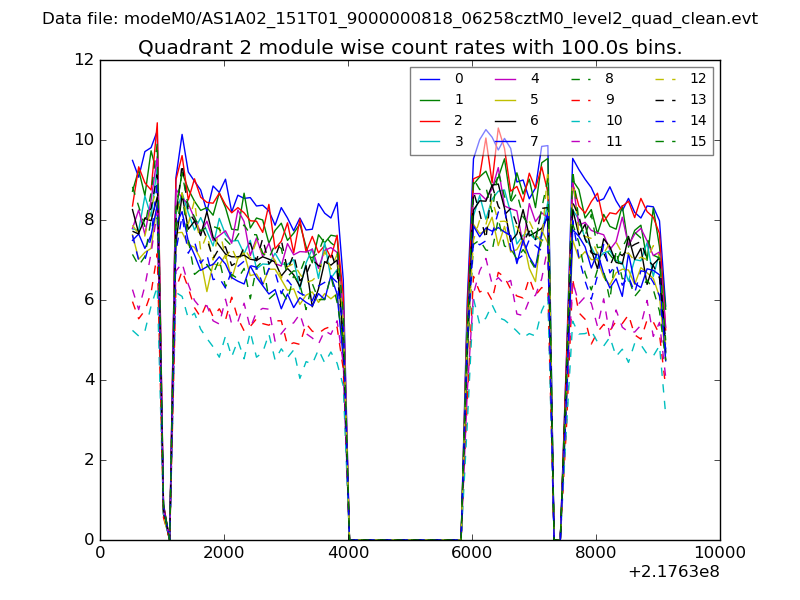 |
 |
| Module-wise count rates for Quadrant D Data is divided into 100 sec bins |
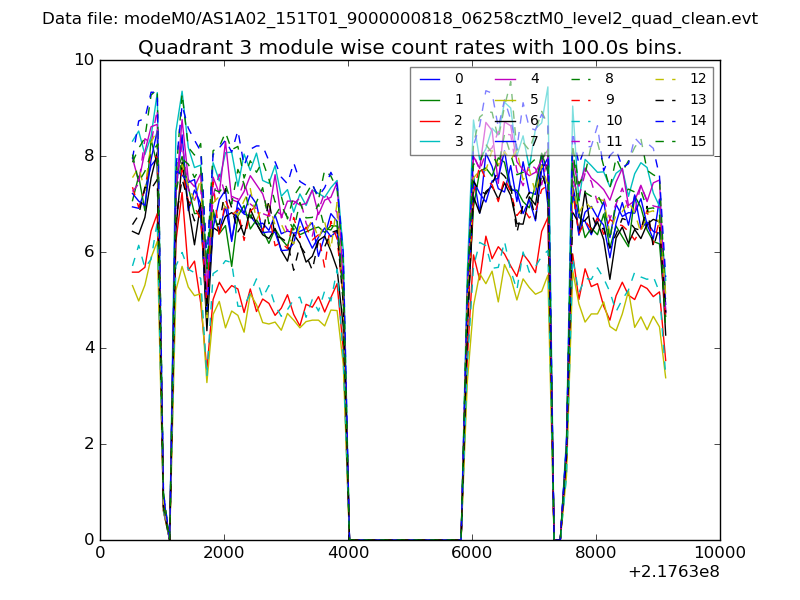 |
 |
| Parameter | Plot |
|---|---|
| CZT HV Monitor | 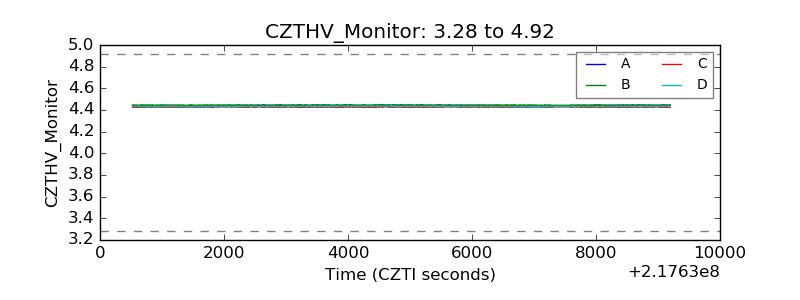 |
| D_VDD | 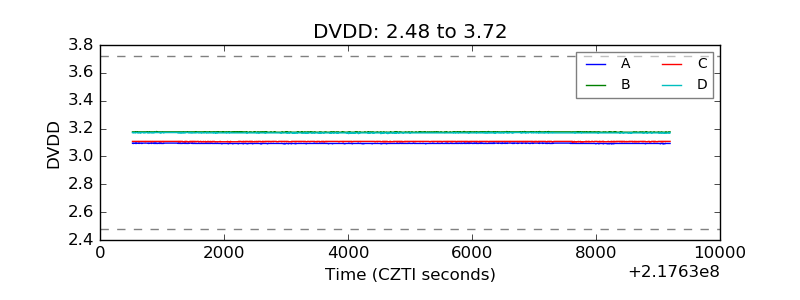 |
| Temperature 1 | 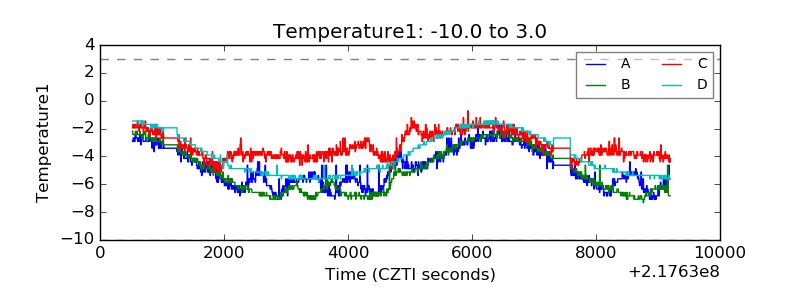 |
| Veto HV Monitor | 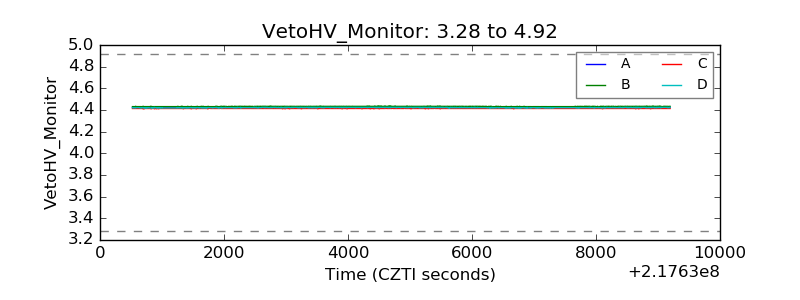 |
| Veto LLD | 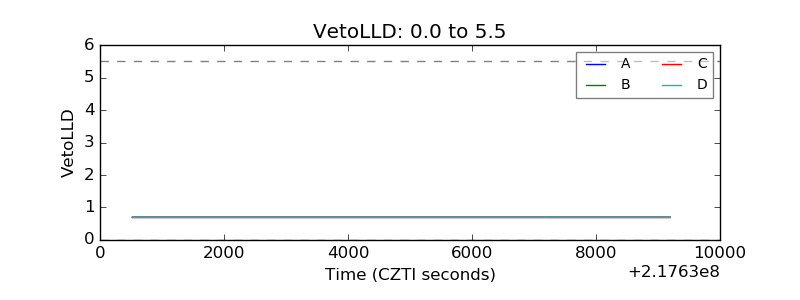 |
| Alpha Counter | 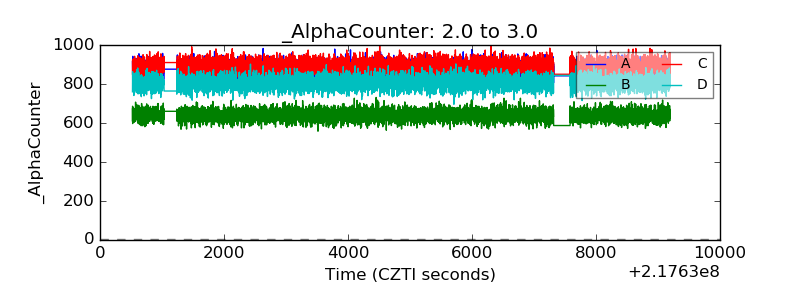 |
| _CPM_Rate | 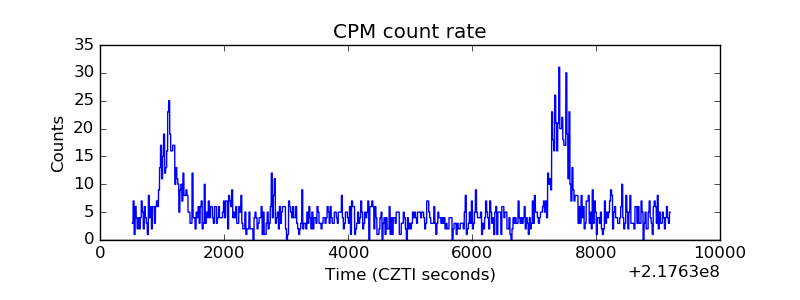 |
| CZT Counter | 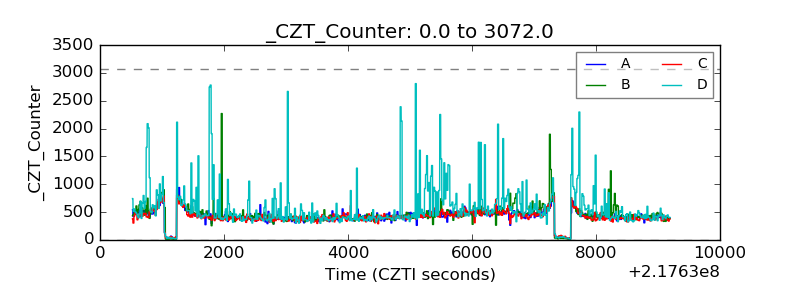 |
| +2.5 Volts monitor |  |
| +5 Volts monitor | 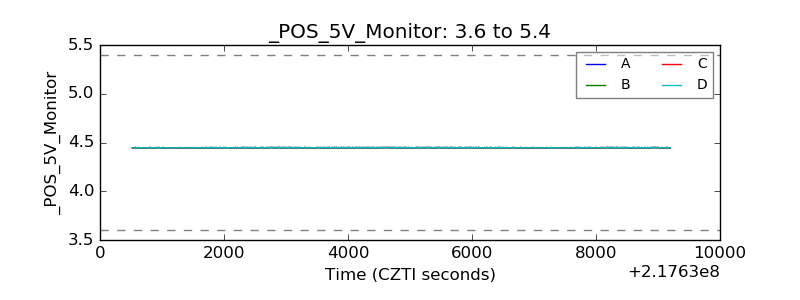 |
| _ROLL_ROT | 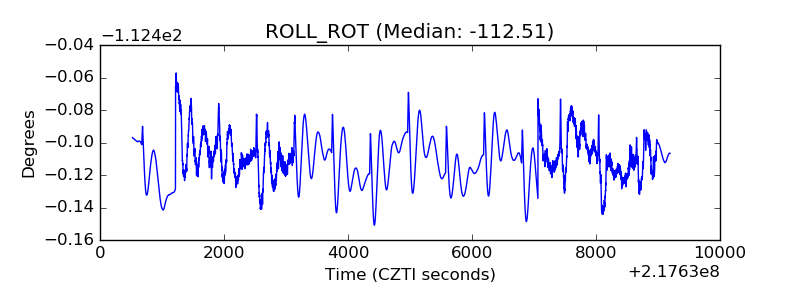 |
| _Roll_DEC | 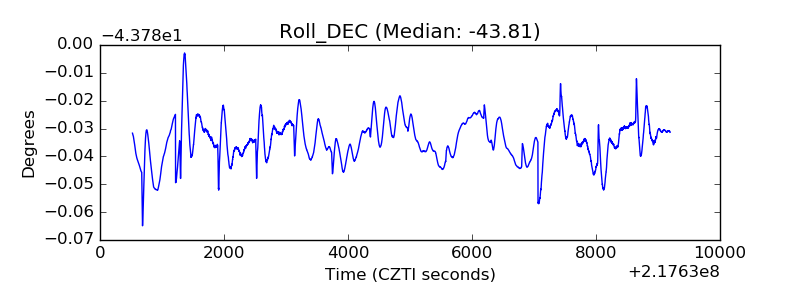 |
| _Roll_RA | 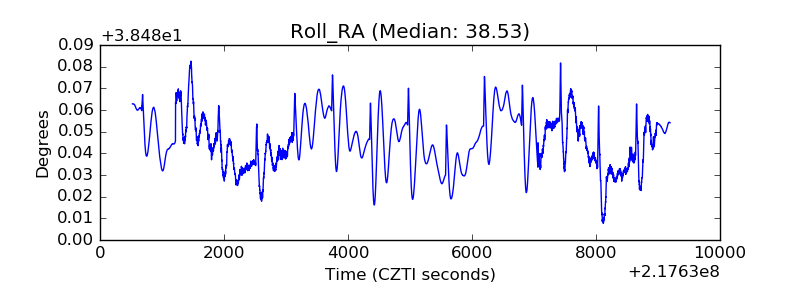 |
| Veto Counter | 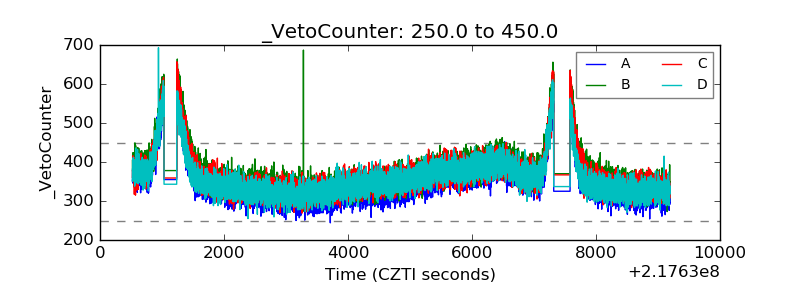 |