| Param | Original file | Final file |
|---|---|---|
| Filename | modeM0/AS1A02_151T01_9000000818_06261cztM0_level2.evt | modeM0/AS1A02_151T01_9000000818_06261cztM0_level2_quad_clean.evt |
| Size (bytes) | 473,008,320 | 87,171,840 |
| Size | 451.1 MB | 83.1 MB |
| Events in quadrant A | 3,058,132 | 555,365 |
| Events in quadrant B | 3,644,754 | 552,519 |
| Events in quadrant C | 2,894,123 | 551,853 |
| Events in quadrant D | 4,271,920 | 512,069 |
| Mode SS | |||
|---|---|---|---|
| Quadrant | BADHDUFLAG | Total packets | Discarded packets |
| A | 0 | 140 | 0 |
| B | 0 | 140 | 0 |
| C | 0 | 140 | 0 |
| D | 0 | 140 | 0 |
| Mode M9 | |||
|---|---|---|---|
| Quadrant | BADHDUFLAG | Total packets | Discarded packets |
| A | 0 | 7 | 0 |
| B | 0 | 7 | 0 |
| C | 0 | 7 | 0 |
| D | 0 | 7 | 0 |
| Mode M0 | |||
|---|---|---|---|
| Quadrant | BADHDUFLAG | Total packets | Discarded packets |
| A | 0 | 13855 | 2 |
| B | 0 | 15495 | 2 |
| C | 0 | 13629 | 2 |
| D | 0 | 17571 | 2 |
| Quadrant | Total seconds | Saturated seconds | Saturation percentage |
|---|---|---|---|
| A | 6704 | 47 | 0.701074% |
| B | 6704 | 239 | 3.565036% |
| C | 6704 | 34 | 0.507160% |
| D | 6704 | 394 | 5.877088% |
Noise dominated data is calculated using 1-second bins in cleaned event files. If a bin has >2000 counts, and if more than 50% of those come from <1% of pixels, then it is considered to be noise-dominated and hence unusable.
| Quadrant | # 1 sec bins | Bins with >0 counts | Bins with >2000 counts | High rate bins dominated by noise | Noise dominated (total time) | Noise dominated (detector-on time) | Marked lightcurve |
|---|---|---|---|---|---|---|---|
| A | 7474 | 6706 | 1 | 1 | 0.01% | 0.01% | 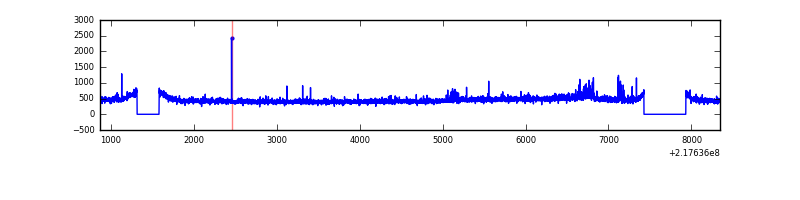 |
| B | 7474 | 6706 | 95 | 95 | 1.27% | 1.42% | 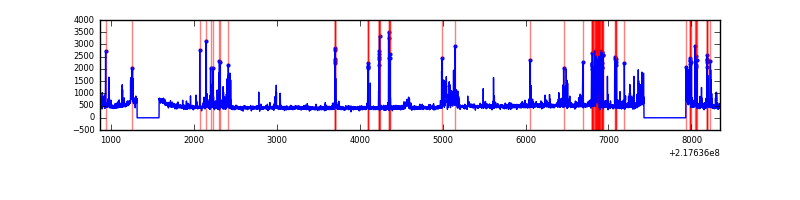 |
| C | 7474 | 6706 | 0 | 0 | 0.00% | 0.00% |  |
| D | 7474 | 6705 | 307 | 307 | 4.11% | 4.58% | 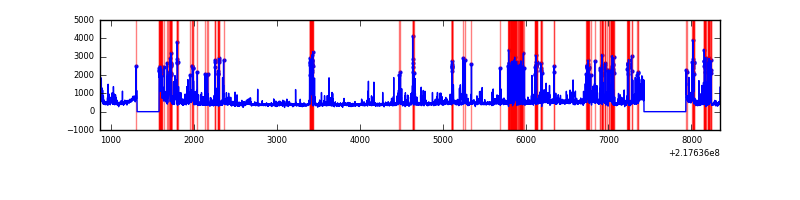 |
Top three noisy pixels from each quadrant. If the there are fewer than three noisy pixels in the level2.evt file, extra rows are filled as -1
| Pixel properties | Quadrant properties | ||||||
|---|---|---|---|---|---|---|---|
| Quadrant | DetID | PixID | Counts | Sigma | Mean | Median | Sigma |
| A | 14 | 111 | 58275 | 365.31 | 761 | 744 | 157.5 |
| A | 15 | 236 | 36205 | 225.17 | 761 | 744 | 157.5 |
| A | 8 | 15 | 15454 | 93.4 | 761 | 744 | 157.5 |
| B | 3 | 64 | 558796 | 3804.02 | 760 | 743 | 146.7 |
| B | 0 | 219 | 96425 | 652.23 | 760 | 743 | 146.7 |
| B | 4 | 80 | 28551 | 189.56 | 760 | 743 | 146.7 |
| C | 13 | 61 | 5859 | 29.5 | 740 | 743 | 173.4 |
| C | 8 | 222 | 4398 | 21.08 | 740 | 743 | 173.4 |
| C | 3 | 202 | 1878 | 6.55 | 740 | 743 | 173.4 |
| D | 12 | 220 | 1355777 | 7711.27 | 716 | 693 | 175.7 |
| D | 2 | 33 | 65465 | 368.59 | 716 | 693 | 175.7 |
| D | 5 | 97 | 46865 | 262.75 | 716 | 693 | 175.7 |
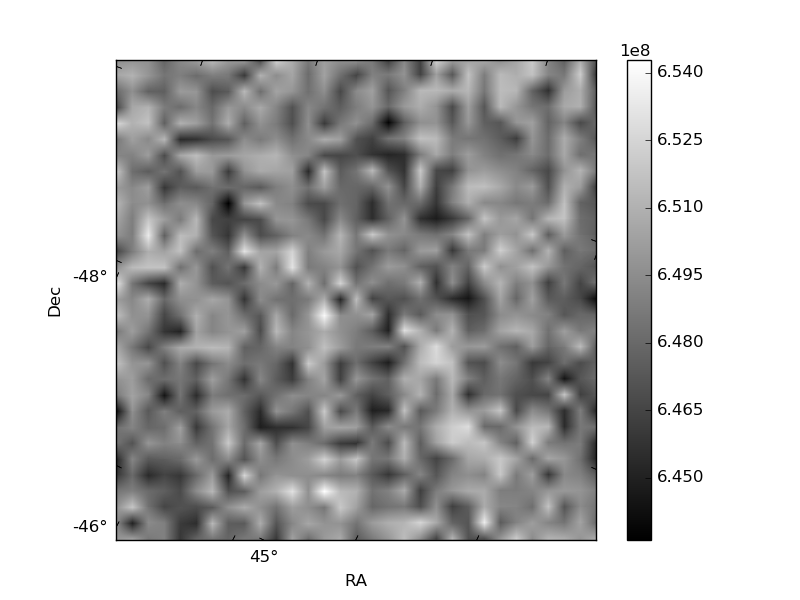
Histogram calculated using DETX and DETY for each event in the final _common_clean file
| Quadrant A | 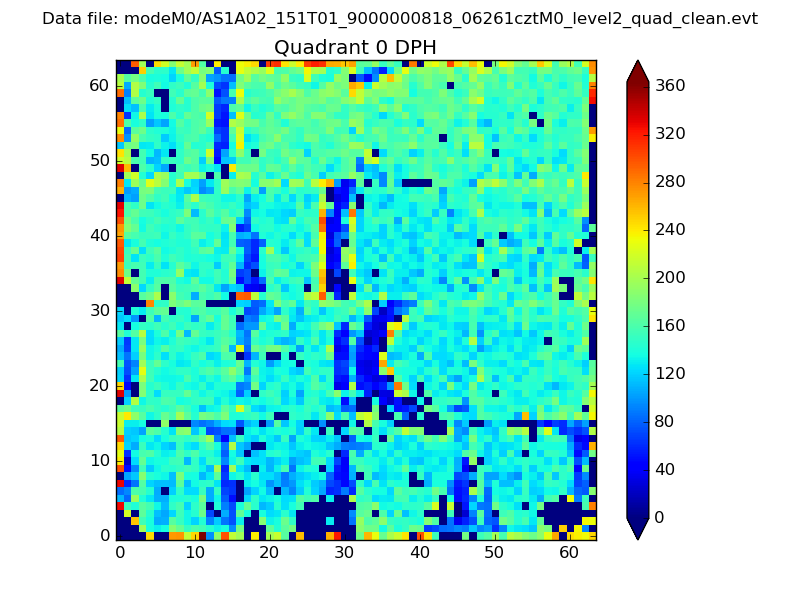 |
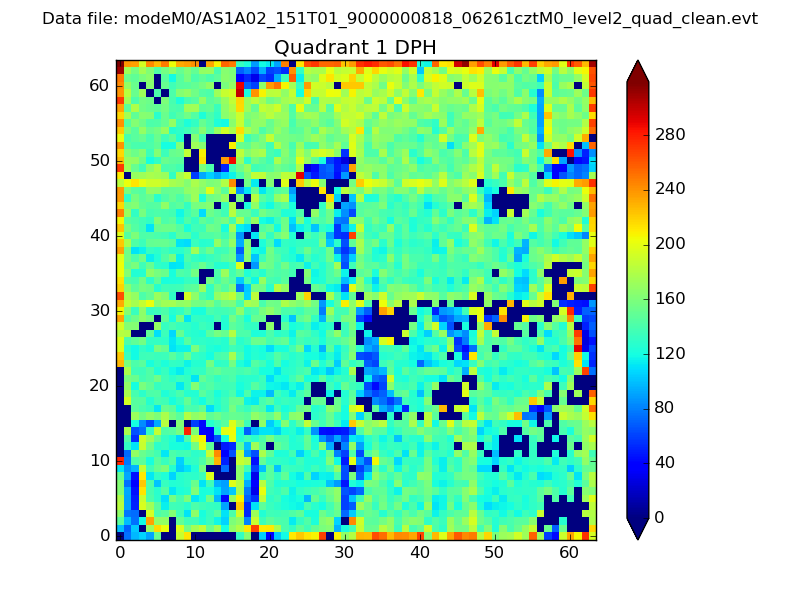 |
Quadrant B |
|---|---|---|---|
| Quadrant D | 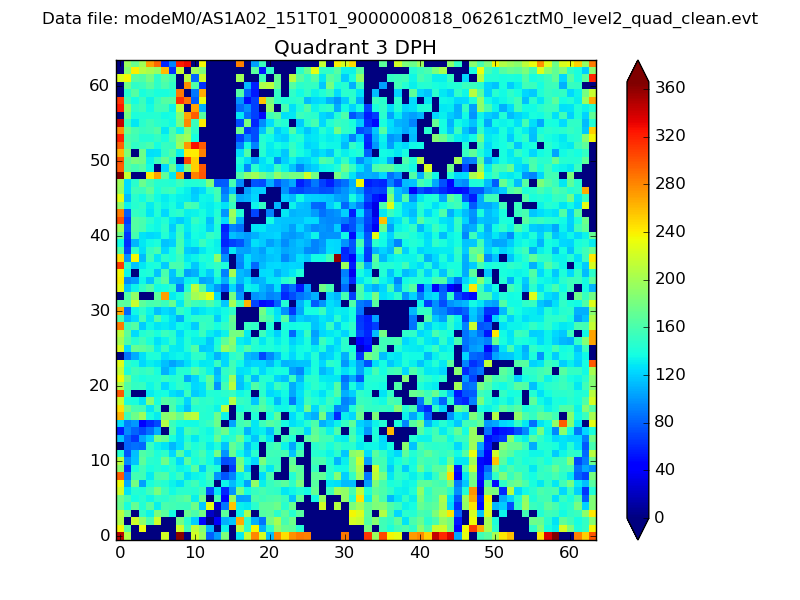 |
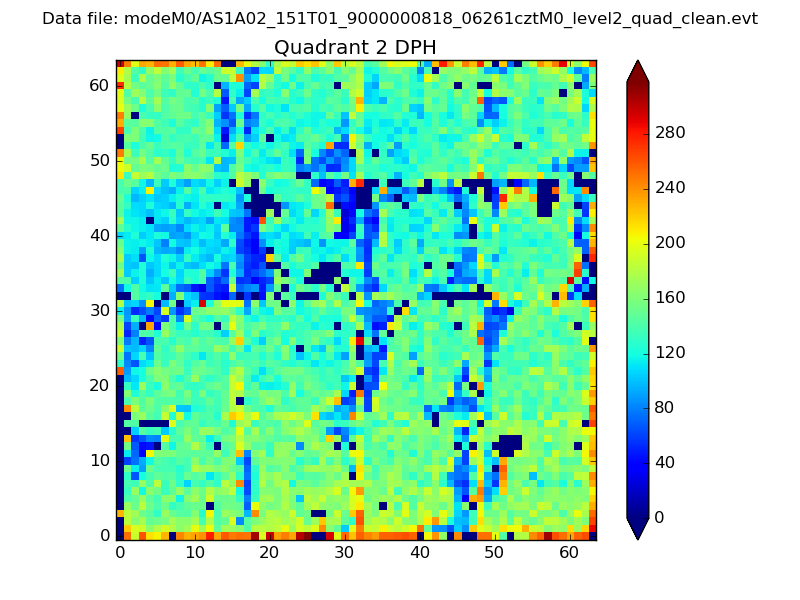 |
Quadrant C |
| Plot type | Count rate plots | Images |
|---|---|---|
| Comparison with Poisson distribution Blue bars denote a histogram of data divided into 1 sec bins. Red curve is a Poisson curve with rate = median count rate of data. |
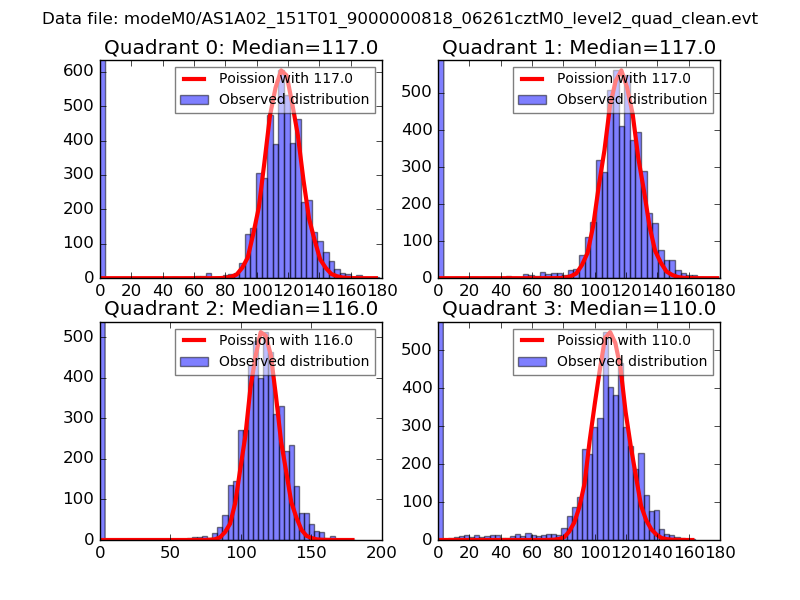 |
 |
| Quadrant-wise count rates Data is divided into 100 sec bins |
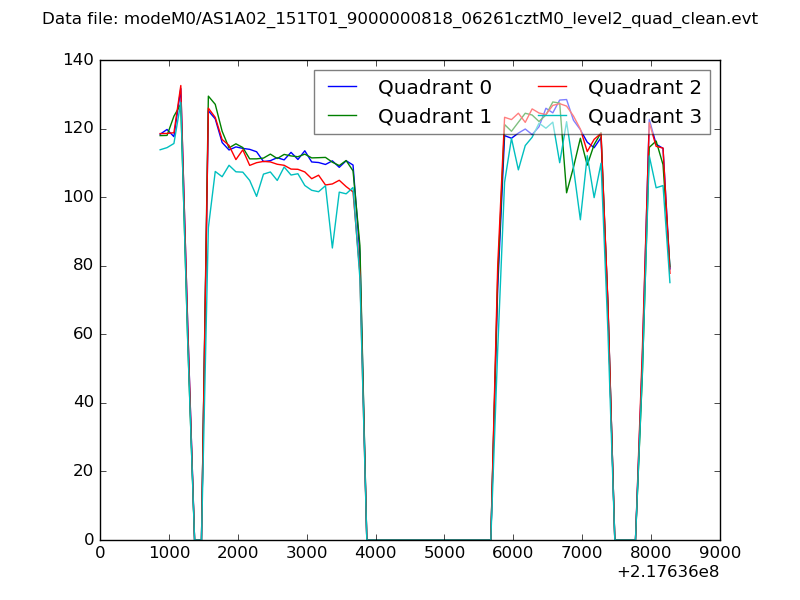 |
|
| Module-wise count rates for Quadrant A Data is divided into 100 sec bins |
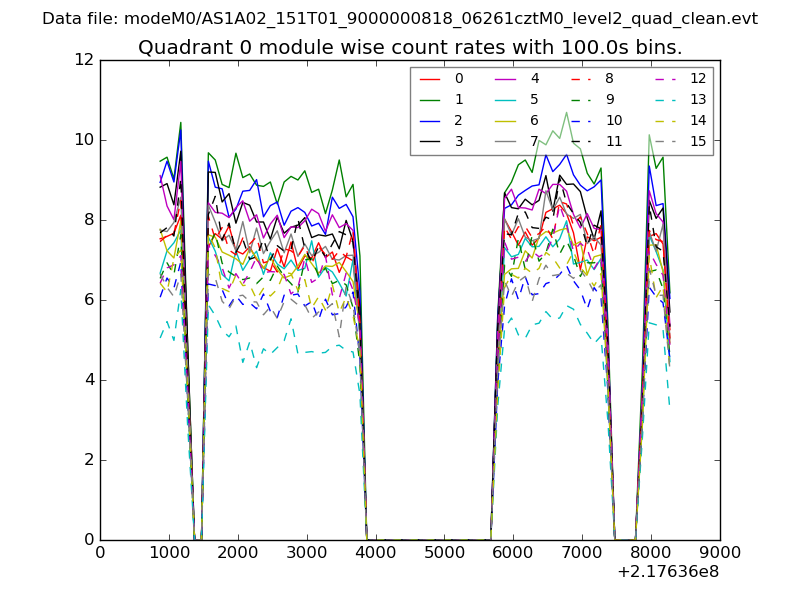 |
 |
| Module-wise count rates for Quadrant B Data is divided into 100 sec bins |
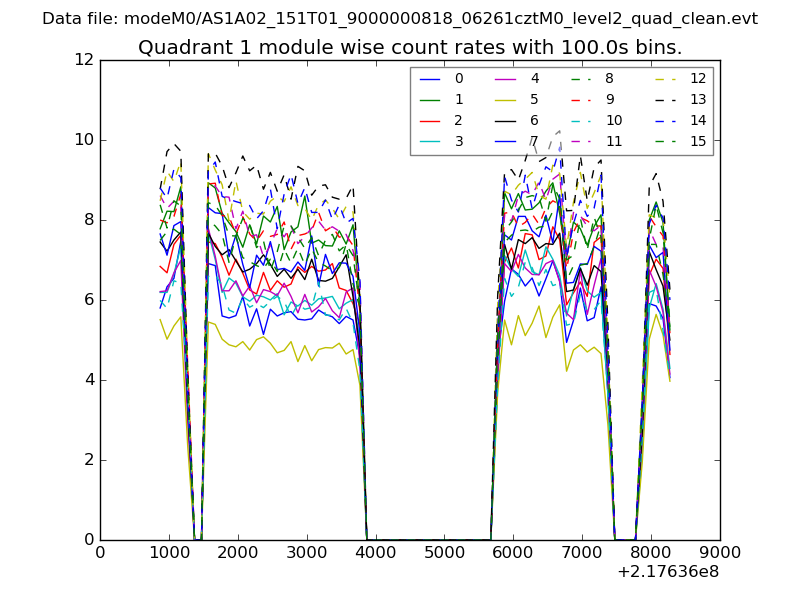 |
 |
| Module-wise count rates for Quadrant C Data is divided into 100 sec bins |
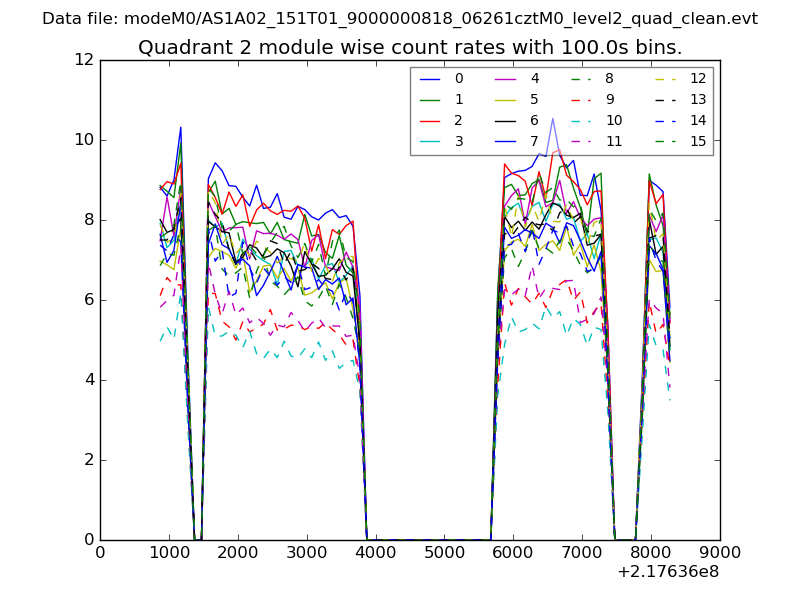 |
 |
| Module-wise count rates for Quadrant D Data is divided into 100 sec bins |
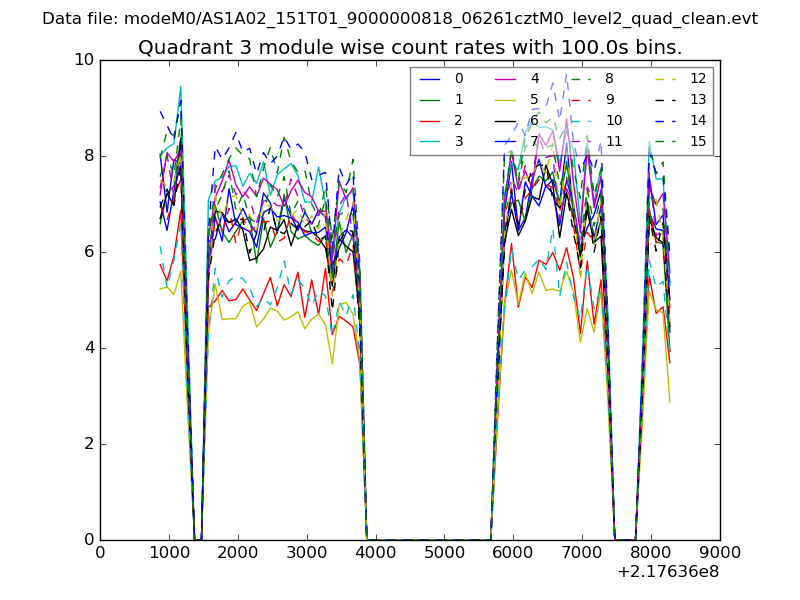 |
 |
| Parameter | Plot |
|---|---|
| CZT HV Monitor | 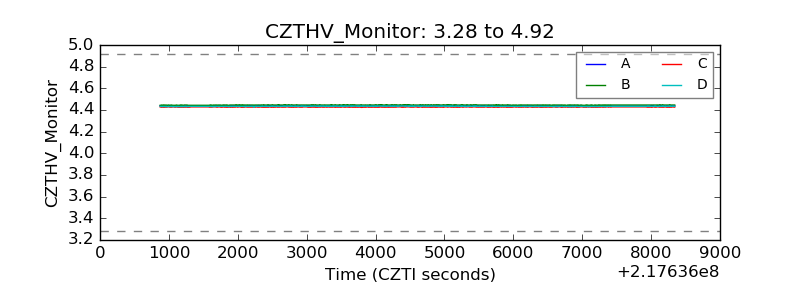 |
| D_VDD | 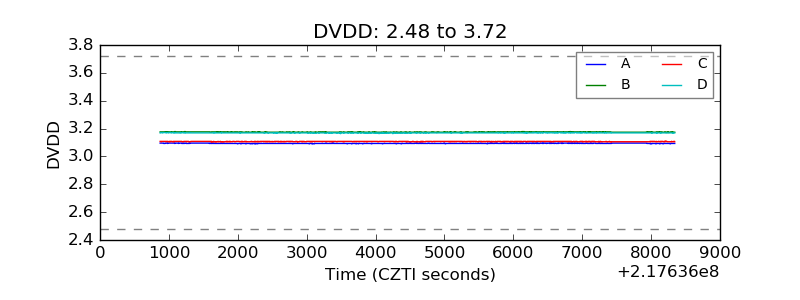 |
| Temperature 1 | 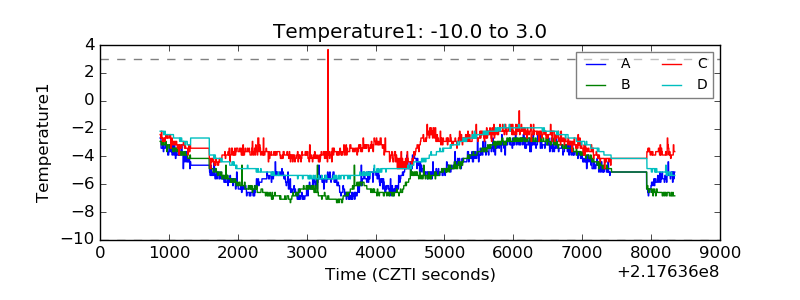 |
| Veto HV Monitor | 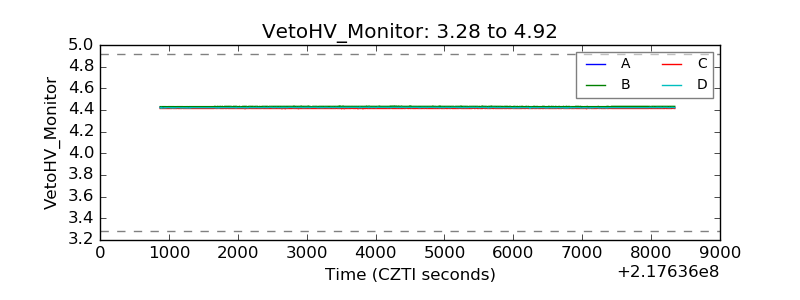 |
| Veto LLD | 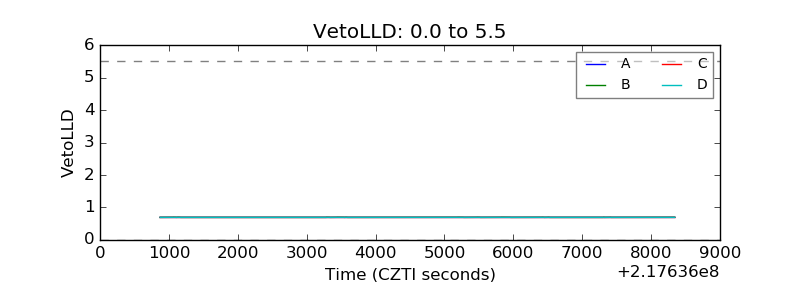 |
| Alpha Counter | 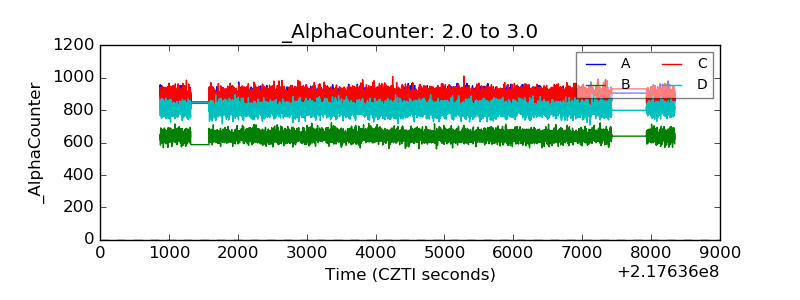 |
| _CPM_Rate | 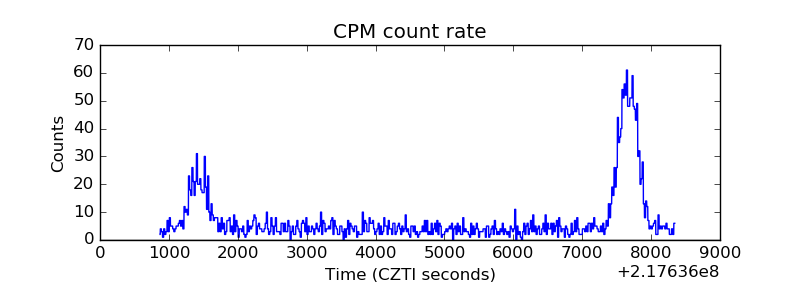 |
| CZT Counter | 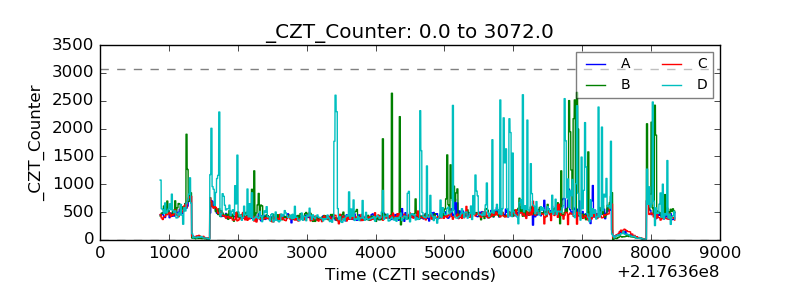 |
| +2.5 Volts monitor |  |
| +5 Volts monitor | 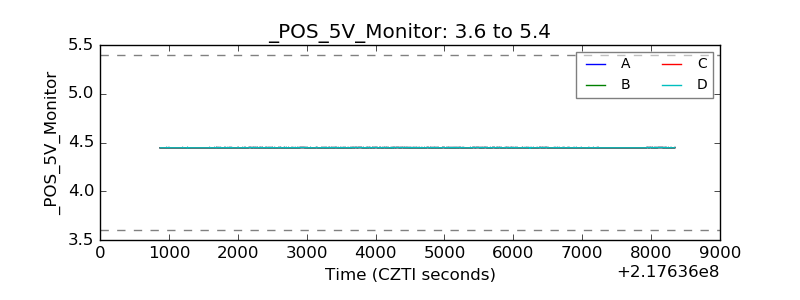 |
| _ROLL_ROT | 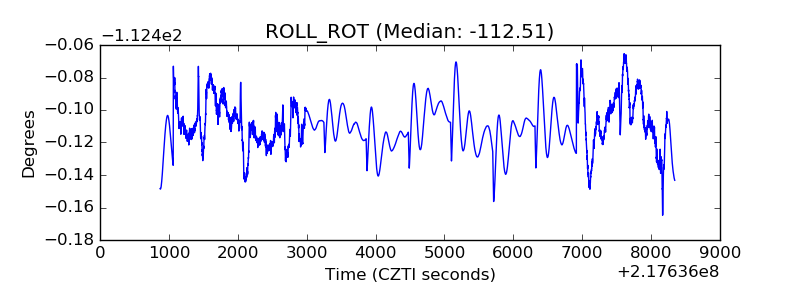 |
| _Roll_DEC | 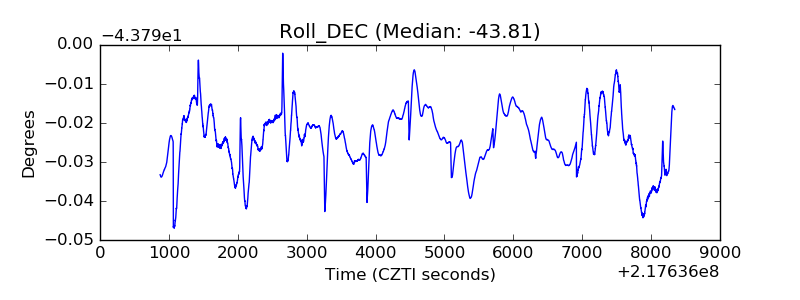 |
| _Roll_RA | 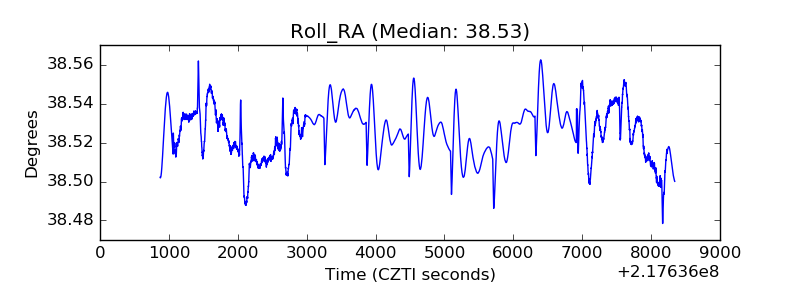 |
| Veto Counter | 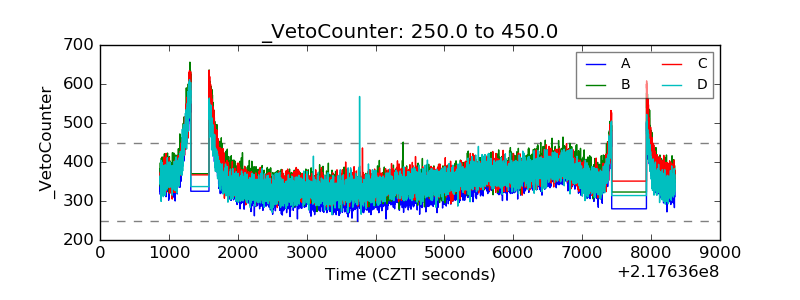 |