| Param | Original file | Final file |
|---|---|---|
| Filename | modeM0/AS1C02_018T01_9000000822cztM0_level2.fits | modeM0/AS1C02_018T01_9000000822cztM0_level2_quad_clean.evt |
| Size (bytes) | 411,871,680 | 389,741,760 |
| Size | 392.8 MB | 371.7 MB |
| Events in quadrant A | 2,487,888 | 2,271,530 |
| Events in quadrant B | 2,386,624 | 2,245,127 |
| Events in quadrant C | 2,475,664 | 2,260,779 |
| Events in quadrant D | 2,040,690 | 1,944,223 |
| Mode SS | |||
|---|---|---|---|
| Quadrant | BADHDUFLAG | Total packets | Discarded packets |
| A | 0 | 916 | 0 |
| B | 0 | 916 | 0 |
| C | 0 | 916 | 0 |
| D | 0 | 916 | 0 |
| Mode M0 | |||
|---|---|---|---|
| Quadrant | BADHDUFLAG | Total packets | Discarded packets |
| A | 0 | 102641 | 0 |
| B | 0 | 107123 | 0 |
| C | 0 | 92150 | 0 |
| D | 0 | 145636 | 0 |
| Mode M9 | |||
|---|---|---|---|
| Quadrant | BADHDUFLAG | Total packets | Discarded packets |
| A | 0 | 80 | 0 |
| B | 0 | 80 | 0 |
| C | 0 | 80 | 0 |
| D | 0 | 80 | 0 |
| Quadrant | Total seconds | Saturated seconds | Saturation percentage |
|---|---|---|---|
| A | 44881 | 633 | 1.410396% |
| B | 44888 | 1303 | 2.902780% |
| C | 44880 | 240 | 0.534759% |
| D | 44877 | 3524 | 7.852575% |
Noise dominated data is calculated using 1-second bins in cleaned event files. If a bin has >2000 counts, and if more than 50% of those come from <1% of pixels, then it is considered to be noise-dominated and hence unusable.
| Quadrant | # 1 sec bins | Bins with >0 counts | Bins with >2000 counts | High rate bins dominated by noise | Noise dominated (total time) | Noise dominated (detector-on time) | Marked lightcurve |
|---|---|---|---|---|---|---|---|
| A | 53720 | 44894 | 0 | 0 | 0.00% | 0.00% |  |
| B | 53720 | 44892 | 0 | 0 | 0.00% | 0.00% | 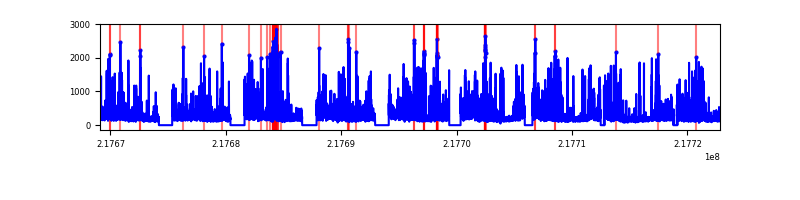 |
| C | 53720 | 44903 | 0 | 0 | 0.00% | 0.00% | 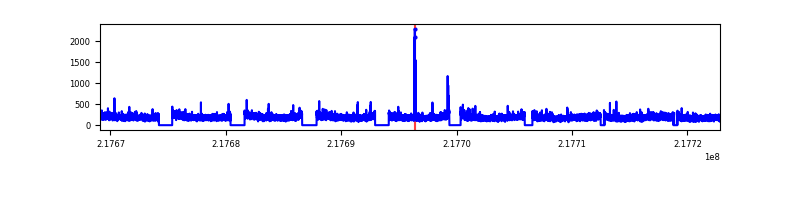 |
| D | 53720 | 44802 | 0 | 0 | 0.00% | 0.00% |  |
Top three noisy pixels from each quadrant. If the there are fewer than three noisy pixels in the level2.evt file, extra rows are filled as -1
| Pixel properties | Quadrant properties | ||||||
|---|---|---|---|---|---|---|---|
| Quadrant | DetID | PixID | Counts | Sigma | Mean | Median | Sigma |
| A | 14 | 188 | 2562 | 11.86 | 647 | 605 | 165.0 |
| A | 0 | 29 | 2352 | 10.59 | 647 | 605 | 165.0 |
| A | 14 | 204 | 2209 | 9.72 | 647 | 605 | 165.0 |
| B | 2 | 9 | 1992 | 10.82 | 630 | 597 | 128.9 |
| B | 14 | 254 | 1692 | 8.5 | 630 | 597 | 128.9 |
| B | 12 | 226 | 1683 | 8.43 | 630 | 597 | 128.9 |
| C | 1 | 81 | 1786 | 6.67 | 653 | 603 | 177.3 |
| C | 12 | 241 | 1783 | 6.66 | 653 | 603 | 177.3 |
| C | 1 | 80 | 1764 | 6.55 | 653 | 603 | 177.3 |
| D | 3 | 14 | 1566 | 6.59 | 581 | 528 | 157.6 |
| D | 11 | 82 | 1512 | 6.25 | 581 | 528 | 157.6 |
| D | 3 | 31 | 1512 | 6.25 | 581 | 528 | 157.6 |
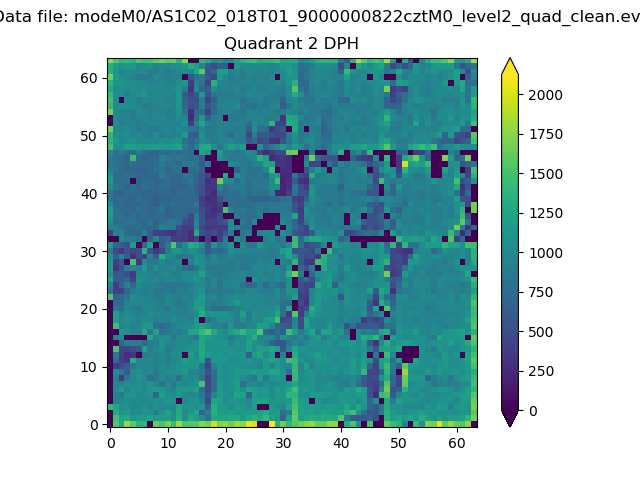
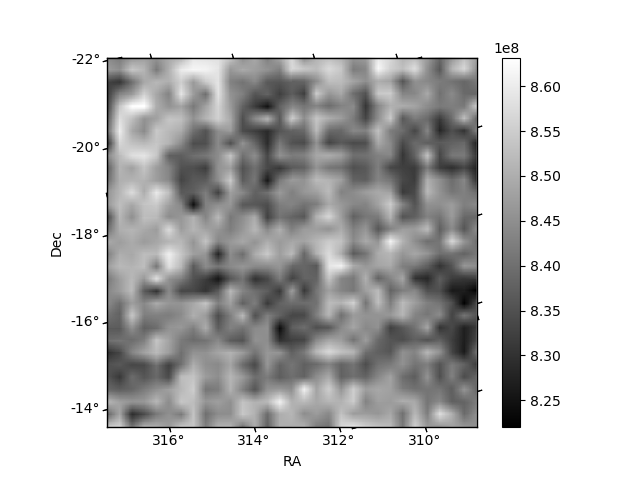
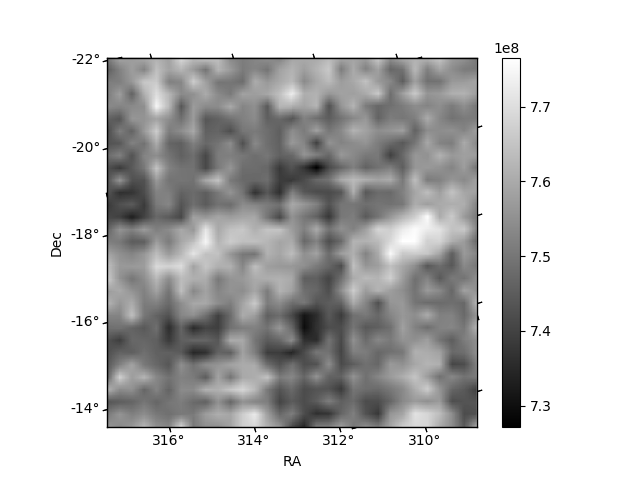
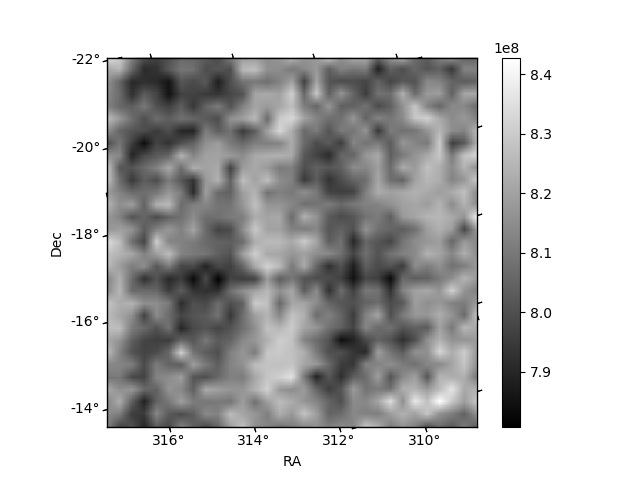
Histogram calculated using DETX and DETY for each event in the final _common_clean file
| Quadrant A | 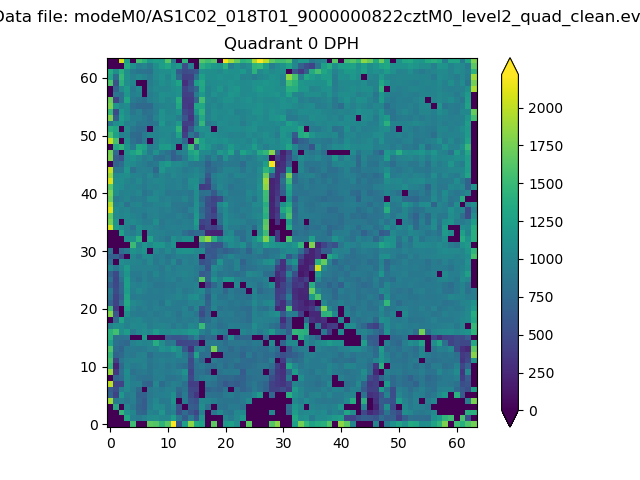 |
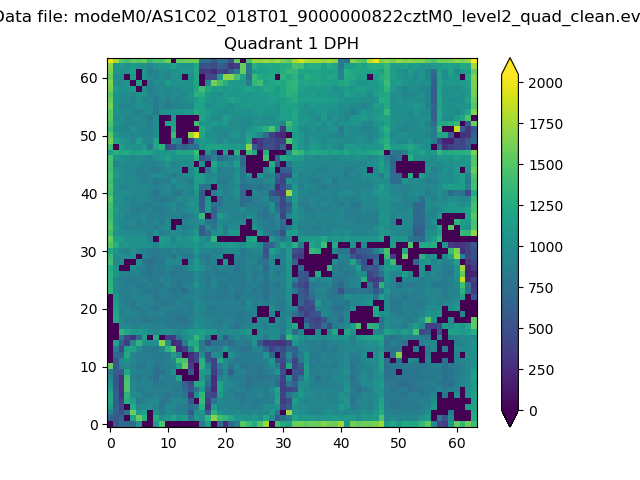 |
Quadrant B |
|---|---|---|---|
| Quadrant D | 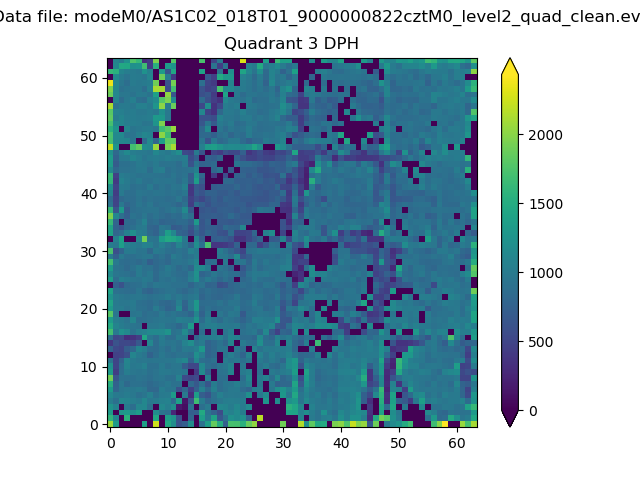 |
 |
Quadrant C |
| Plot type | Count rate plots | Images |
|---|---|---|
| Comparison with Poisson distribution Blue bars denote a histogram of data divided into 1 sec bins. Red curve is a Poisson curve with rate = median count rate of data. |
 |
 |
| Quadrant-wise count rates Data is divided into 100 sec bins |
 |
|
| Module-wise count rates for Quadrant A Data is divided into 100 sec bins |
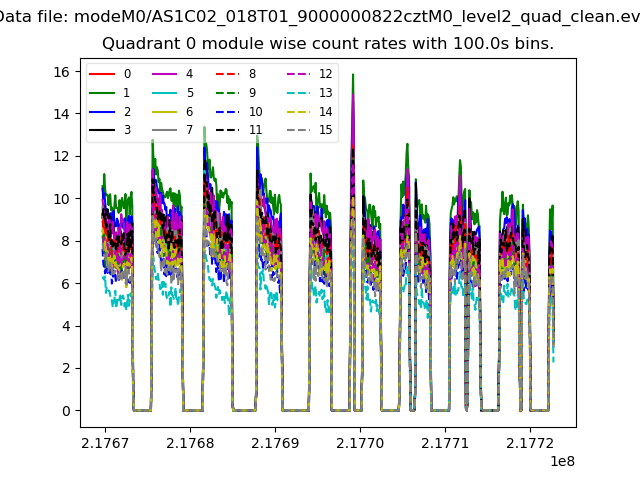 |
 |
| Module-wise count rates for Quadrant B Data is divided into 100 sec bins |
 |
 |
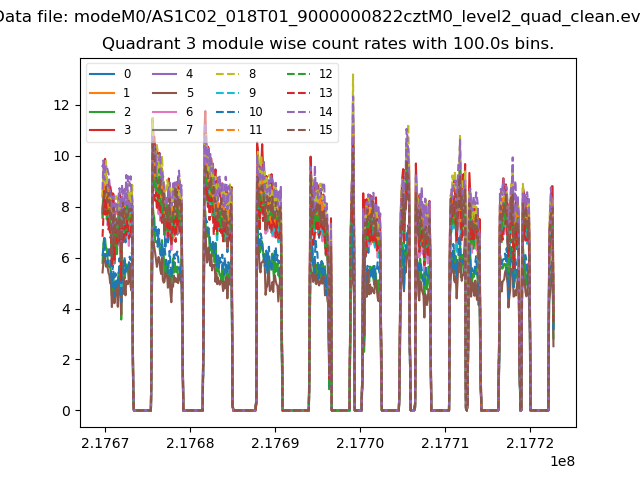
| Module-wise count rates for Quadrant C Data is divided into 100 sec bins |
 |
 |
| Module-wise count rates for Quadrant D Data is divided into 100 sec bins |
 |
 |
| Parameter | Plot |
|---|---|
| CZT HV Monitor | 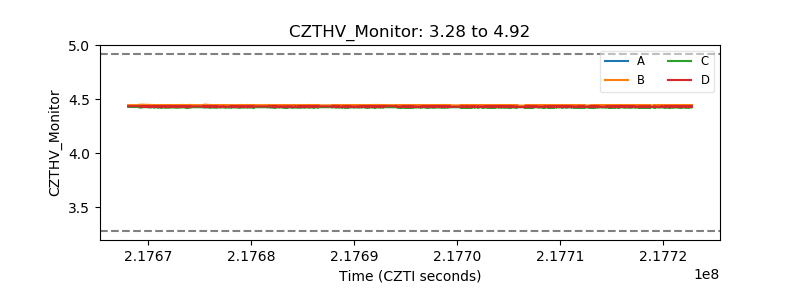 |
| D_VDD | 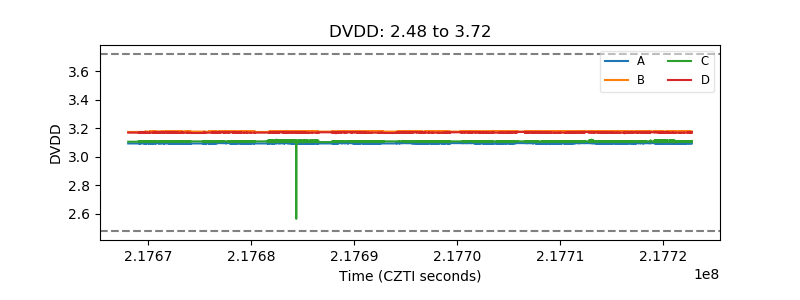 |
| Temperature 1 | 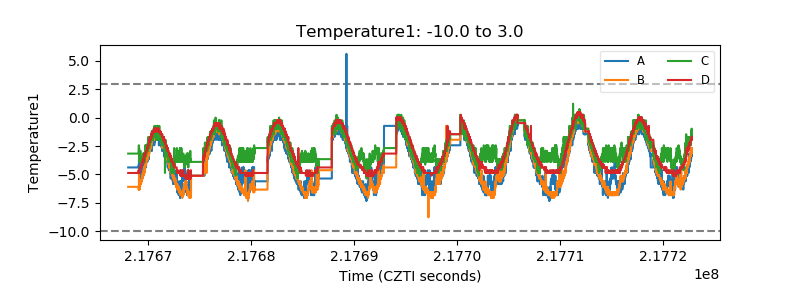 |
| Veto HV Monitor |  |
| Veto LLD | 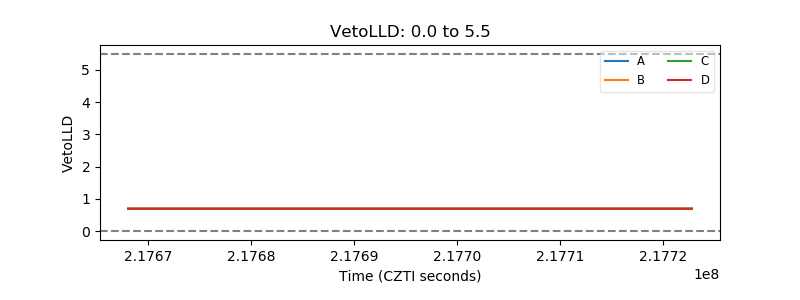 |
| Alpha Counter | 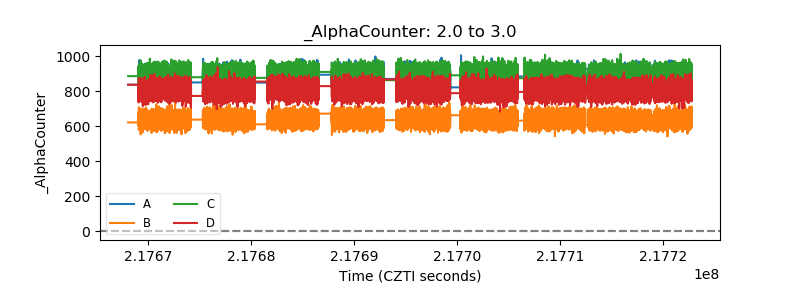 |
| _CPM_Rate |  |
| CZT Counter | 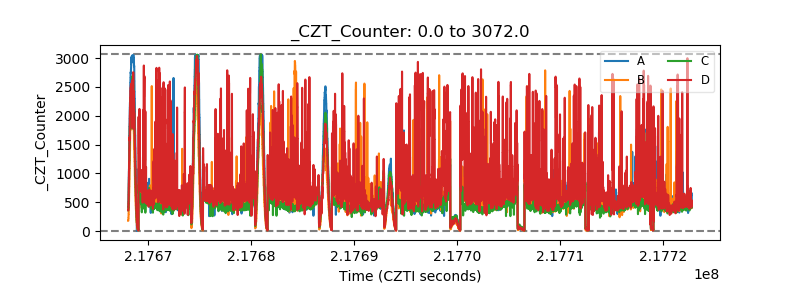 |
| +2.5 Volts monitor | 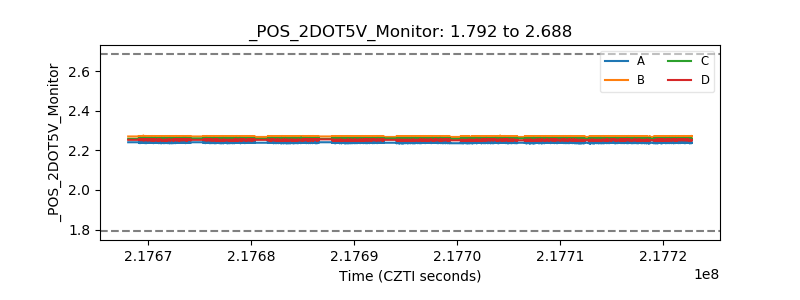 |
| +5 Volts monitor |  |
| _ROLL_ROT | 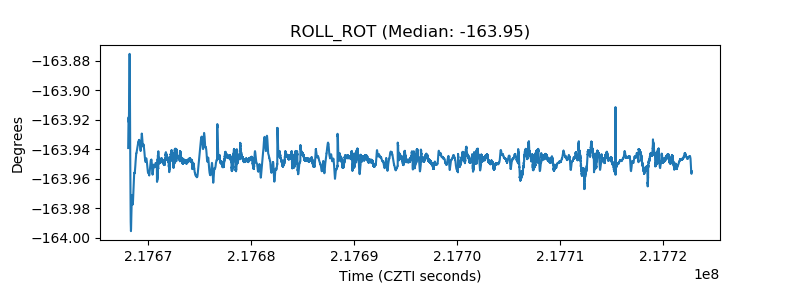 |
| _Roll_DEC | 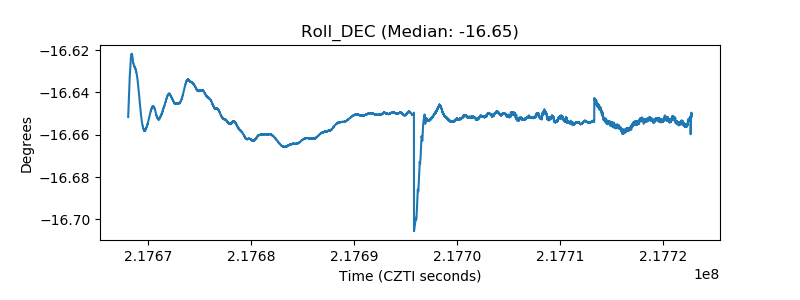 |
| _Roll_RA |  |
| Veto Counter |  |