| Param | Original file | Final file |
|---|---|---|
| Filename | modeM0/AS1C02_018T01_9000000822_06264cztM0_level2.evt | modeM0/AS1C02_018T01_9000000822_06264cztM0_level2_quad_clean.evt |
| Size (bytes) | 121,216,320 | 17,778,240 |
| Size | 115.6 MB | 17.0 MB |
| Events in quadrant A | 805,290 | 107,636 |
| Events in quadrant B | 858,748 | 110,629 |
| Events in quadrant C | 727,411 | 112,012 |
| Events in quadrant D | 1,183,271 | 104,526 |
| Mode SS | |||
|---|---|---|---|
| Quadrant | BADHDUFLAG | Total packets | Discarded packets |
| A | 0 | 28 | 0 |
| B | 0 | 28 | 0 |
| C | 0 | 28 | 0 |
| D | 0 | 28 | 0 |
| Mode M0 | |||
|---|---|---|---|
| Quadrant | BADHDUFLAG | Total packets | Discarded packets |
| A | 0 | 3224 | 2 |
| B | 0 | 3389 | 1 |
| C | 0 | 2947 | 1 |
| D | 0 | 4411 | 1 |
| Mode M9 | |||
|---|---|---|---|
| Quadrant | BADHDUFLAG | Total packets | Discarded packets |
| A | 0 | 11 | 0 |
| B | 0 | 11 | 0 |
| C | 0 | 11 | 0 |
| D | 0 | 11 | 0 |
| Quadrant | Total seconds | Saturated seconds | Saturation percentage |
|---|---|---|---|
| A | 1385 | 17 | 1.227437% |
| B | 1385 | 34 | 2.454874% |
| C | 1385 | 4 | 0.288809% |
| D | 1385 | 116 | 8.375451% |
Noise dominated data is calculated using 1-second bins in cleaned event files. If a bin has >2000 counts, and if more than 50% of those come from <1% of pixels, then it is considered to be noise-dominated and hence unusable.
| Quadrant | # 1 sec bins | Bins with >0 counts | Bins with >2000 counts | High rate bins dominated by noise | Noise dominated (total time) | Noise dominated (detector-on time) | Marked lightcurve |
|---|---|---|---|---|---|---|---|
| A | 1385 | 1385 | 0 | 0 | 0.00% | 0.00% | 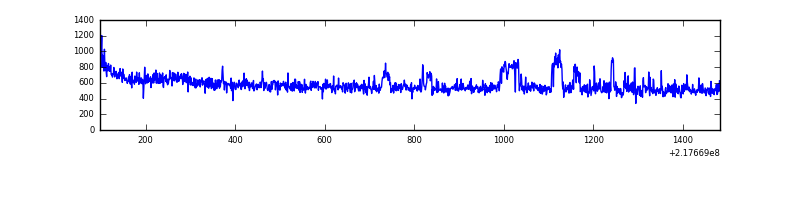 |
| B | 1385 | 1385 | 13 | 13 | 0.94% | 0.94% | 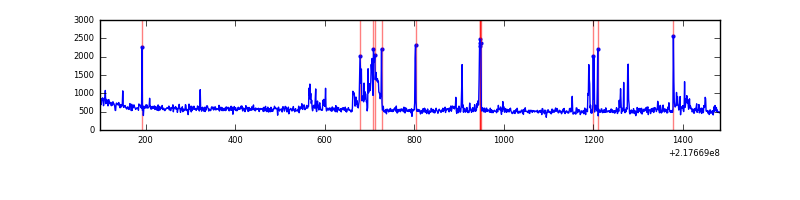 |
| C | 1385 | 1385 | 0 | 0 | 0.00% | 0.00% | 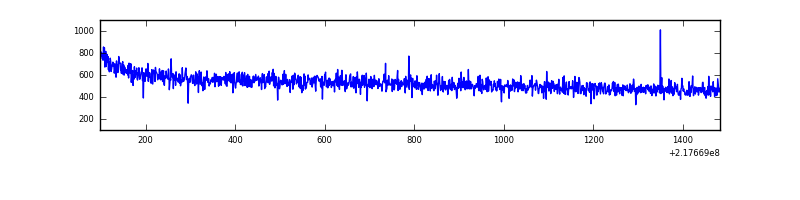 |
| D | 1385 | 1385 | 85 | 85 | 6.14% | 6.14% | 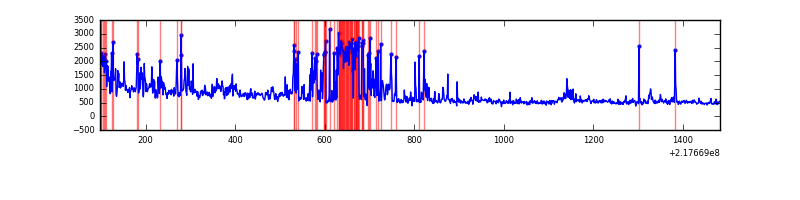 |
Top three noisy pixels from each quadrant. If the there are fewer than three noisy pixels in the level2.evt file, extra rows are filled as -1
| Pixel properties | Quadrant properties | ||||||
|---|---|---|---|---|---|---|---|
| Quadrant | DetID | PixID | Counts | Sigma | Mean | Median | Sigma |
| A | 3 | 80 | 53724 | 1309.04 | 193 | 190 | 40.9 |
| A | 8 | 15 | 4905 | 115.29 | 193 | 190 | 40.9 |
| A | 0 | 226 | 1950 | 43.04 | 193 | 190 | 40.9 |
| B | 3 | 64 | 85188 | 2206.4 | 190 | 186 | 38.5 |
| B | 4 | 81 | 16609 | 426.29 | 190 | 186 | 38.5 |
| B | 11 | 51 | 12075 | 308.6 | 190 | 186 | 38.5 |
| C | 13 | 61 | 1446 | 28.23 | 186 | 186 | 44.6 |
| C | 8 | 222 | 705 | 11.63 | 186 | 186 | 44.6 |
| C | 3 | 202 | 474 | 6.45 | 186 | 186 | 44.6 |
| D | 12 | 220 | 315937 | 6833.18 | 182 | 176 | 46.2 |
| D | 2 | 63 | 98514 | 2128.06 | 182 | 176 | 46.2 |
| D | 2 | 152 | 29246 | 629.08 | 182 | 176 | 46.2 |
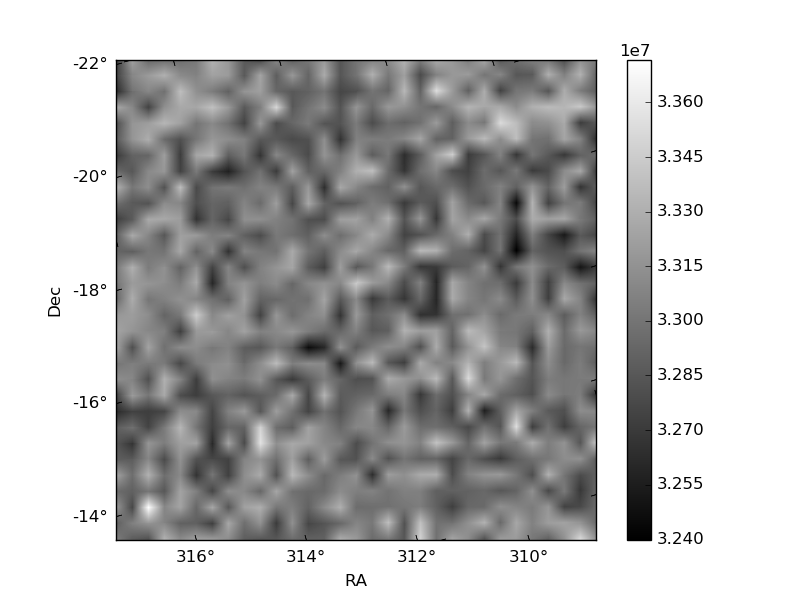
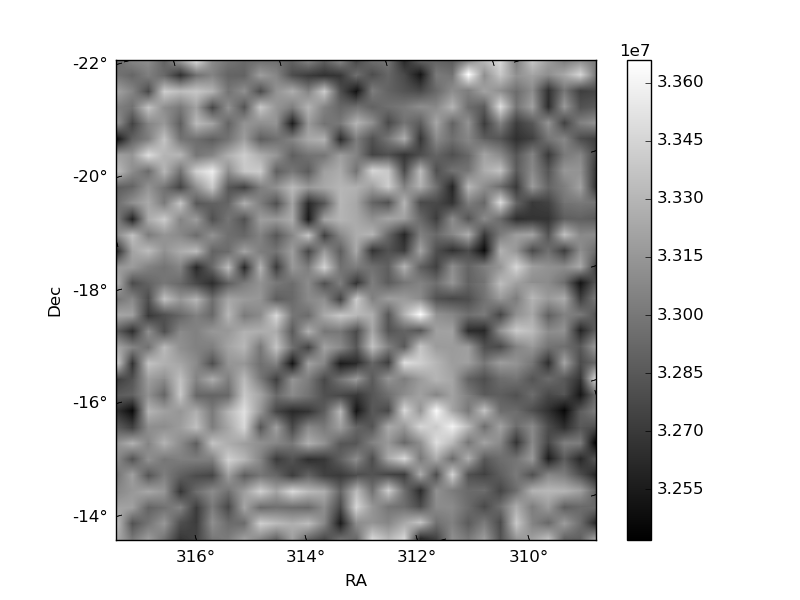
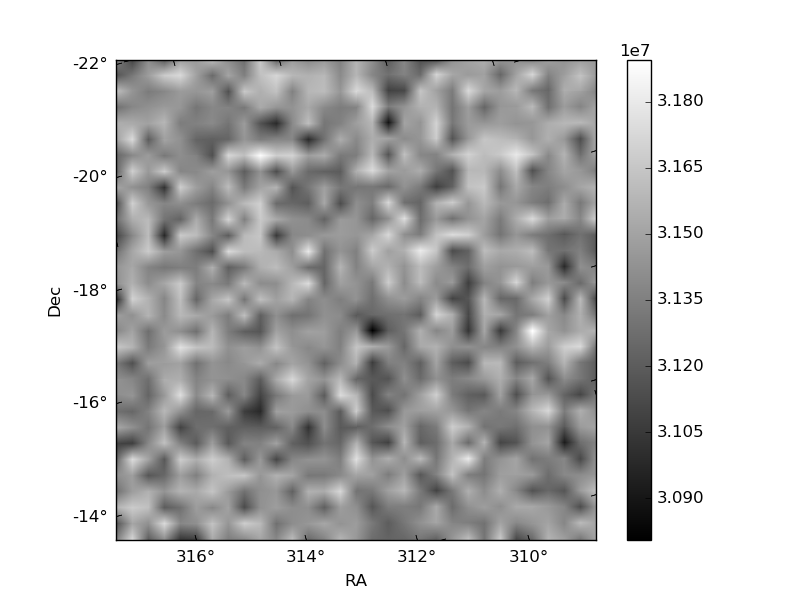
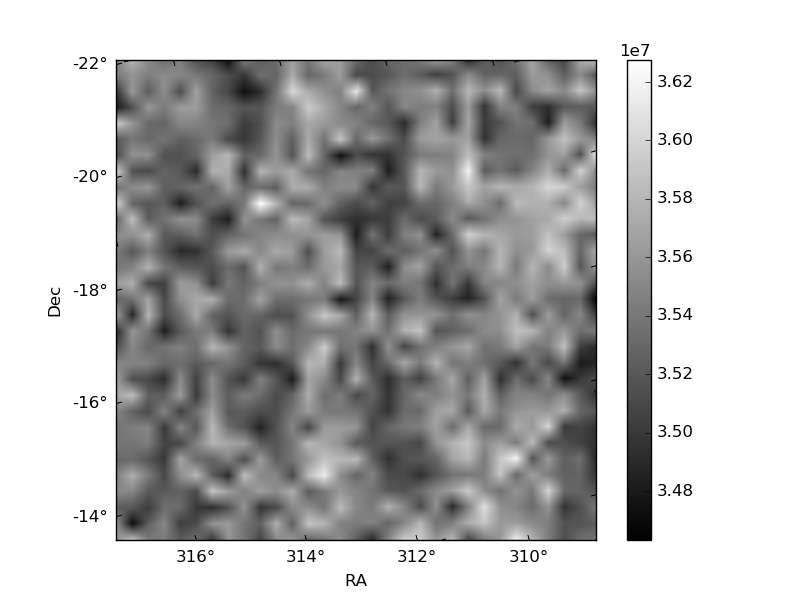
Histogram calculated using DETX and DETY for each event in the final _common_clean file
| Quadrant A | 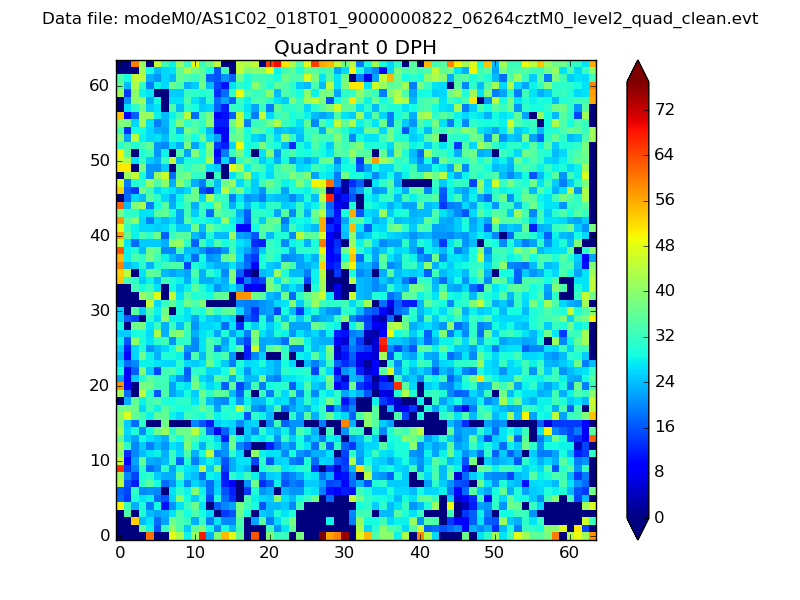 |
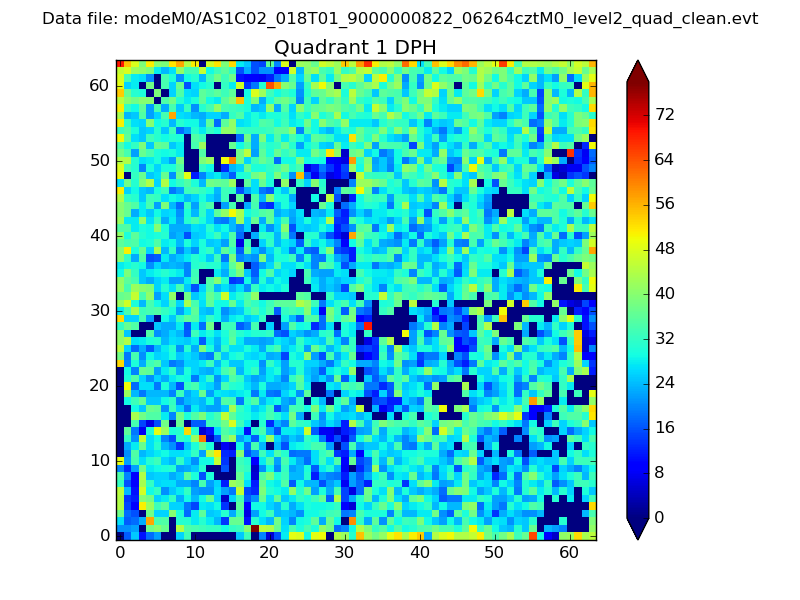 |
Quadrant B |
|---|---|---|---|
| Quadrant D |  |
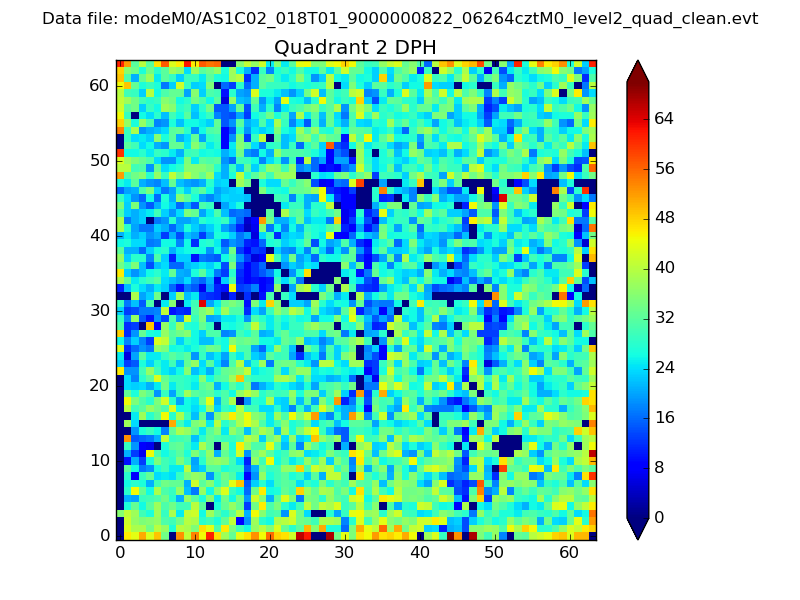 |
Quadrant C |
| Plot type | Count rate plots | Images |
|---|---|---|
| Comparison with Poisson distribution Blue bars denote a histogram of data divided into 1 sec bins. Red curve is a Poisson curve with rate = median count rate of data. |
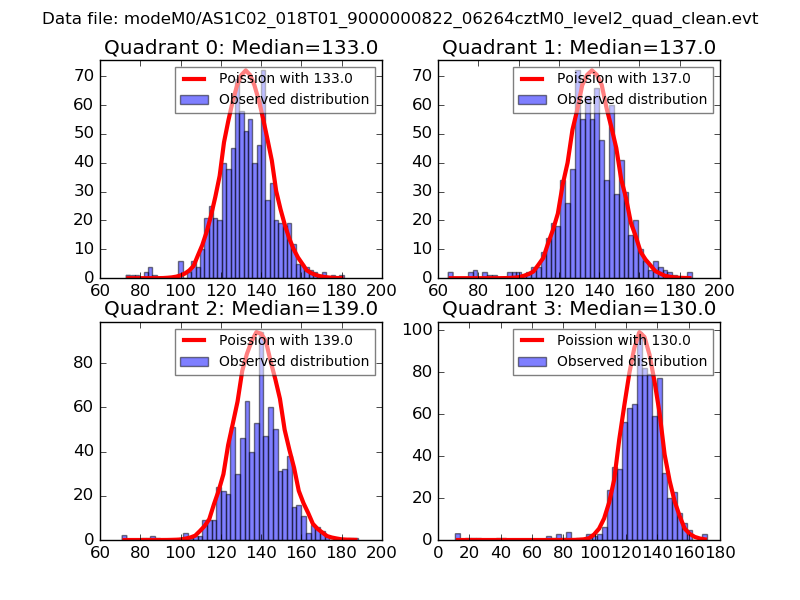 |
 |
| Quadrant-wise count rates Data is divided into 100 sec bins |
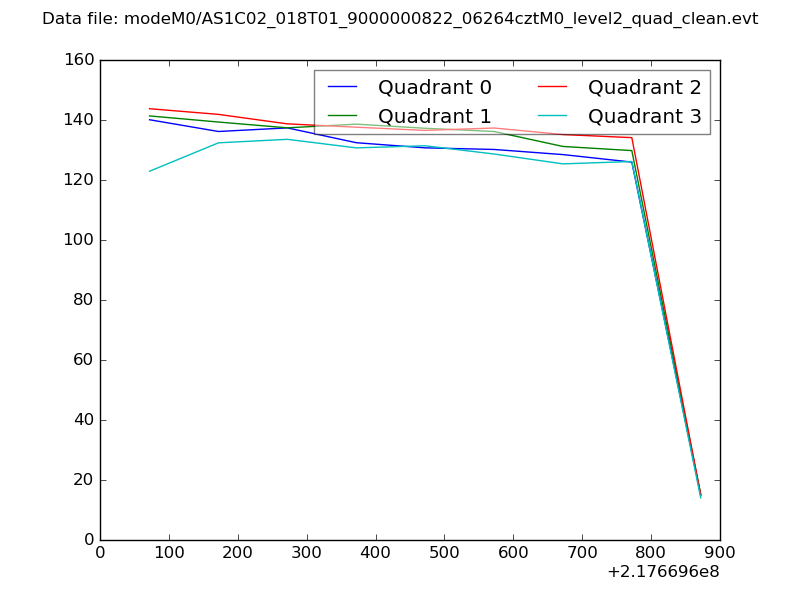 |
|
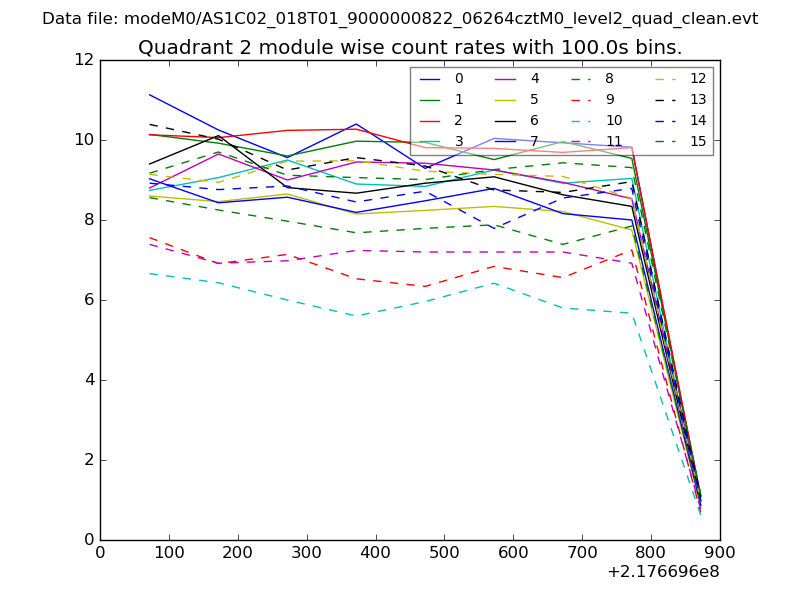
| Module-wise count rates for Quadrant A Data is divided into 100 sec bins |
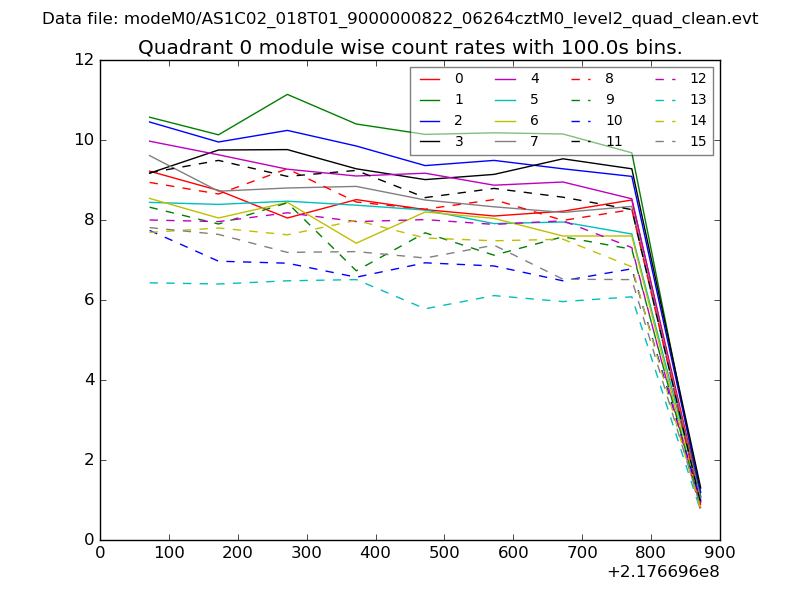 |
 |
| Module-wise count rates for Quadrant B Data is divided into 100 sec bins |
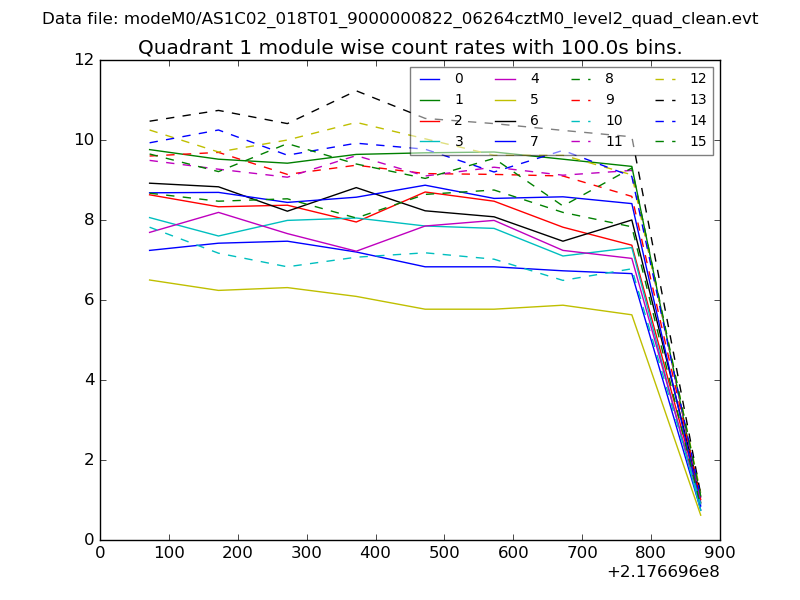 |
 |
| Module-wise count rates for Quadrant C Data is divided into 100 sec bins |
 |
 |
| Module-wise count rates for Quadrant D Data is divided into 100 sec bins |
 |
 |
| Parameter | Plot |
|---|---|
| CZT HV Monitor | 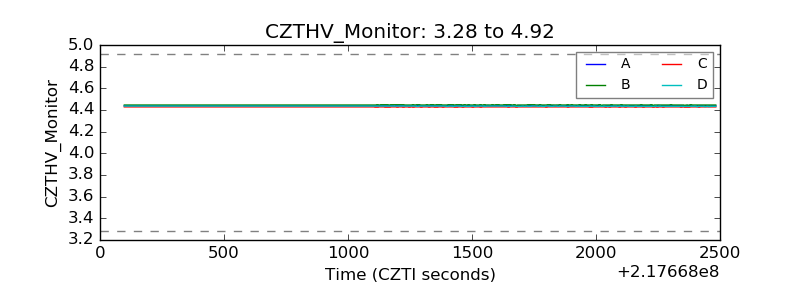 |
| D_VDD | 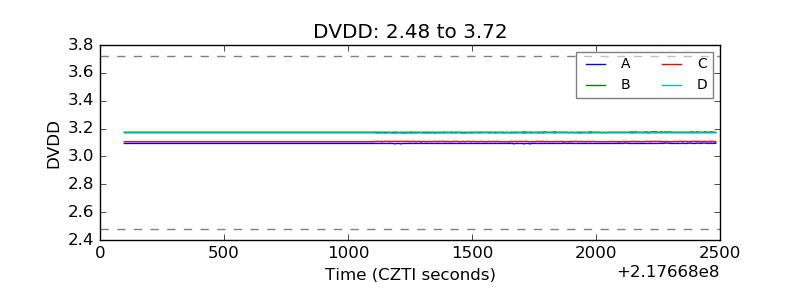 |
| Temperature 1 | 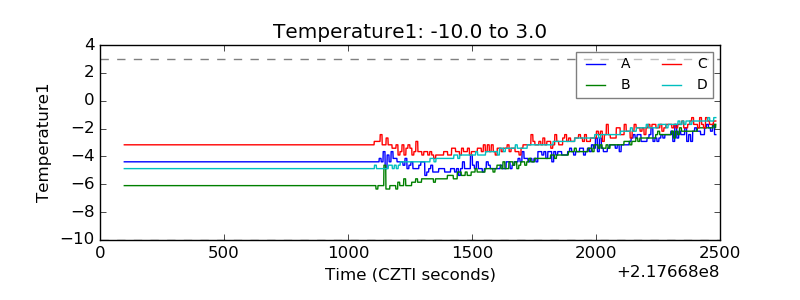 |
| Veto HV Monitor | 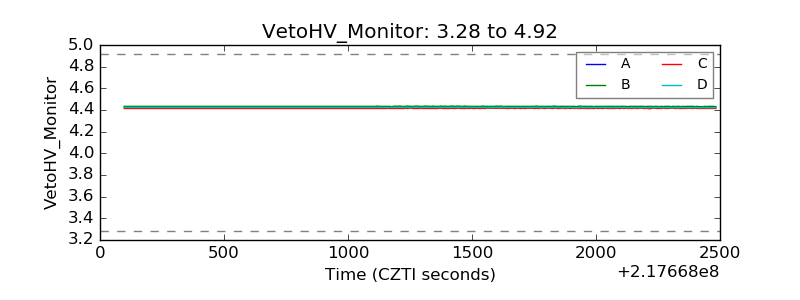 |
| Veto LLD | 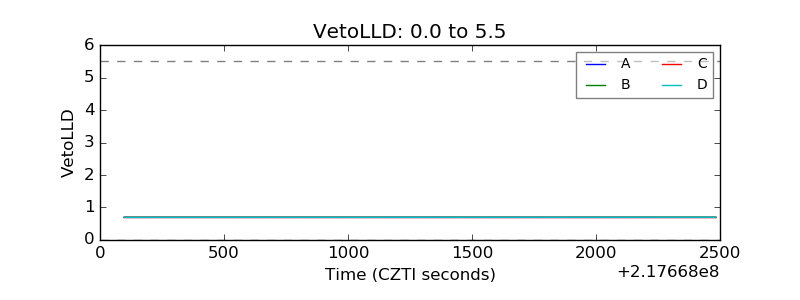 |
| Alpha Counter | 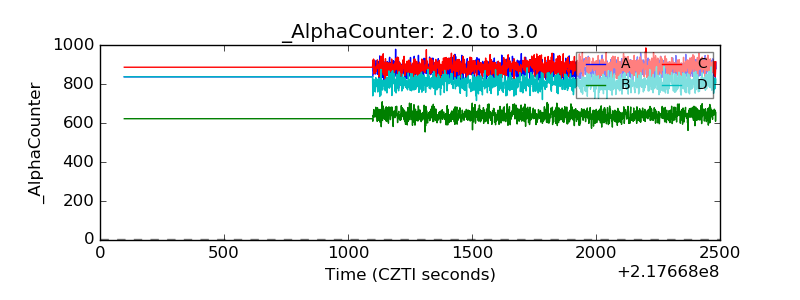 |
| _CPM_Rate | 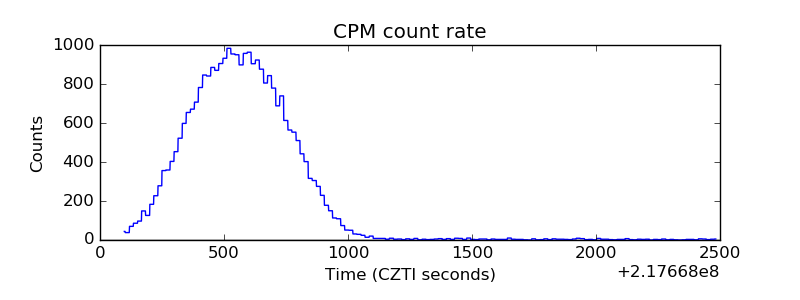 |
| CZT Counter | 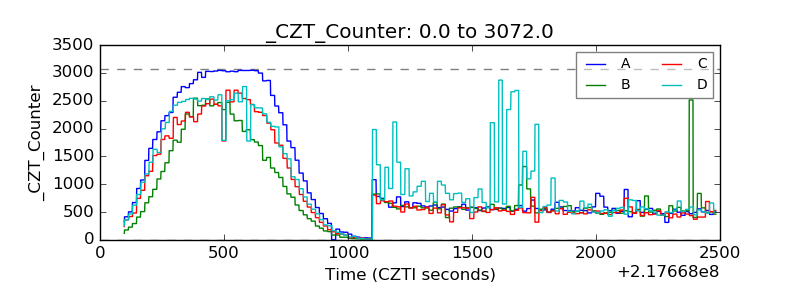 |
| +2.5 Volts monitor |  |
| +5 Volts monitor |  |
| _ROLL_ROT | 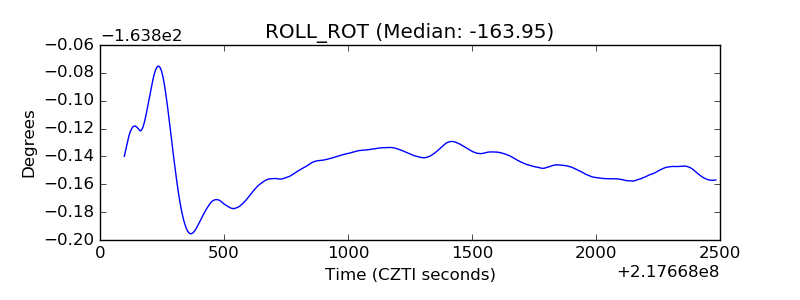 |
| _Roll_DEC | 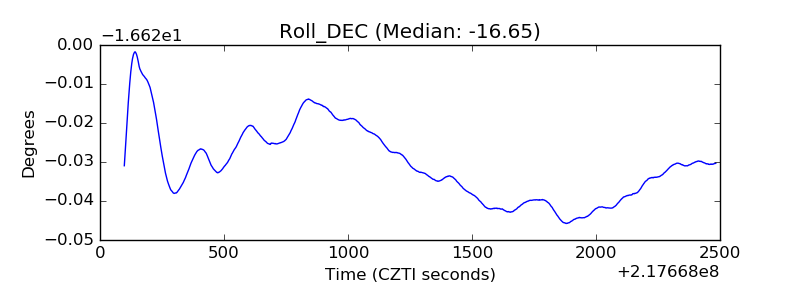 |
| _Roll_RA | 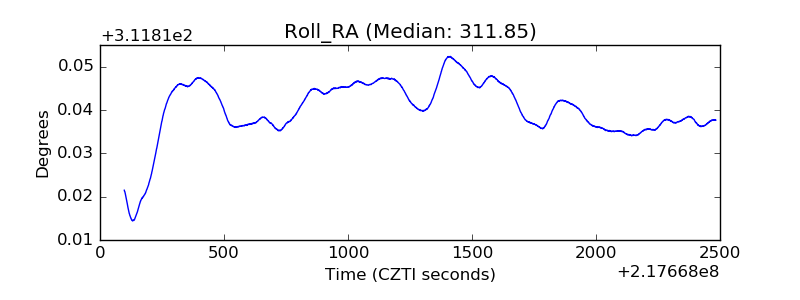 |
| Veto Counter | 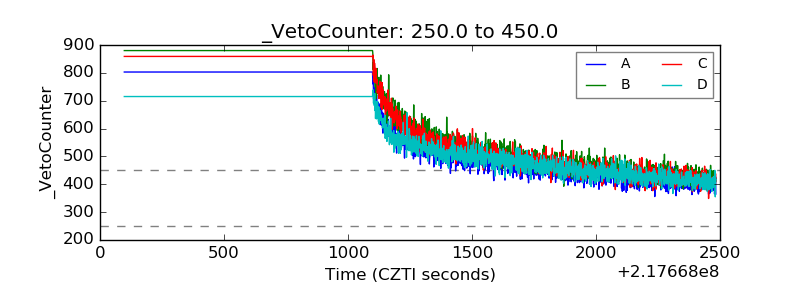 |