| Param | Original file | Final file |
|---|---|---|
| Filename | modeM0/AS1C02_018T01_9000000822_06265cztM0_level2.evt | modeM0/AS1C02_018T01_9000000822_06265cztM0_level2_quad_clean.evt |
| Size (bytes) | 462,251,520 | 92,972,160 |
| Size | 440.8 MB | 88.7 MB |
| Events in quadrant A | 3,028,653 | 604,342 |
| Events in quadrant B | 3,200,315 | 612,486 |
| Events in quadrant C | 2,669,322 | 618,641 |
| Events in quadrant D | 4,707,516 | 574,898 |
| Mode SS | |||
|---|---|---|---|
| Quadrant | BADHDUFLAG | Total packets | Discarded packets |
| A | 0 | 118 | 0 |
| B | 0 | 118 | 0 |
| C | 0 | 118 | 0 |
| D | 0 | 118 | 0 |
| Mode M0 | |||
|---|---|---|---|
| Quadrant | BADHDUFLAG | Total packets | Discarded packets |
| A | 0 | 12814 | 2 |
| B | 0 | 13256 | 1 |
| C | 0 | 11927 | 1 |
| D | 0 | 17794 | 1 |
| Mode M9 | |||
|---|---|---|---|
| Quadrant | BADHDUFLAG | Total packets | Discarded packets |
| A | 0 | 11 | 0 |
| B | 0 | 11 | 0 |
| C | 0 | 11 | 0 |
| D | 0 | 11 | 0 |
| Quadrant | Total seconds | Saturated seconds | Saturation percentage |
|---|---|---|---|
| A | 5796 | 87 | 1.501035% |
| B | 5796 | 121 | 2.087647% |
| C | 5796 | 44 | 0.759144% |
| D | 5796 | 354 | 6.107660% |
Noise dominated data is calculated using 1-second bins in cleaned event files. If a bin has >2000 counts, and if more than 50% of those come from <1% of pixels, then it is considered to be noise-dominated and hence unusable.
| Quadrant | # 1 sec bins | Bins with >0 counts | Bins with >2000 counts | High rate bins dominated by noise | Noise dominated (total time) | Noise dominated (detector-on time) | Marked lightcurve |
|---|---|---|---|---|---|---|---|
| A | 6951 | 5796 | 17 | 17 | 0.24% | 0.29% | 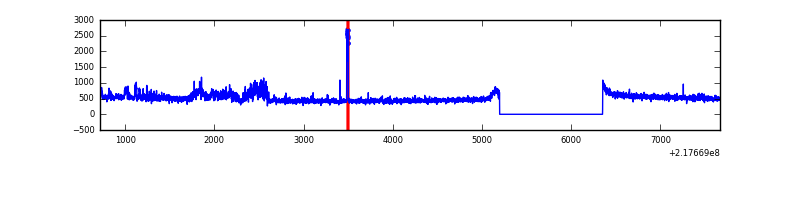 |
| B | 6951 | 5796 | 41 | 41 | 0.59% | 0.71% | 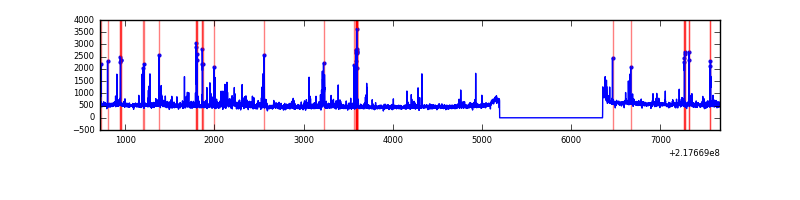 |
| C | 6951 | 5796 | 0 | 0 | 0.00% | 0.00% | 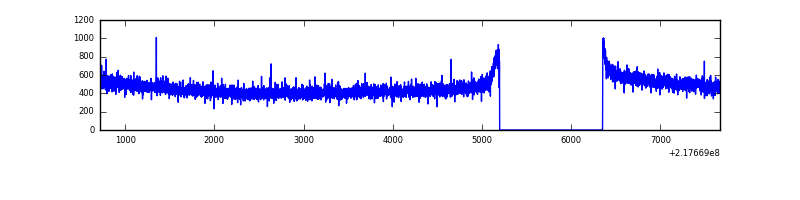 |
| D | 6951 | 5796 | 345 | 345 | 4.96% | 5.95% | 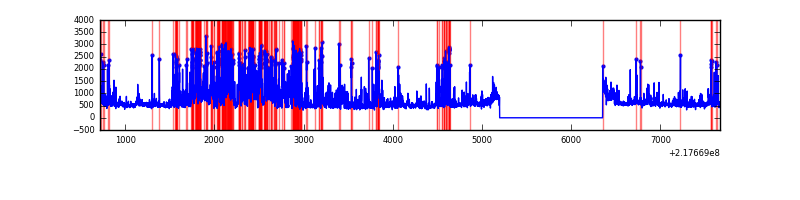 |
Top three noisy pixels from each quadrant. If the there are fewer than three noisy pixels in the level2.evt file, extra rows are filled as -1
| Pixel properties | Quadrant properties | ||||||
|---|---|---|---|---|---|---|---|
| Quadrant | DetID | PixID | Counts | Sigma | Mean | Median | Sigma |
| A | 3 | 80 | 213725 | 1463.36 | 710 | 696 | 145.6 |
| A | 15 | 239 | 44265 | 299.29 | 710 | 696 | 145.6 |
| A | 8 | 15 | 28487 | 190.9 | 710 | 696 | 145.6 |
| B | 3 | 64 | 237635 | 1746.28 | 705 | 688 | 135.7 |
| B | 11 | 51 | 110077 | 806.19 | 705 | 688 | 135.7 |
| B | 0 | 219 | 42521 | 308.31 | 705 | 688 | 135.7 |
| C | 13 | 61 | 5492 | 30.26 | 683 | 687 | 158.8 |
| C | 8 | 222 | 3072 | 15.02 | 683 | 687 | 158.8 |
| C | 9 | 54 | 2598 | 12.03 | 683 | 687 | 158.8 |
| D | 12 | 220 | 1659398 | 9914.65 | 678 | 658 | 167.3 |
| D | 2 | 63 | 133574 | 794.47 | 678 | 658 | 167.3 |
| D | 2 | 152 | 132237 | 786.48 | 678 | 658 | 167.3 |
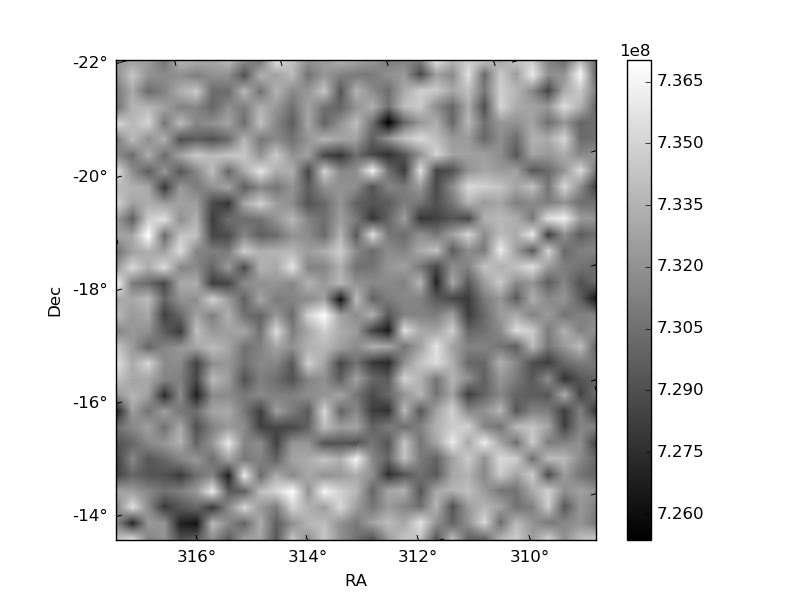
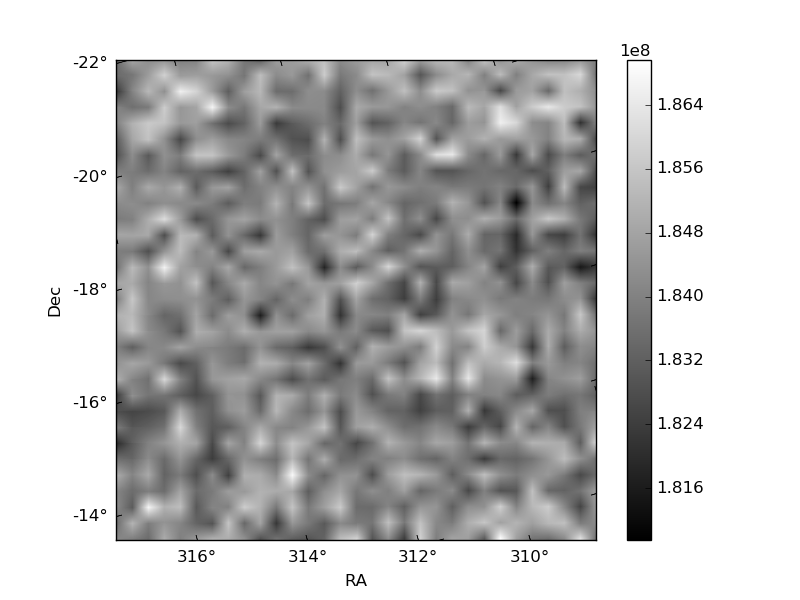
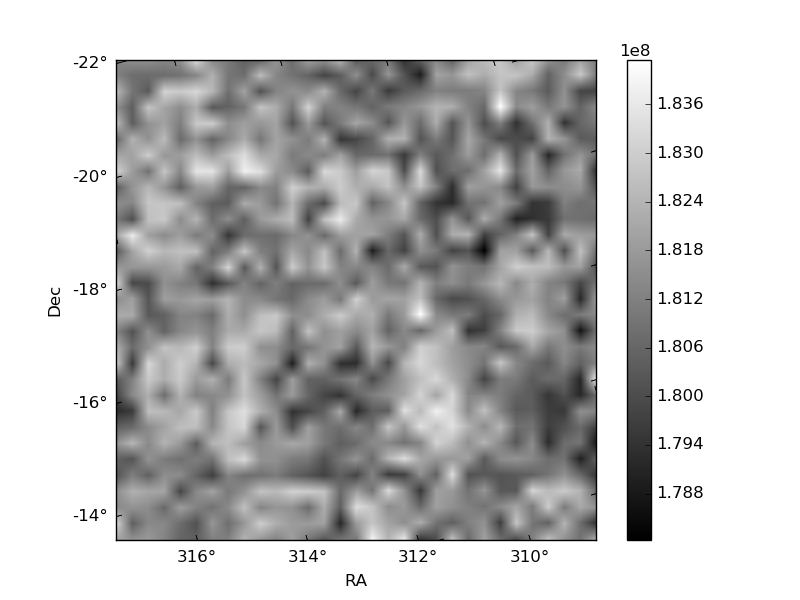
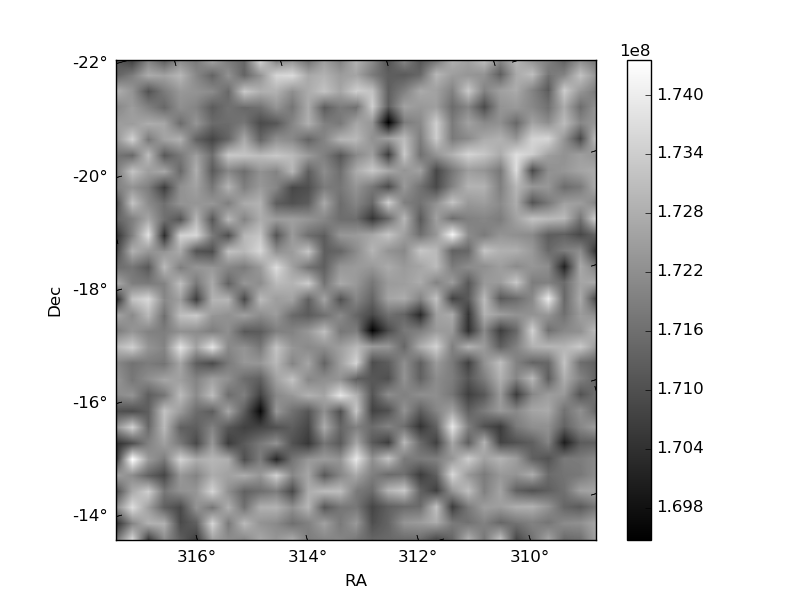
Histogram calculated using DETX and DETY for each event in the final _common_clean file
| Quadrant A | 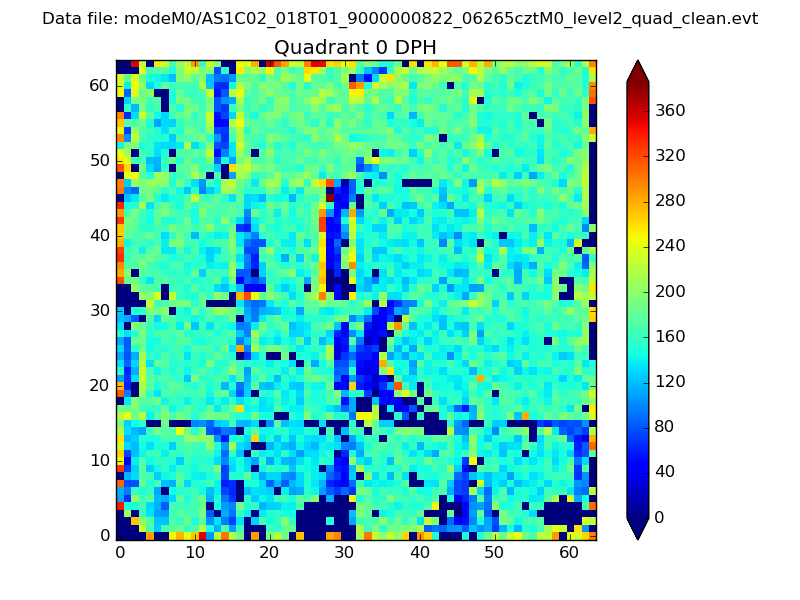 |
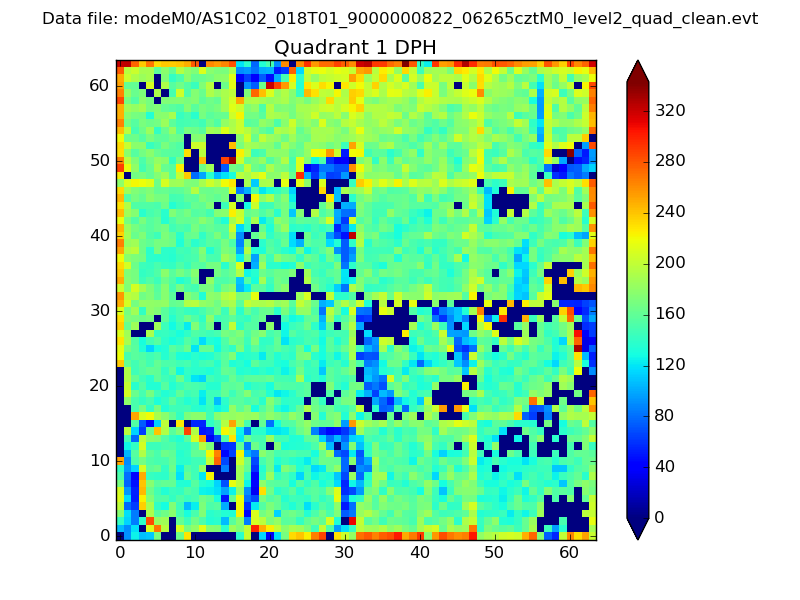 |
Quadrant B |
|---|---|---|---|
| Quadrant D | 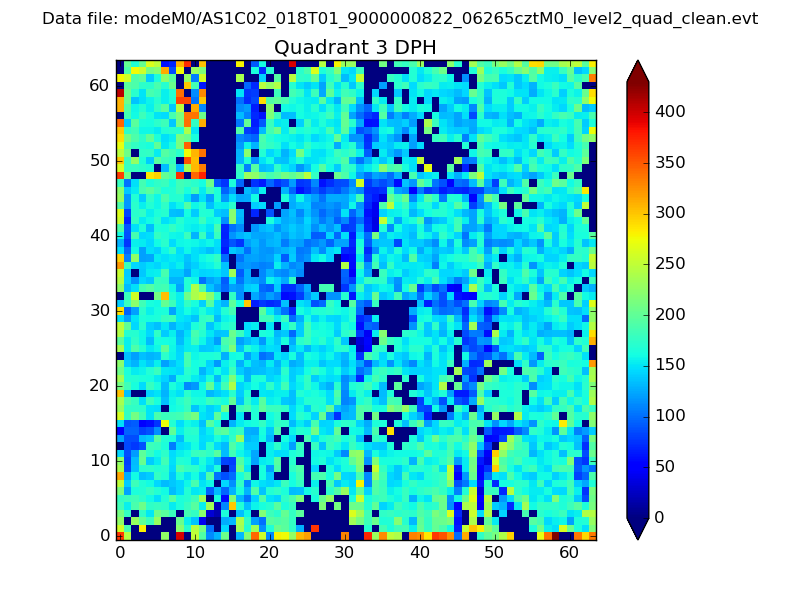 |
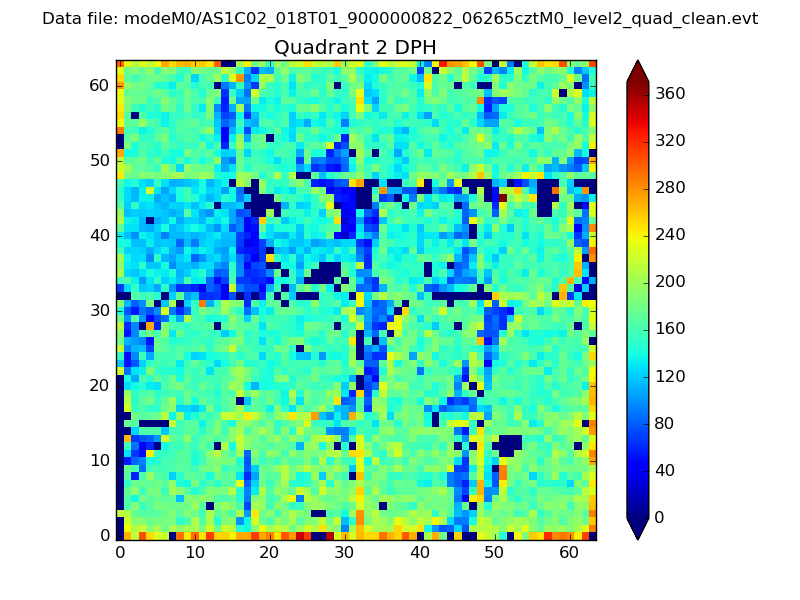 |
Quadrant C |
| Plot type | Count rate plots | Images |
|---|---|---|
| Comparison with Poisson distribution Blue bars denote a histogram of data divided into 1 sec bins. Red curve is a Poisson curve with rate = median count rate of data. |
 |
 |
| Quadrant-wise count rates Data is divided into 100 sec bins |
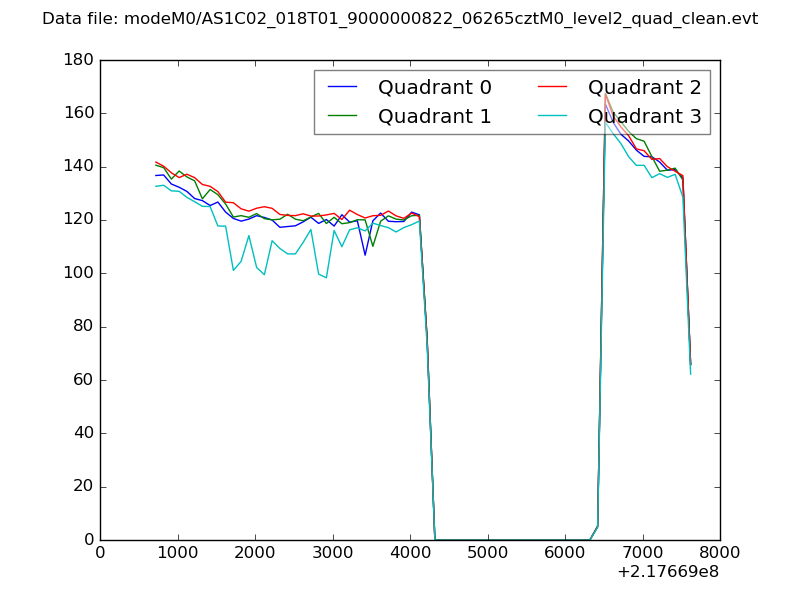 |
|
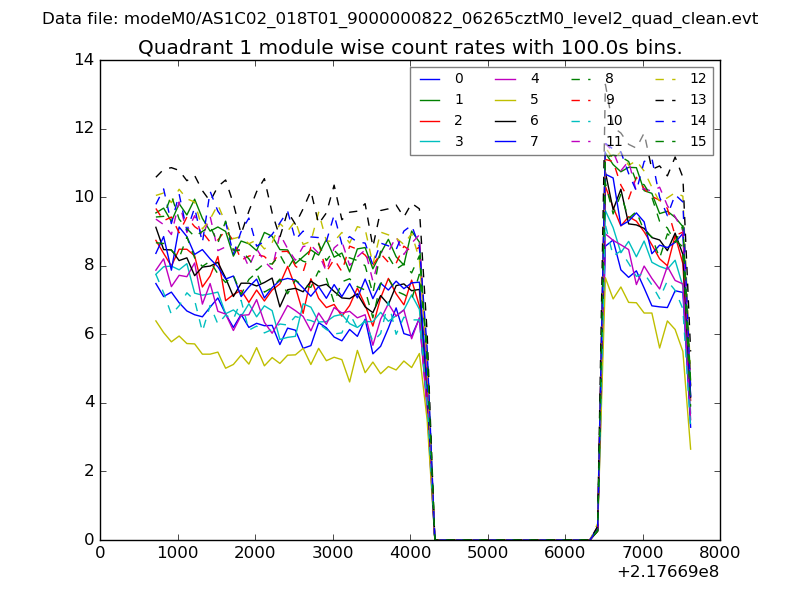
| Module-wise count rates for Quadrant A Data is divided into 100 sec bins |
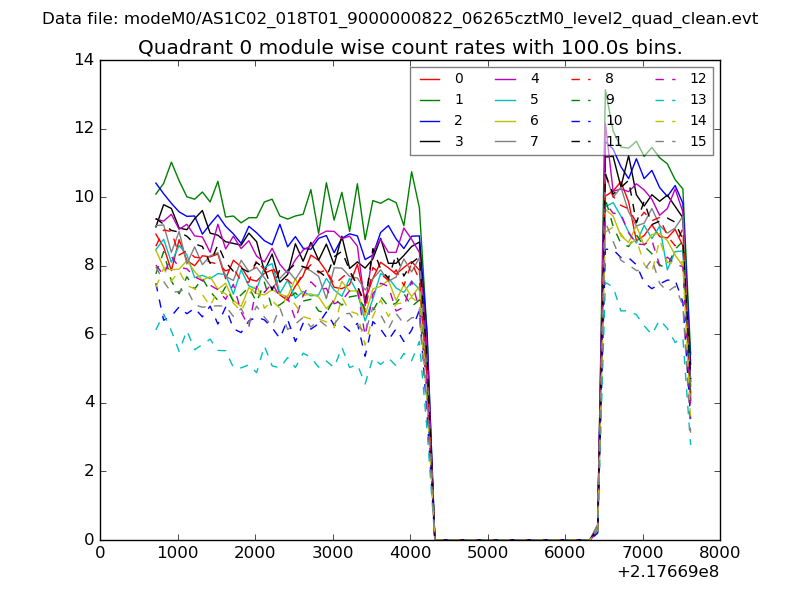 |
 |
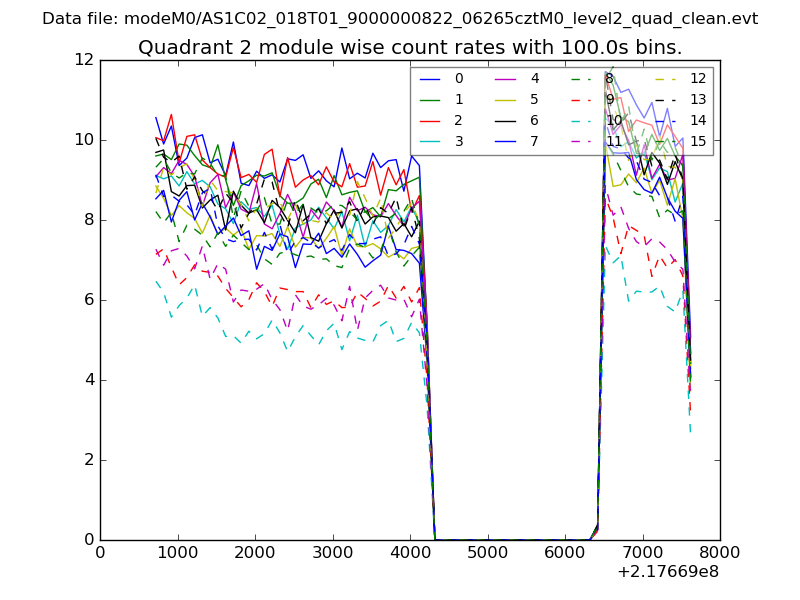
| Module-wise count rates for Quadrant B Data is divided into 100 sec bins |
 |
 |
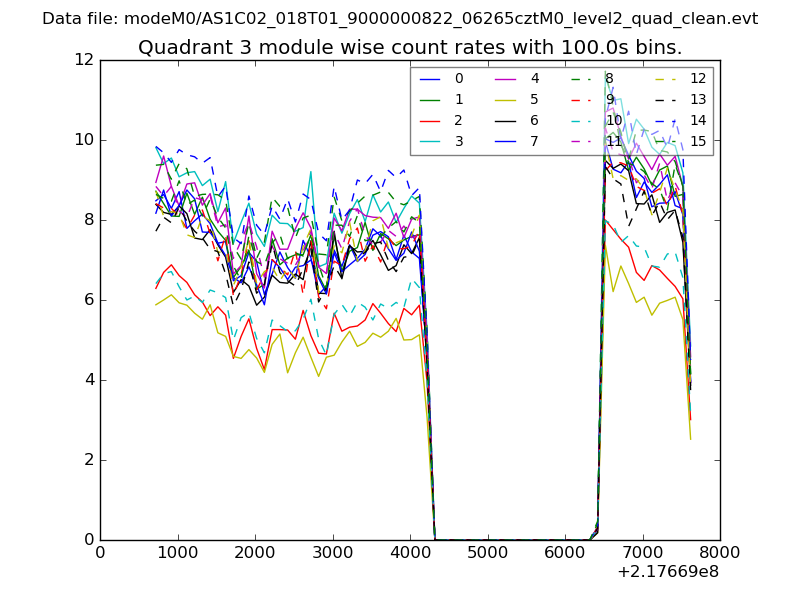
| Module-wise count rates for Quadrant C Data is divided into 100 sec bins |
 |
 |
| Module-wise count rates for Quadrant D Data is divided into 100 sec bins |
 |
 |
| Parameter | Plot |
|---|---|
| CZT HV Monitor |  |
| D_VDD | 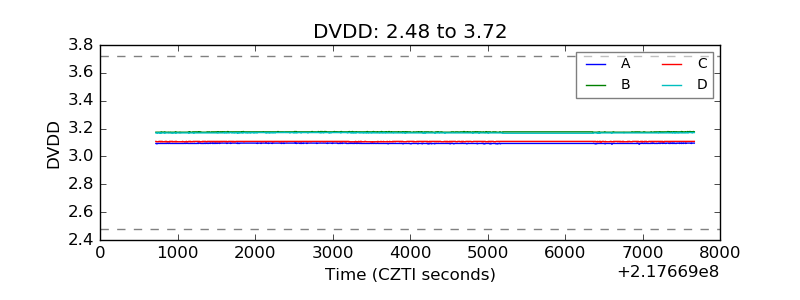 |
| Temperature 1 | 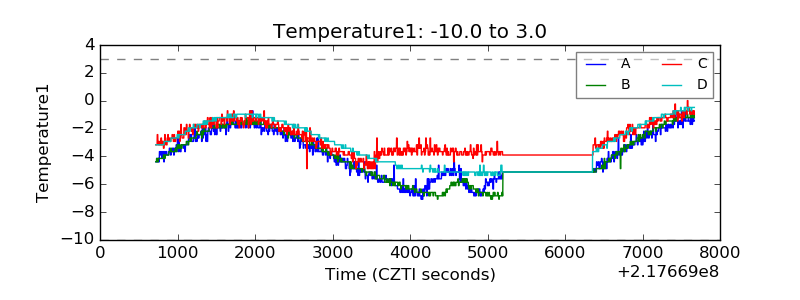 |
| Veto HV Monitor | 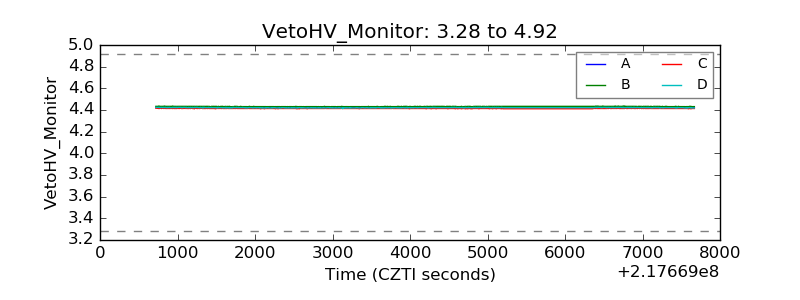 |
| Veto LLD | 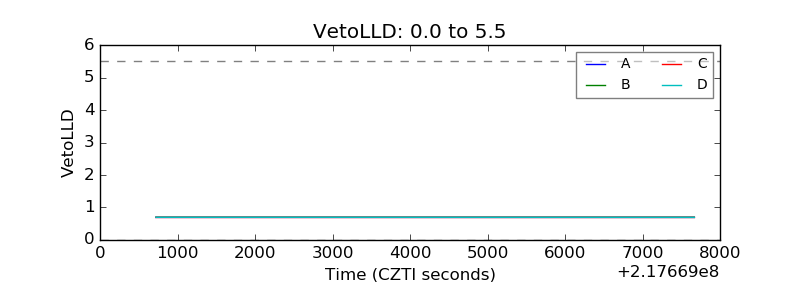 |
| Alpha Counter | 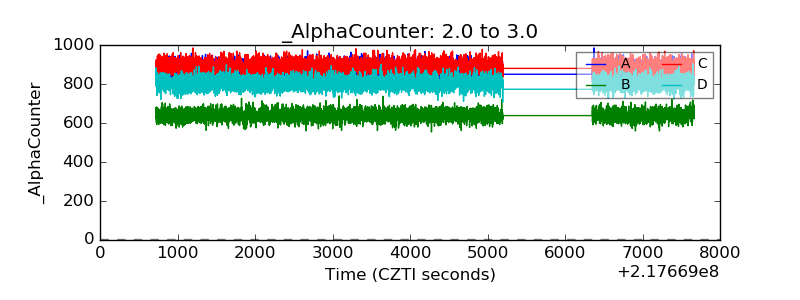 |
| _CPM_Rate | 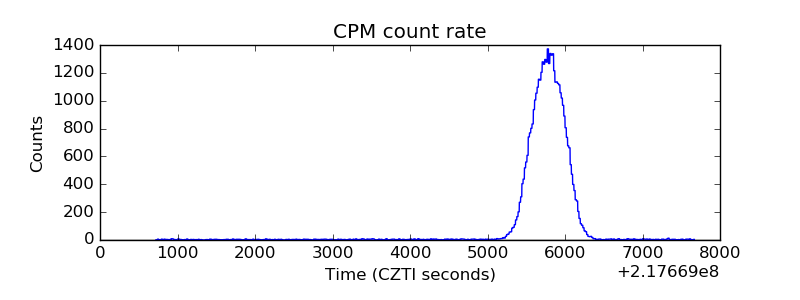 |
| CZT Counter | 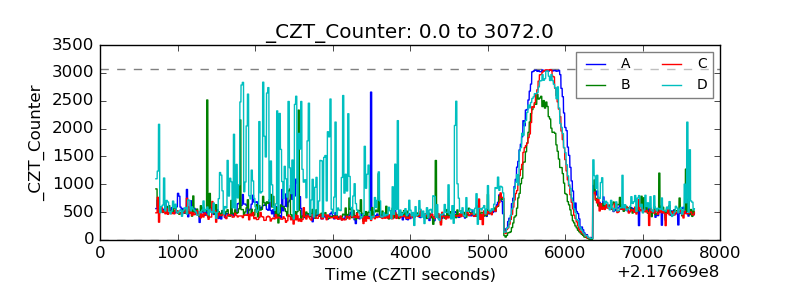 |
| +2.5 Volts monitor |  |
| +5 Volts monitor |  |
| _ROLL_ROT | 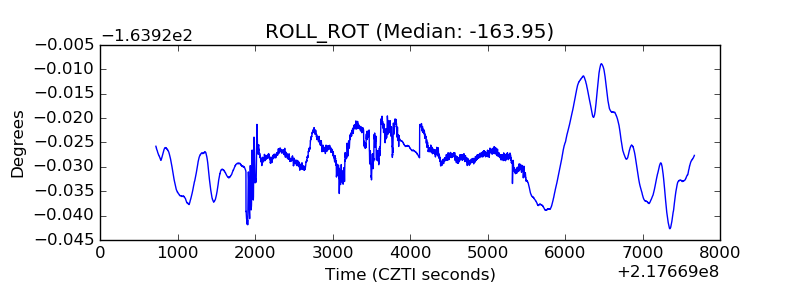 |
| _Roll_DEC | 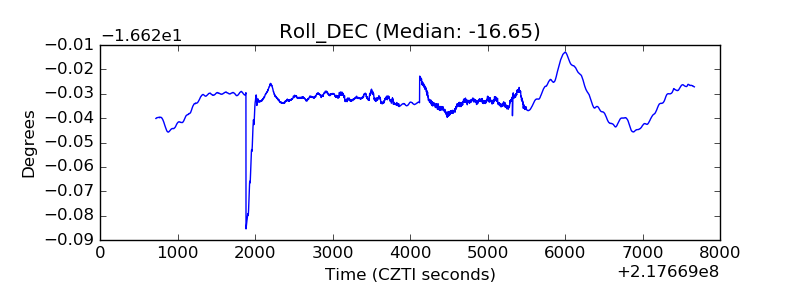 |
| _Roll_RA | 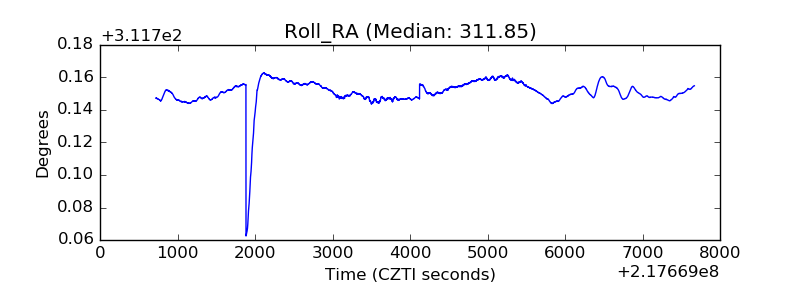 |
| Veto Counter | 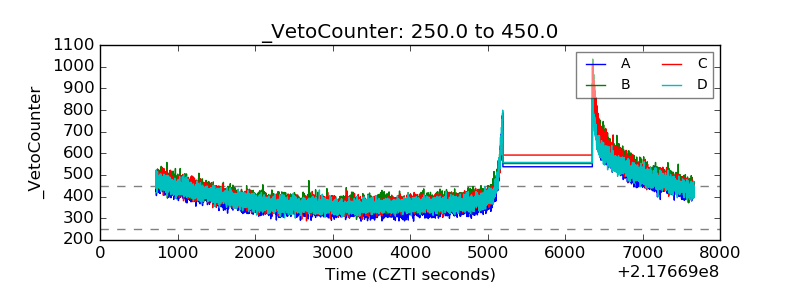 |