| Param | Original file | Final file |
|---|---|---|
| Filename | modeM0/AS1C02_018T01_9000000822_06270cztM0_level2.evt | modeM0/AS1C02_018T01_9000000822_06270cztM0_level2_quad_clean.evt |
| Size (bytes) | 611,337,600 | 89,035,200 |
| Size | 583.0 MB | 84.9 MB |
| Events in quadrant A | 4,189,848 | 558,212 |
| Events in quadrant B | 4,214,202 | 562,259 |
| Events in quadrant C | 3,005,409 | 578,061 |
| Events in quadrant D | 6,641,030 | 519,619 |
| Mode SS | |||
|---|---|---|---|
| Quadrant | BADHDUFLAG | Total packets | Discarded packets |
| A | 0 | 140 | 0 |
| B | 0 | 140 | 0 |
| C | 0 | 140 | 0 |
| D | 0 | 140 | 0 |
| Mode M0 | |||
|---|---|---|---|
| Quadrant | BADHDUFLAG | Total packets | Discarded packets |
| A | 0 | 16849 | 2 |
| B | 0 | 17114 | 1 |
| C | 0 | 13970 | 1 |
| D | 0 | 24504 | 1 |
| Mode M9 | |||
|---|---|---|---|
| Quadrant | BADHDUFLAG | Total packets | Discarded packets |
| A | 0 | 6 | 0 |
| B | 0 | 6 | 0 |
| C | 0 | 6 | 0 |
| D | 0 | 6 | 0 |
| Quadrant | Total seconds | Saturated seconds | Saturation percentage |
|---|---|---|---|
| A | 6855 | 47 | 0.685631% |
| B | 6855 | 186 | 2.713348% |
| C | 6855 | 9 | 0.131291% |
| D | 6855 | 649 | 9.467542% |
Noise dominated data is calculated using 1-second bins in cleaned event files. If a bin has >2000 counts, and if more than 50% of those come from <1% of pixels, then it is considered to be noise-dominated and hence unusable.
| Quadrant | # 1 sec bins | Bins with >0 counts | Bins with >2000 counts | High rate bins dominated by noise | Noise dominated (total time) | Noise dominated (detector-on time) | Marked lightcurve |
|---|---|---|---|---|---|---|---|
| A | 7520 | 6856 | 12 | 12 | 0.16% | 0.18% | 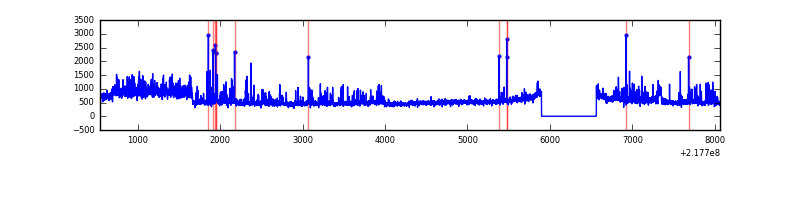 |
| B | 7520 | 6856 | 89 | 89 | 1.18% | 1.30% |  |
| C | 7520 | 6856 | 0 | 0 | 0.00% | 0.00% |  |
| D | 7520 | 6856 | 597 | 597 | 7.94% | 8.71% | 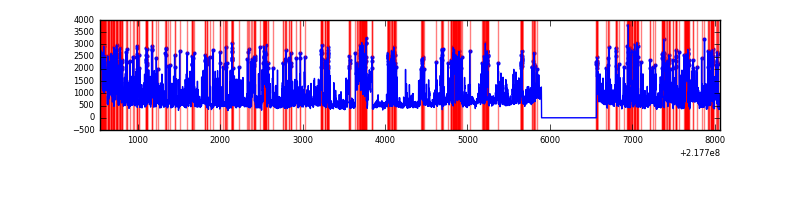 |
Top three noisy pixels from each quadrant. If the there are fewer than three noisy pixels in the level2.evt file, extra rows are filled as -1
| Pixel properties | Quadrant properties | ||||||
|---|---|---|---|---|---|---|---|
| Quadrant | DetID | PixID | Counts | Sigma | Mean | Median | Sigma |
| A | 8 | 15 | 1018072 | 6215.64 | 789 | 771 | 163.7 |
| A | 13 | 251 | 123580 | 750.35 | 789 | 771 | 163.7 |
| A | 0 | 226 | 7778 | 42.81 | 789 | 771 | 163.7 |
| B | 4 | 81 | 301724 | 1953.74 | 794 | 777 | 154.0 |
| B | 0 | 219 | 277966 | 1799.51 | 794 | 777 | 154.0 |
| B | 3 | 64 | 204007 | 1319.37 | 794 | 777 | 154.0 |
| C | 1 | 16 | 13631 | 72.1 | 766 | 771 | 178.4 |
| C | 13 | 61 | 6059 | 29.65 | 766 | 771 | 178.4 |
| C | 9 | 54 | 3185 | 13.53 | 766 | 771 | 178.4 |
| D | 12 | 220 | 3035337 | 16274.04 | 741 | 717 | 186.5 |
| D | 2 | 152 | 211630 | 1131.08 | 741 | 717 | 186.5 |
| D | 12 | 221 | 177939 | 950.4 | 741 | 717 | 186.5 |
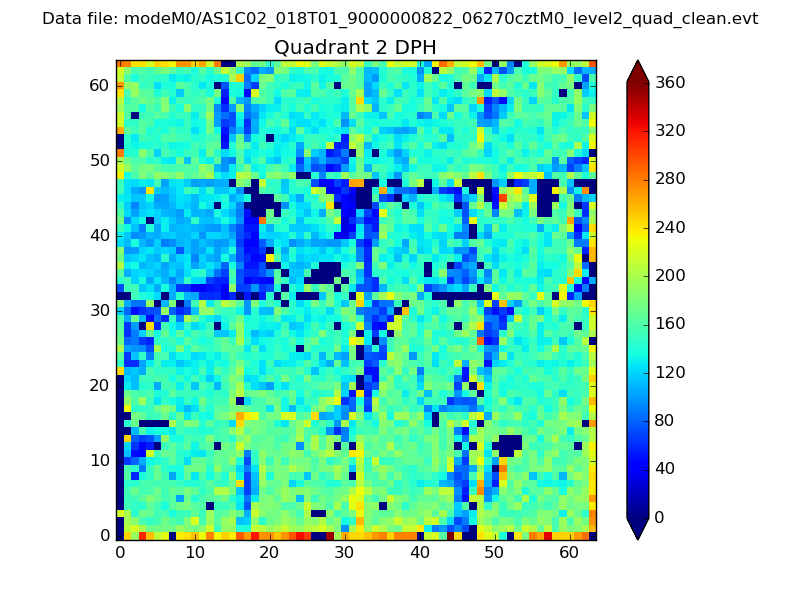
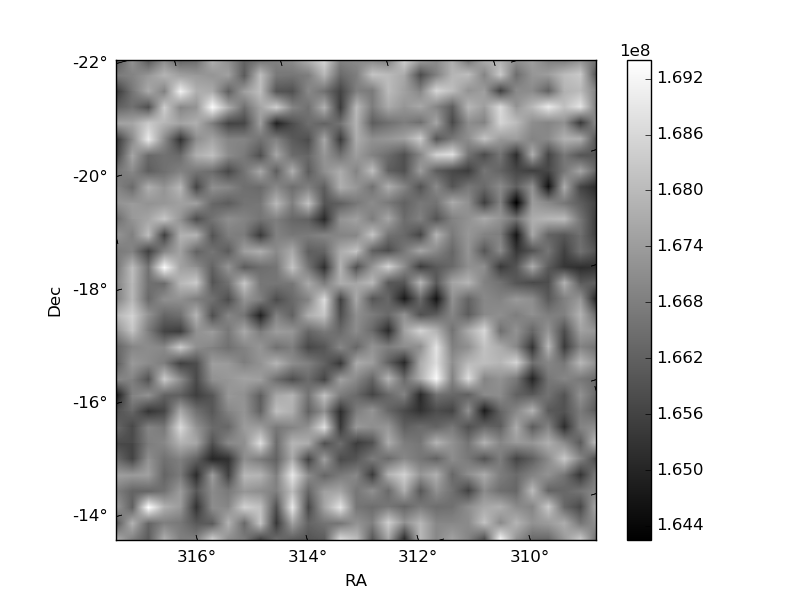
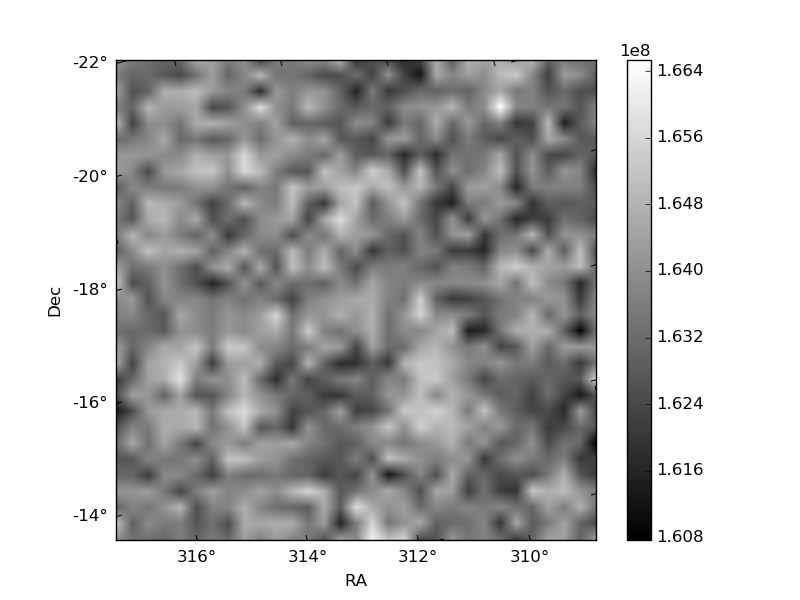
Histogram calculated using DETX and DETY for each event in the final _common_clean file
| Quadrant A | 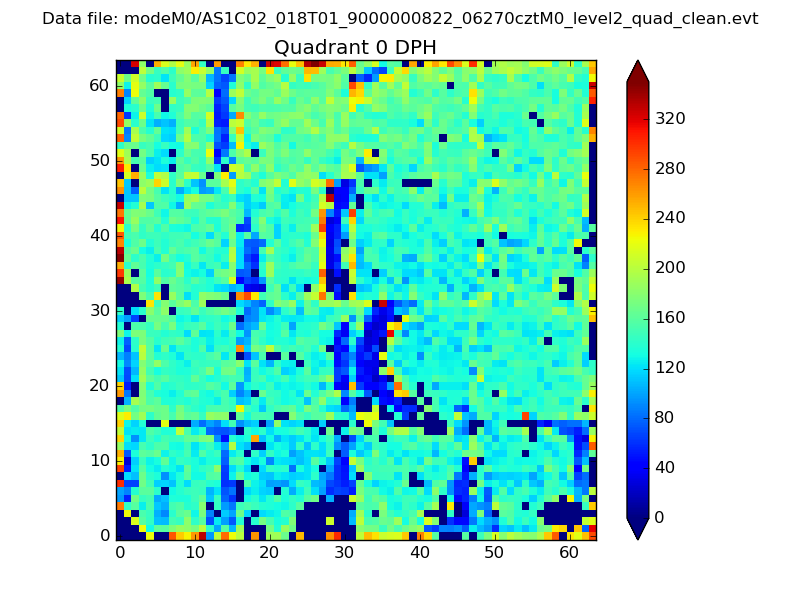 |
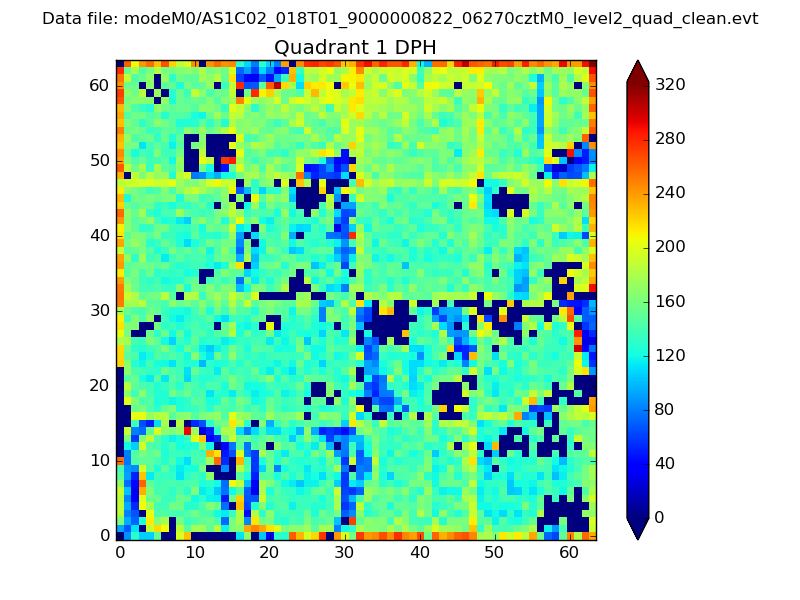 |
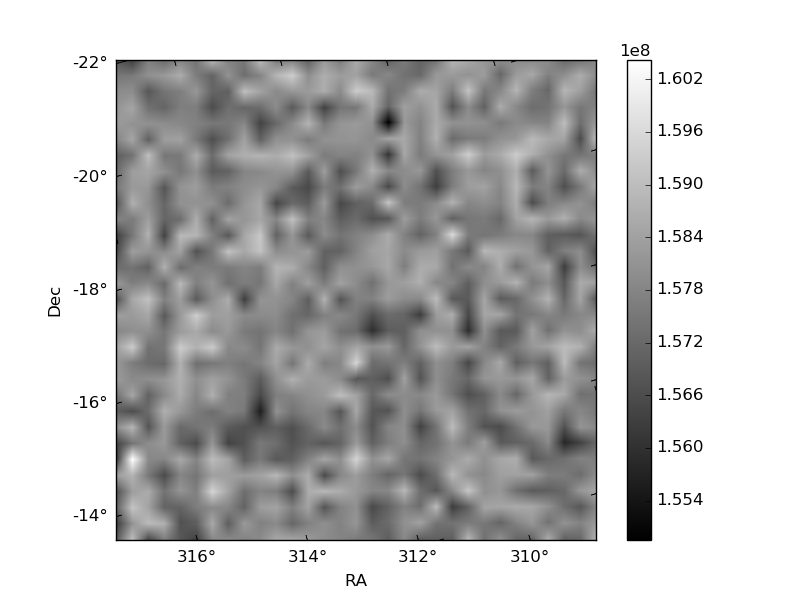
Quadrant B |
|---|---|---|---|
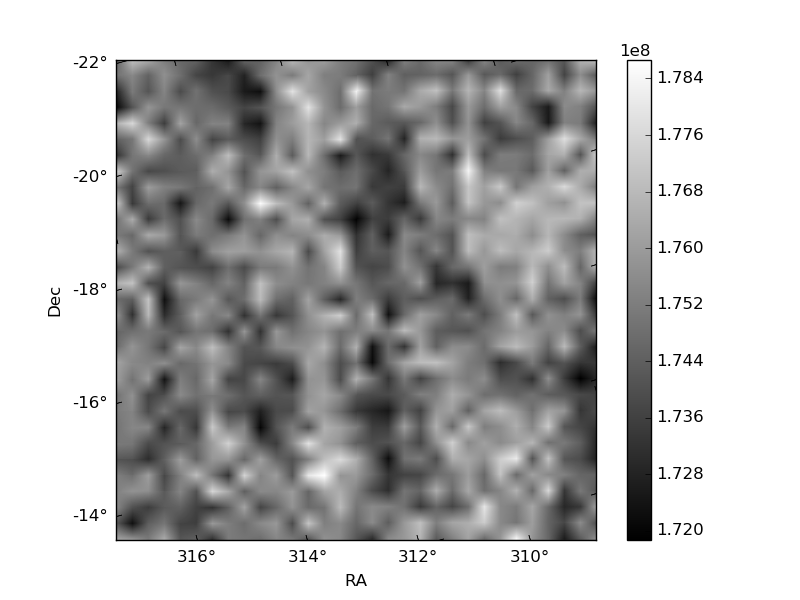
| Quadrant D | 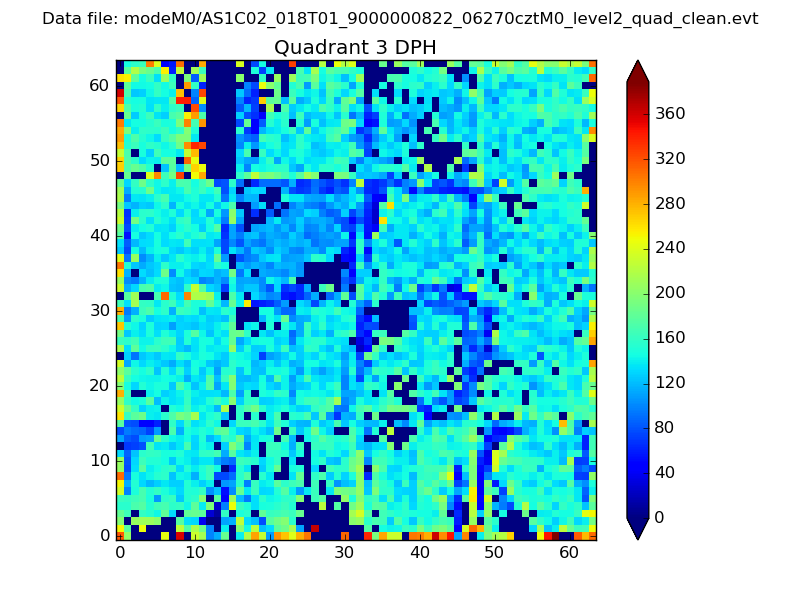 |
 |
Quadrant C |
| Plot type | Count rate plots | Images |
|---|---|---|
| Comparison with Poisson distribution Blue bars denote a histogram of data divided into 1 sec bins. Red curve is a Poisson curve with rate = median count rate of data. |
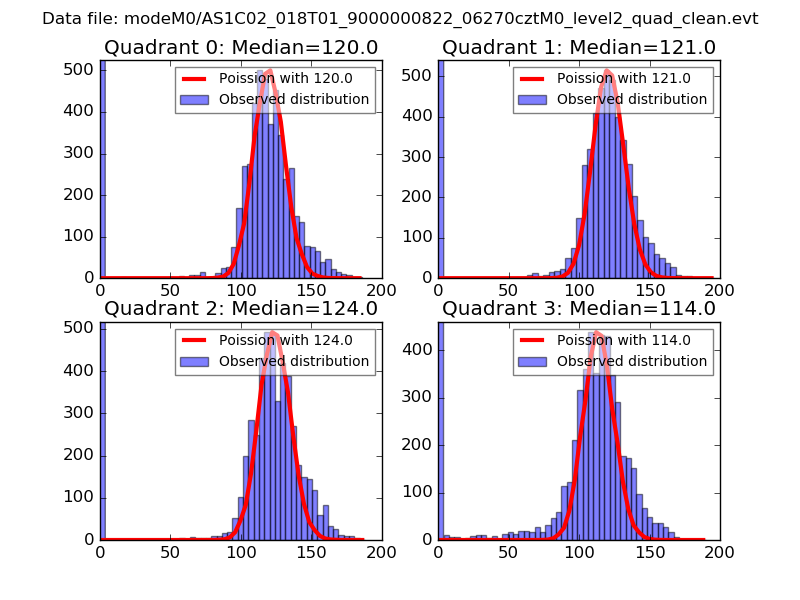 |
 |
| Quadrant-wise count rates Data is divided into 100 sec bins |
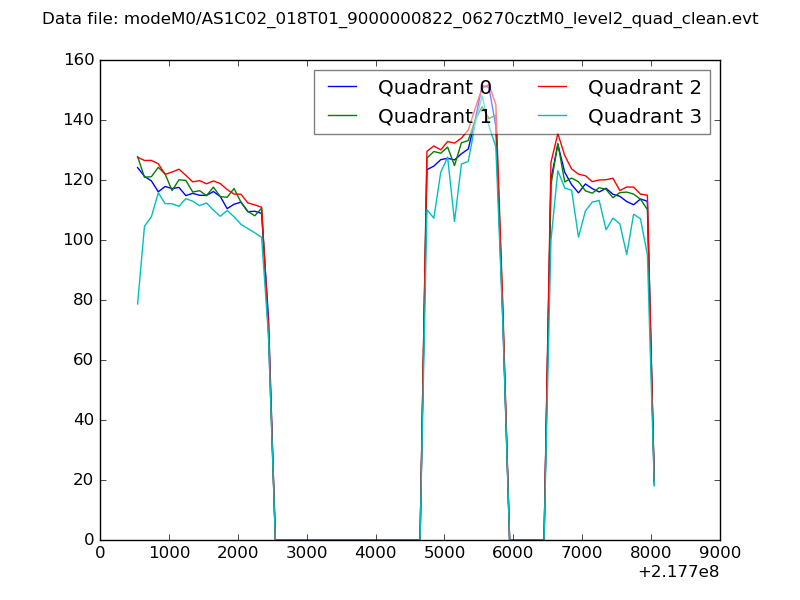 |
|
| Module-wise count rates for Quadrant A Data is divided into 100 sec bins |
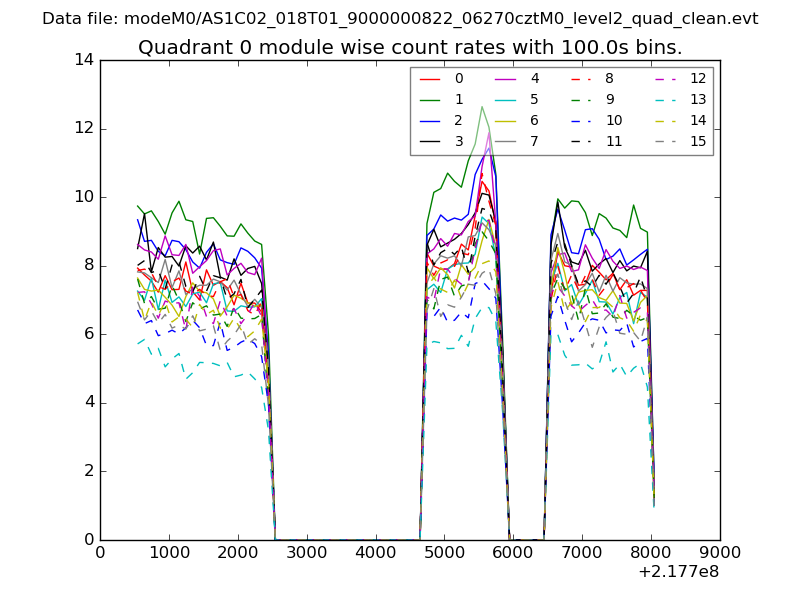 |
 |
| Module-wise count rates for Quadrant B Data is divided into 100 sec bins |
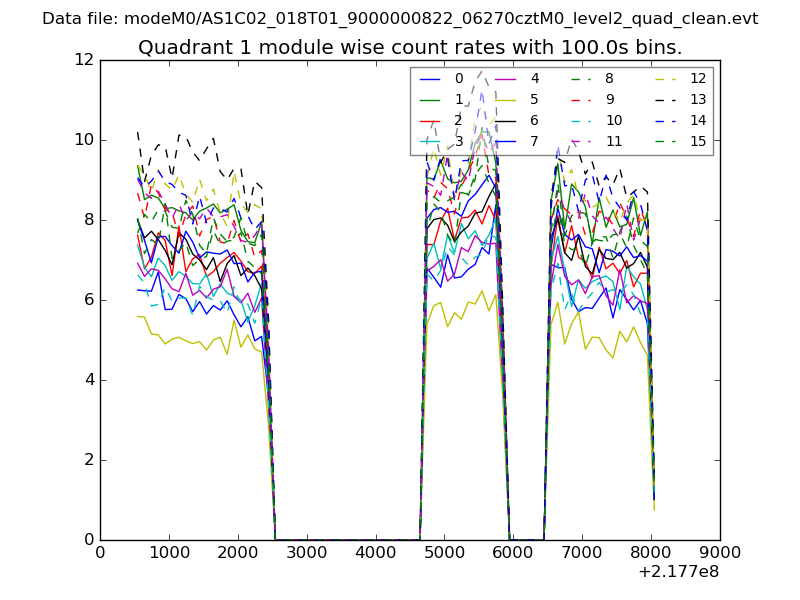 |
 |
| Module-wise count rates for Quadrant C Data is divided into 100 sec bins |
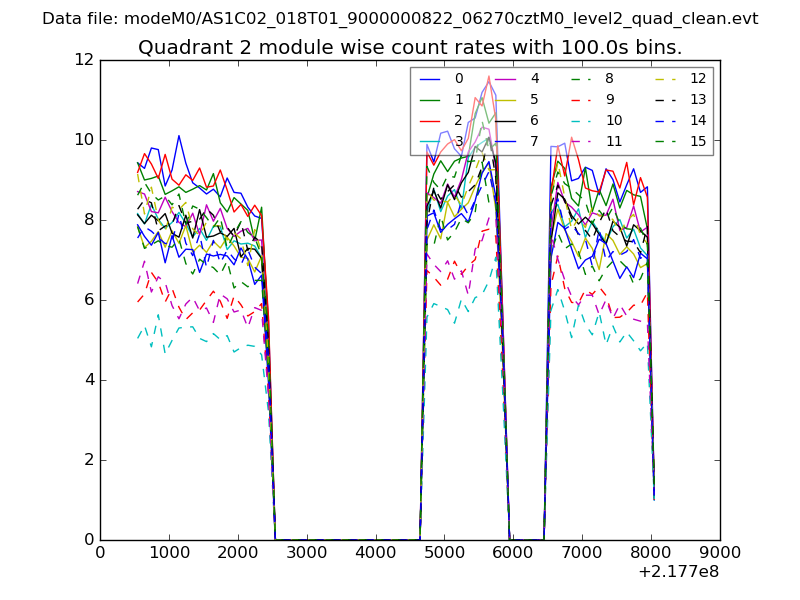 |
 |
| Module-wise count rates for Quadrant D Data is divided into 100 sec bins |
 |
 |
| Parameter | Plot |
|---|---|
| CZT HV Monitor | 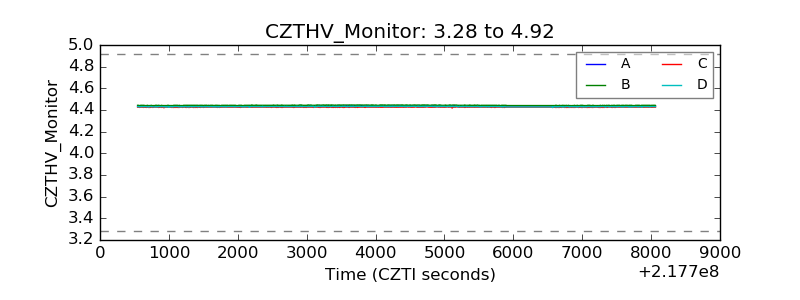 |
| D_VDD | 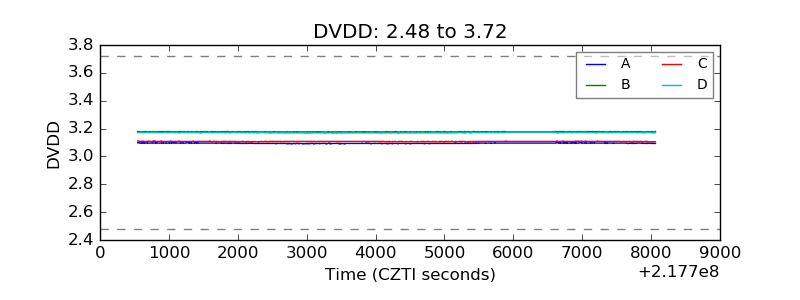 |
| Temperature 1 | 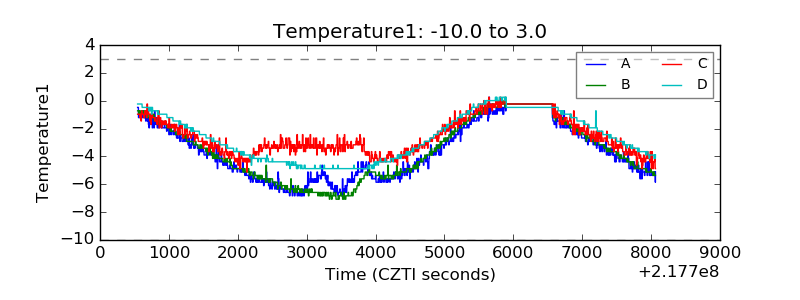 |
| Veto HV Monitor | 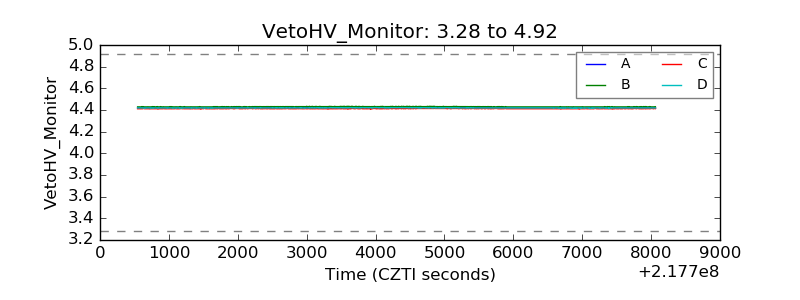 |
| Veto LLD |  |
| Alpha Counter | 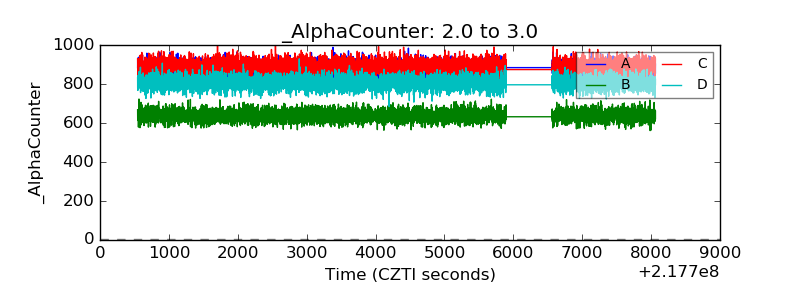 |
| _CPM_Rate | 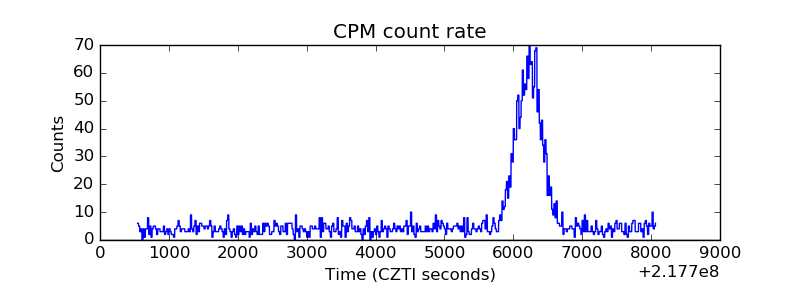 |
| CZT Counter | 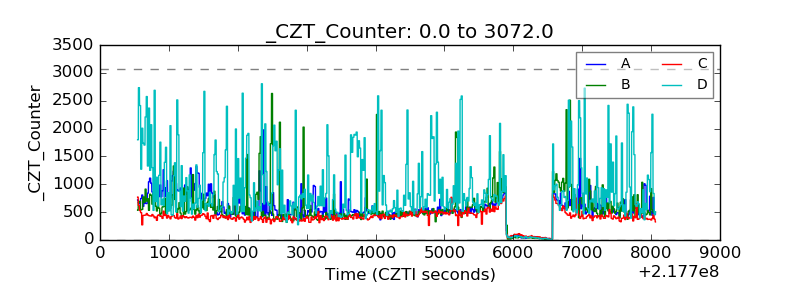 |
| +2.5 Volts monitor |  |
| +5 Volts monitor |  |
| _ROLL_ROT | 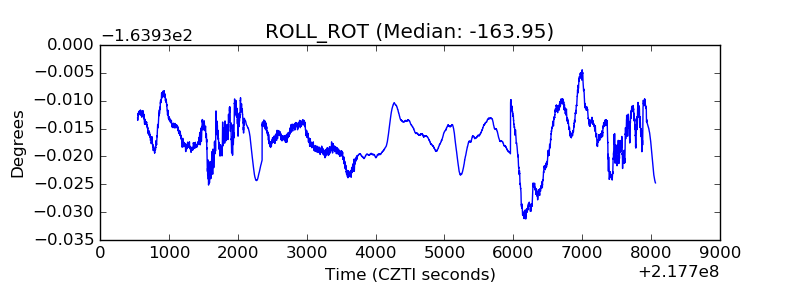 |
| _Roll_DEC | 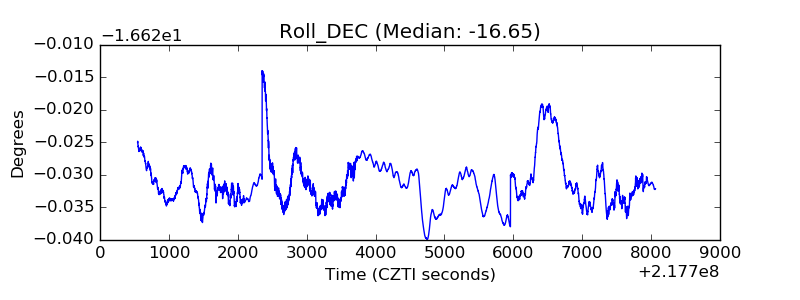 |
| _Roll_RA | 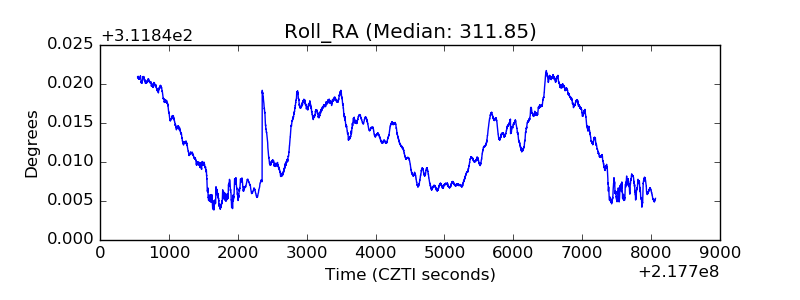 |
| Veto Counter | 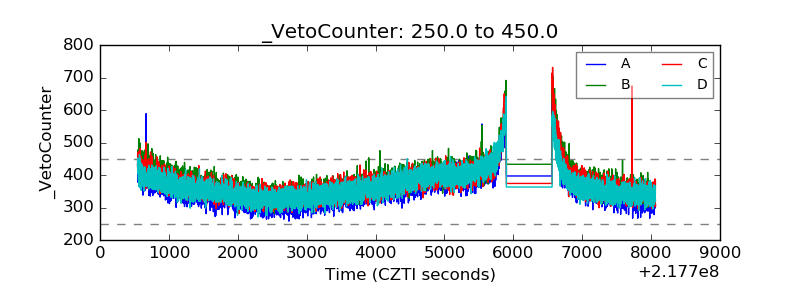 |