| Param | Original file | Final file |
|---|---|---|
| Filename | modeM0/AS1C02_018T01_9000000822_06271cztM0_level2.evt | modeM0/AS1C02_018T01_9000000822_06271cztM0_level2_quad_clean.evt |
| Size (bytes) | 614,712,960 | 95,541,120 |
| Size | 586.2 MB | 91.1 MB |
| Events in quadrant A | 4,080,725 | 599,772 |
| Events in quadrant B | 4,297,421 | 601,837 |
| Events in quadrant C | 3,181,869 | 621,246 |
| Events in quadrant D | 6,565,987 | 565,658 |
| Mode SS | |||
|---|---|---|---|
| Quadrant | BADHDUFLAG | Total packets | Discarded packets |
| A | 0 | 148 | 0 |
| B | 0 | 148 | 0 |
| C | 0 | 148 | 0 |
| D | 0 | 148 | 0 |
| Mode M0 | |||
|---|---|---|---|
| Quadrant | BADHDUFLAG | Total packets | Discarded packets |
| A | 0 | 16693 | 2 |
| B | 0 | 17688 | 1 |
| C | 0 | 14748 | 1 |
| D | 0 | 24504 | 1 |
| Mode M9 | |||
|---|---|---|---|
| Quadrant | BADHDUFLAG | Total packets | Discarded packets |
| A | 0 | 4 | 0 |
| B | 0 | 4 | 0 |
| C | 0 | 4 | 0 |
| D | 0 | 4 | 0 |
| Quadrant | Total seconds | Saturated seconds | Saturation percentage |
|---|---|---|---|
| A | 7249 | 52 | 0.717340% |
| B | 7249 | 194 | 2.676231% |
| C | 7249 | 15 | 0.206925% |
| D | 7249 | 557 | 7.683818% |
Noise dominated data is calculated using 1-second bins in cleaned event files. If a bin has >2000 counts, and if more than 50% of those come from <1% of pixels, then it is considered to be noise-dominated and hence unusable.
| Quadrant | # 1 sec bins | Bins with >0 counts | Bins with >2000 counts | High rate bins dominated by noise | Noise dominated (total time) | Noise dominated (detector-on time) | Marked lightcurve |
|---|---|---|---|---|---|---|---|
| A | 7569 | 7250 | 6 | 6 | 0.08% | 0.08% | 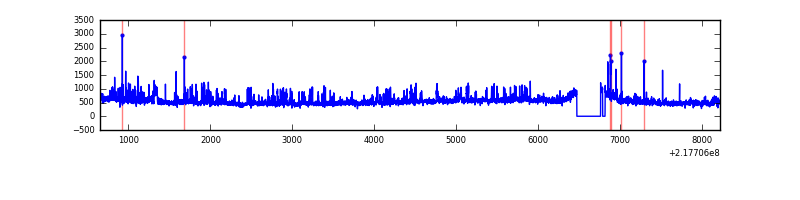 |
| B | 7569 | 7251 | 99 | 99 | 1.31% | 1.37% | 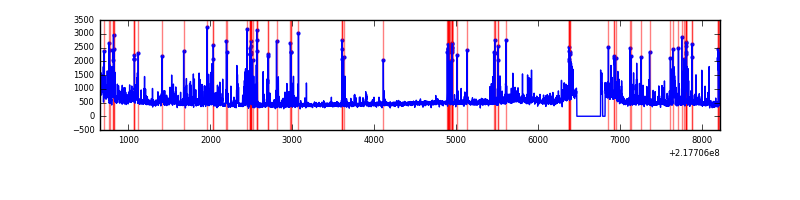 |
| C | 7569 | 7251 | 0 | 0 | 0.00% | 0.00% |  |
| D | 7569 | 7250 | 541 | 541 | 7.15% | 7.46% | 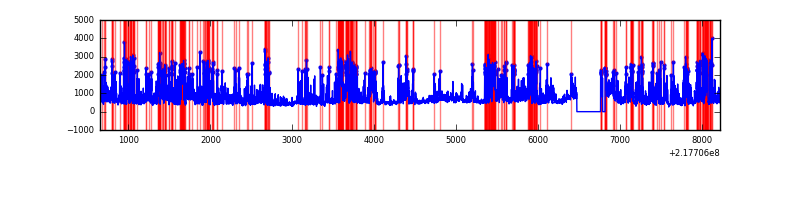 |
Top three noisy pixels from each quadrant. If the there are fewer than three noisy pixels in the level2.evt file, extra rows are filled as -1
| Pixel properties | Quadrant properties | ||||||
|---|---|---|---|---|---|---|---|
| Quadrant | DetID | PixID | Counts | Sigma | Mean | Median | Sigma |
| A | 8 | 15 | 780117 | 4532.85 | 831 | 811 | 171.9 |
| A | 13 | 251 | 92790 | 535.0 | 831 | 811 | 171.9 |
| A | 0 | 226 | 8212 | 43.05 | 831 | 811 | 171.9 |
| B | 3 | 64 | 420029 | 2598.32 | 834 | 814 | 161.3 |
| B | 0 | 219 | 234740 | 1449.89 | 834 | 814 | 161.3 |
| B | 4 | 81 | 126976 | 781.96 | 834 | 814 | 161.3 |
| C | 9 | 54 | 7962 | 37.65 | 811 | 817 | 189.8 |
| C | 13 | 61 | 6515 | 30.03 | 811 | 817 | 189.8 |
| C | 1 | 16 | 6008 | 27.36 | 811 | 817 | 189.8 |
| D | 12 | 220 | 2830049 | 14404.72 | 789 | 763 | 196.4 |
| D | 2 | 63 | 206164 | 1045.76 | 789 | 763 | 196.4 |
| D | 2 | 152 | 181915 | 922.3 | 789 | 763 | 196.4 |
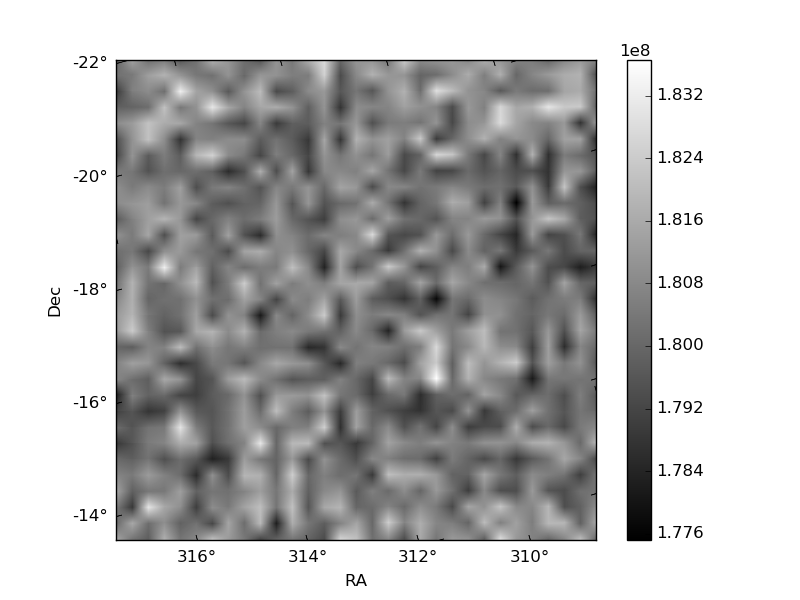
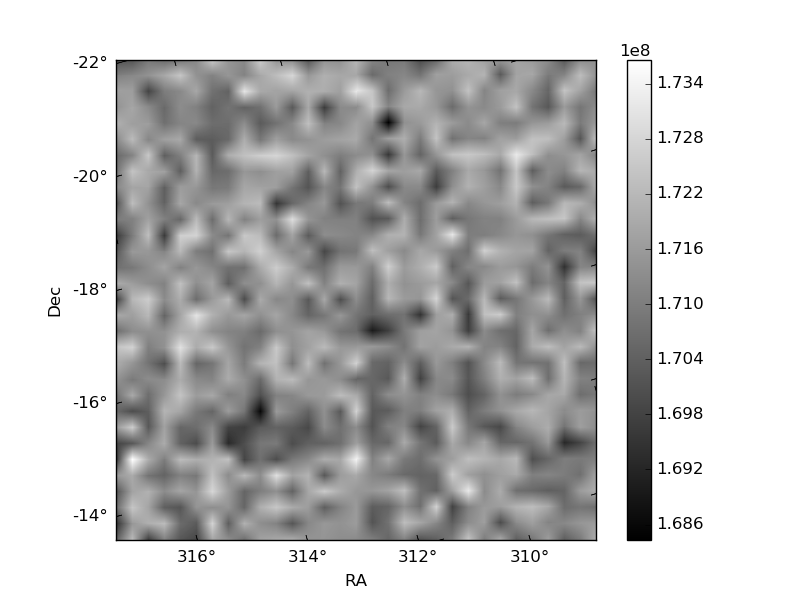
Histogram calculated using DETX and DETY for each event in the final _common_clean file
| Quadrant A |  |
 |
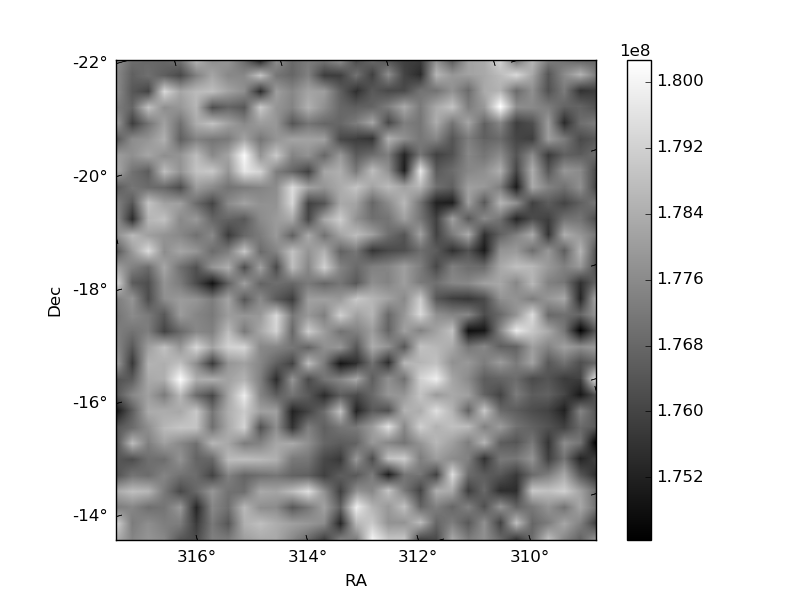
Quadrant B |
|---|---|---|---|
| Quadrant D | 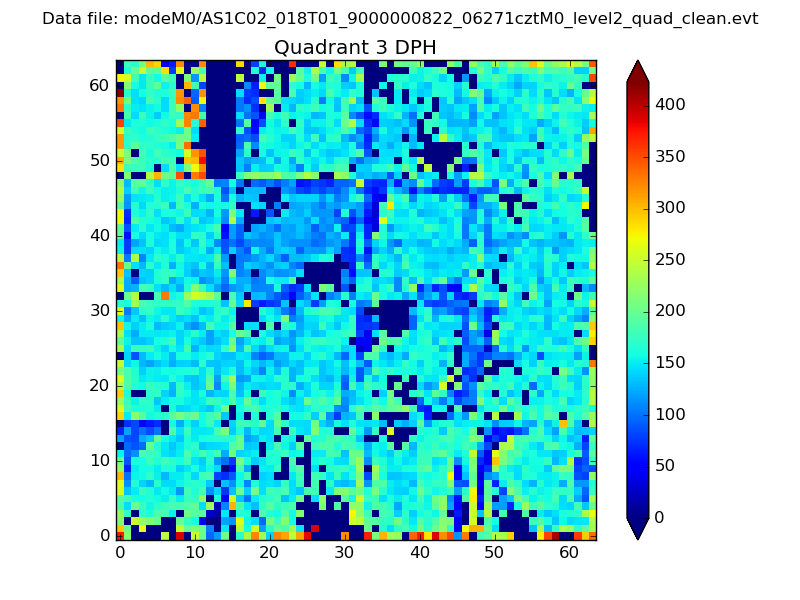 |
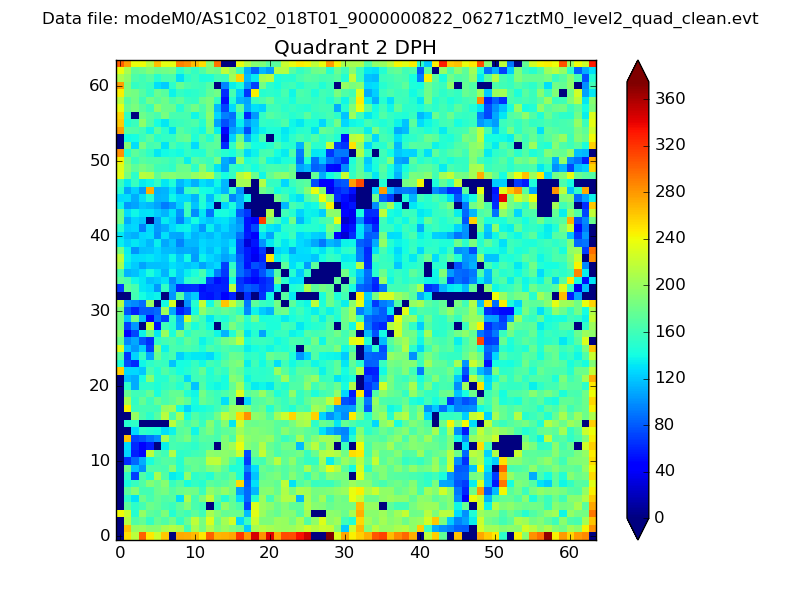 |
Quadrant C |
| Plot type | Count rate plots | Images |
|---|---|---|
| Comparison with Poisson distribution Blue bars denote a histogram of data divided into 1 sec bins. Red curve is a Poisson curve with rate = median count rate of data. |
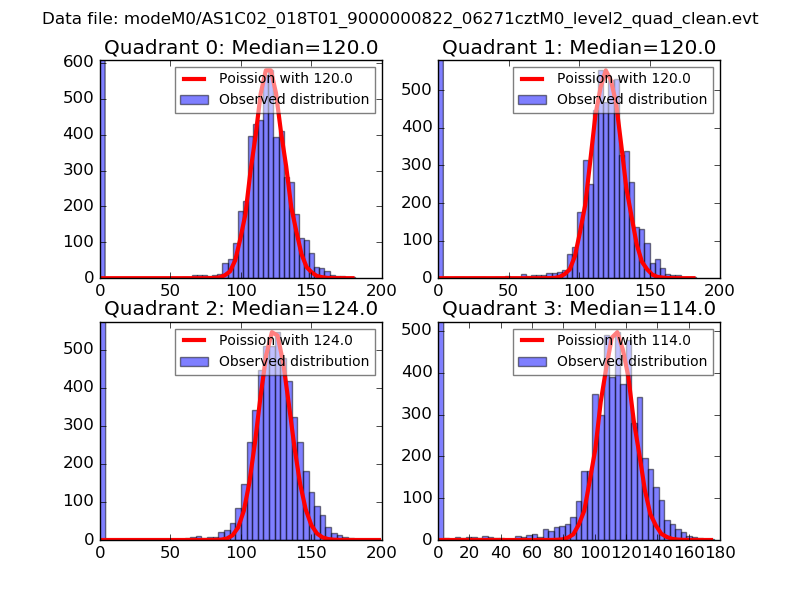 |
 |
| Quadrant-wise count rates Data is divided into 100 sec bins |
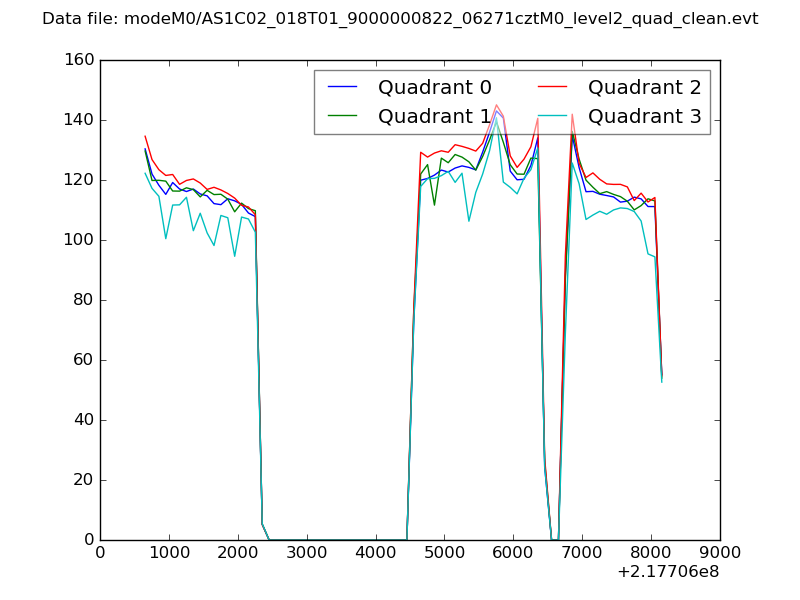 |
|
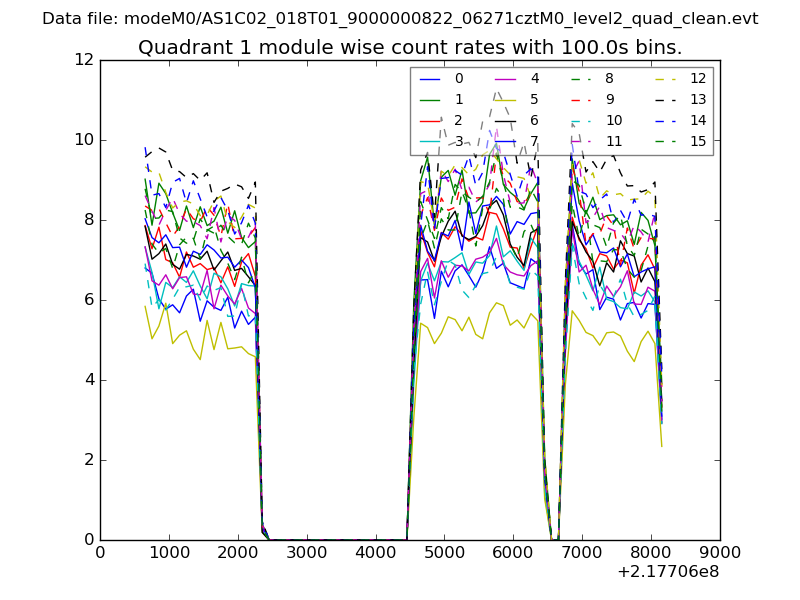
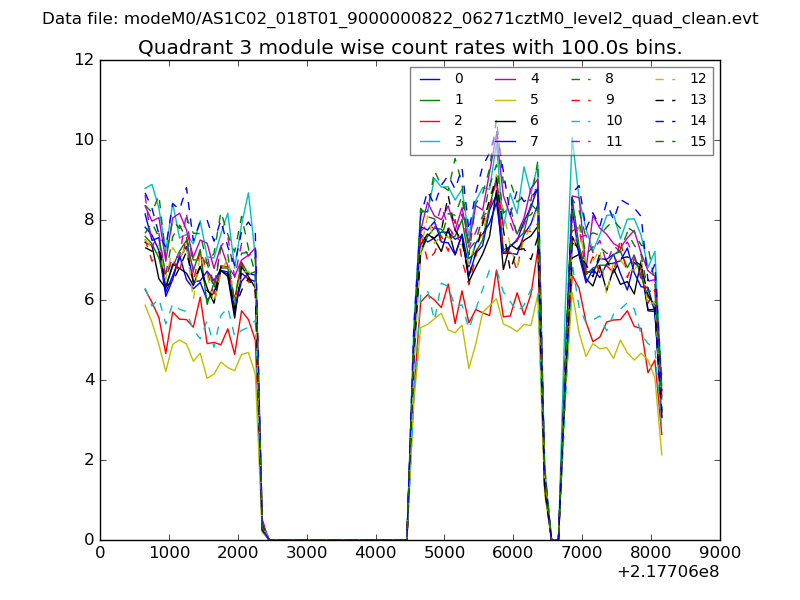
| Module-wise count rates for Quadrant A Data is divided into 100 sec bins |
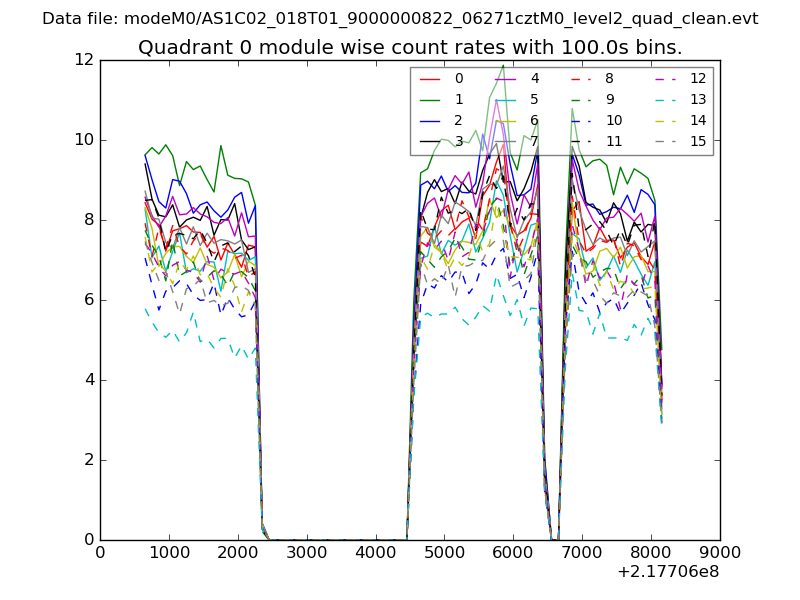 |
 |
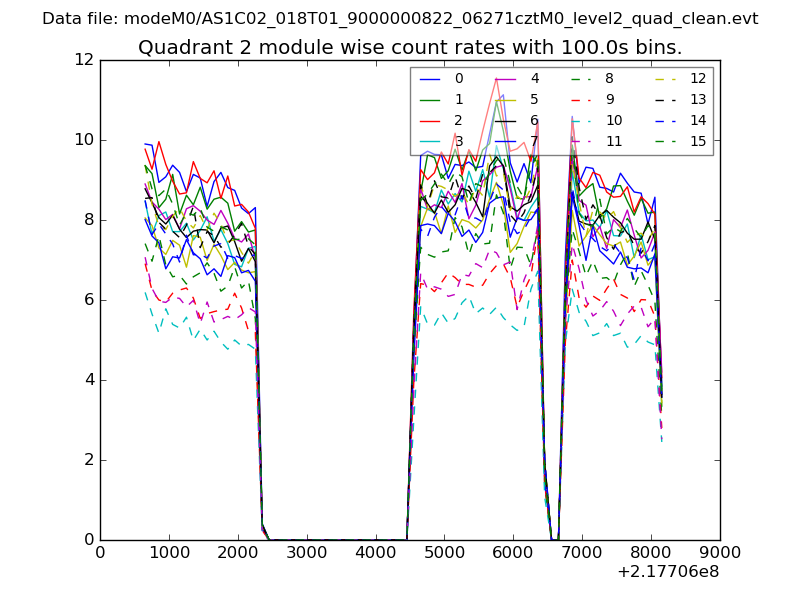
| Module-wise count rates for Quadrant B Data is divided into 100 sec bins |
 |
 |
| Module-wise count rates for Quadrant C Data is divided into 100 sec bins |
 |
 |
| Module-wise count rates for Quadrant D Data is divided into 100 sec bins |
 |
 |
| Parameter | Plot |
|---|---|
| CZT HV Monitor | 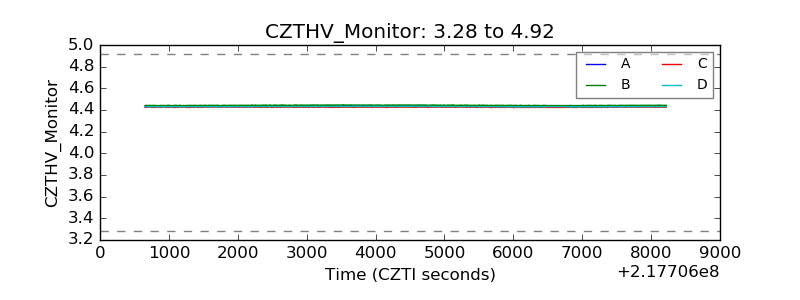 |
| D_VDD | 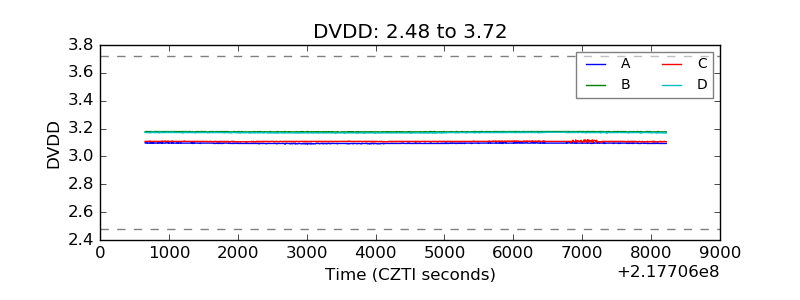 |
| Temperature 1 | 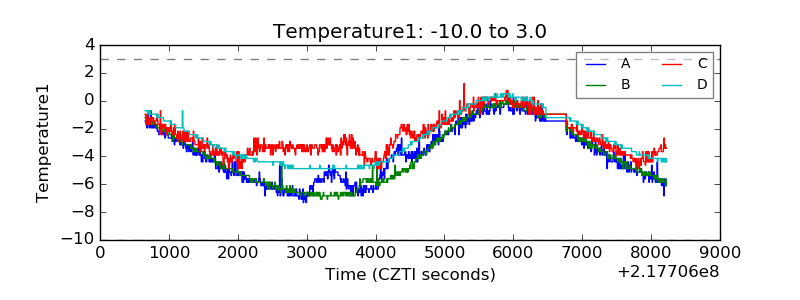 |
| Veto HV Monitor | 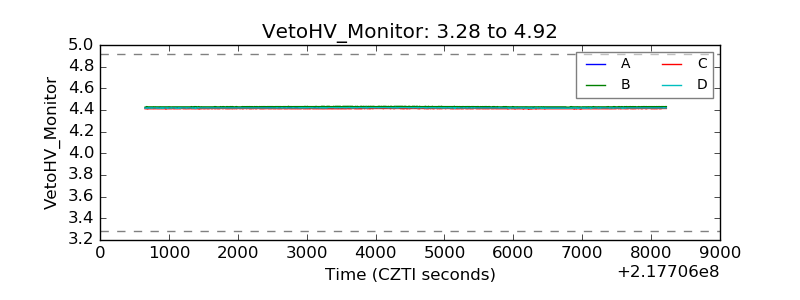 |
| Veto LLD | 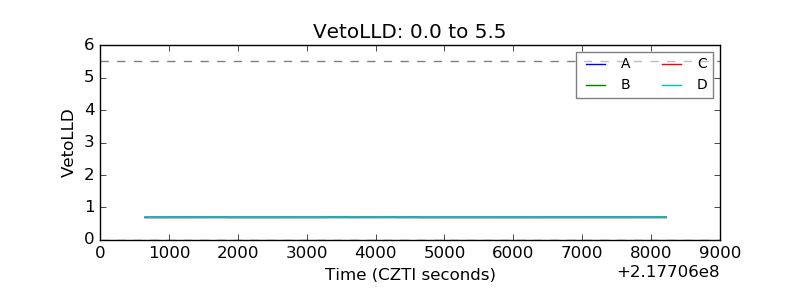 |
| Alpha Counter | 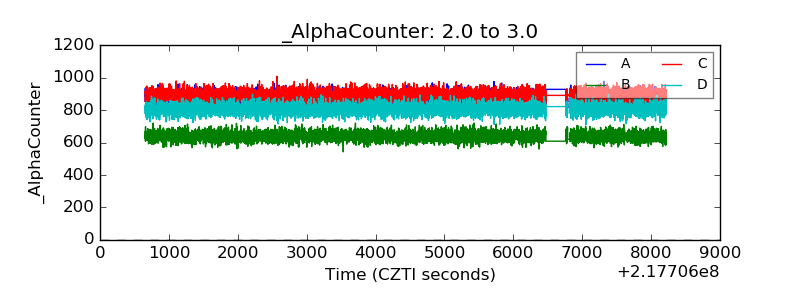 |
| _CPM_Rate | 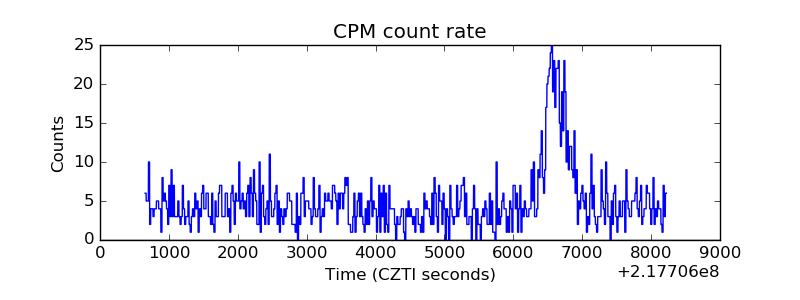 |
| CZT Counter | 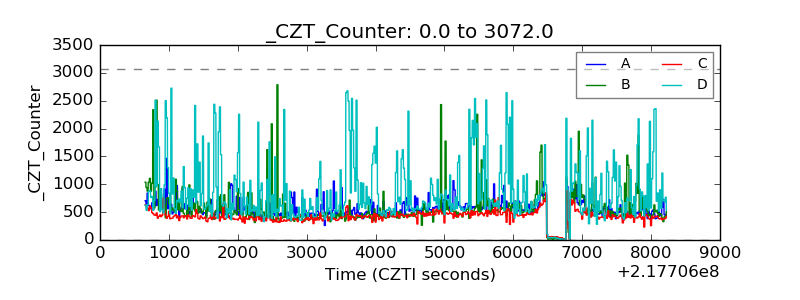 |
| +2.5 Volts monitor |  |
| +5 Volts monitor |  |
| _ROLL_ROT | 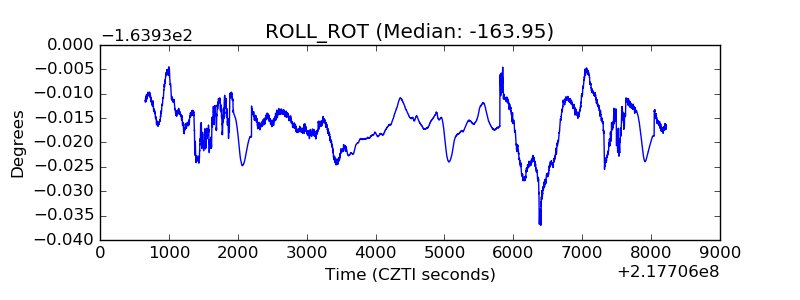 |
| _Roll_DEC | 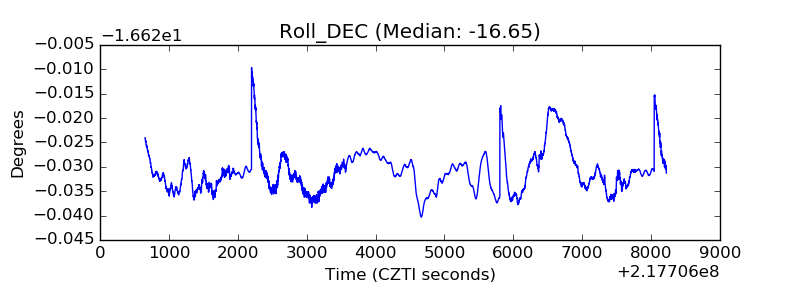 |
| _Roll_RA | 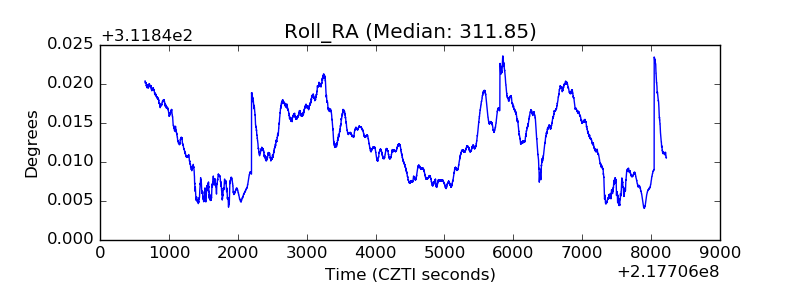 |
| Veto Counter | 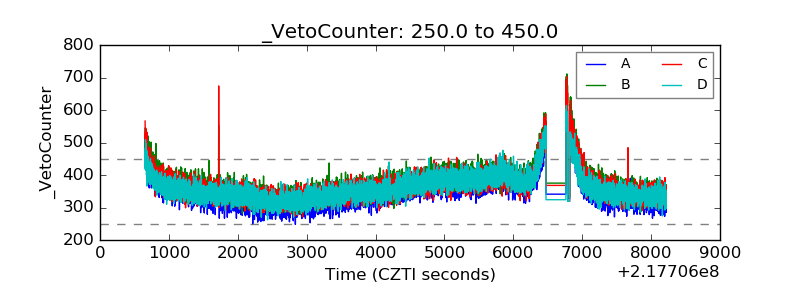 |