| Param | Original file | Final file |
|---|---|---|
| Filename | modeM0/AS1C02_018T01_9000000822_06272cztM0_level2.evt | modeM0/AS1C02_018T01_9000000822_06272cztM0_level2_quad_clean.evt |
| Size (bytes) | 631,163,520 | 92,111,040 |
| Size | 601.9 MB | 87.8 MB |
| Events in quadrant A | 4,879,391 | 560,085 |
| Events in quadrant B | 4,140,398 | 574,473 |
| Events in quadrant C | 3,398,621 | 588,829 |
| Events in quadrant D | 6,174,549 | 529,669 |
| Mode SS | |||
|---|---|---|---|
| Quadrant | BADHDUFLAG | Total packets | Discarded packets |
| A | 0 | 158 | 0 |
| B | 0 | 158 | 0 |
| C | 0 | 158 | 0 |
| D | 0 | 158 | 0 |
| Mode M0 | |||
|---|---|---|---|
| Quadrant | BADHDUFLAG | Total packets | Discarded packets |
| A | 0 | 19551 | 5 |
| B | 0 | 17604 | 4 |
| C | 0 | 15769 | 4 |
| D | 0 | 23732 | 4 |
| Mode M9 | |||
|---|---|---|---|
| Quadrant | BADHDUFLAG | Total packets | Discarded packets |
| A | 0 | 3 | 0 |
| B | 0 | 3 | 0 |
| C | 0 | 3 | 0 |
| D | 0 | 4 | 0 |
| Quadrant | Total seconds | Saturated seconds | Saturation percentage |
|---|---|---|---|
| A | 7705 | 181 | 2.349124% |
| B | 7705 | 164 | 2.128488% |
| C | 7705 | 28 | 0.363400% |
| D | 7705 | 588 | 7.631408% |
Noise dominated data is calculated using 1-second bins in cleaned event files. If a bin has >2000 counts, and if more than 50% of those come from <1% of pixels, then it is considered to be noise-dominated and hence unusable.
| Quadrant | # 1 sec bins | Bins with >0 counts | Bins with >2000 counts | High rate bins dominated by noise | Noise dominated (total time) | Noise dominated (detector-on time) | Marked lightcurve |
|---|---|---|---|---|---|---|---|
| A | 8020 | 7708 | 10 | 10 | 0.12% | 0.13% | 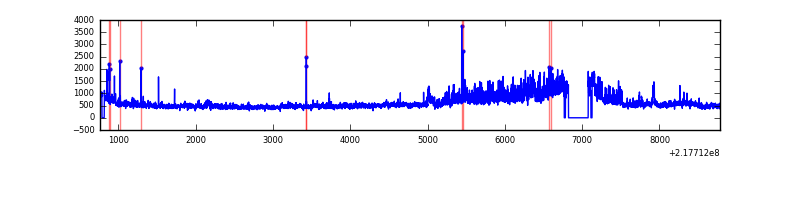 |
| B | 8020 | 7709 | 60 | 60 | 0.75% | 0.78% | 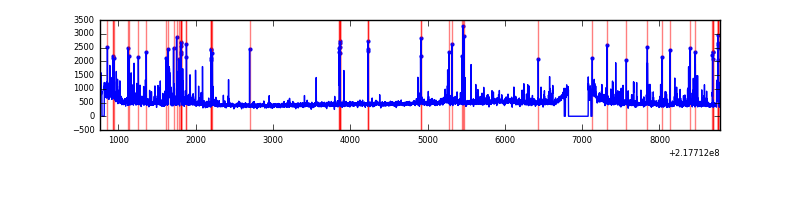 |
| C | 8020 | 7709 | 0 | 0 | 0.00% | 0.00% | 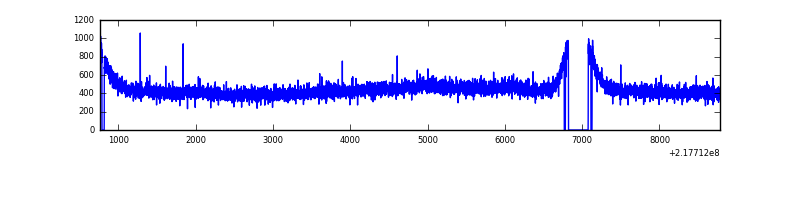 |
| D | 8020 | 7708 | 478 | 478 | 5.96% | 6.20% | 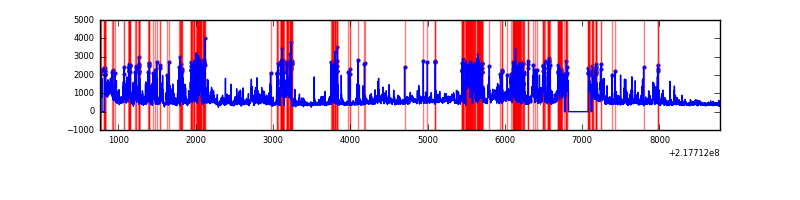 |
Top three noisy pixels from each quadrant. If the there are fewer than three noisy pixels in the level2.evt file, extra rows are filled as -1
| Pixel properties | Quadrant properties | ||||||
|---|---|---|---|---|---|---|---|
| Quadrant | DetID | PixID | Counts | Sigma | Mean | Median | Sigma |
| A | 8 | 15 | 1153621 | 6386.84 | 875 | 856 | 180.5 |
| A | 15 | 236 | 276310 | 1526.14 | 875 | 856 | 180.5 |
| A | 13 | 251 | 73068 | 400.09 | 875 | 856 | 180.5 |
| B | 3 | 64 | 284754 | 1643.37 | 891 | 868 | 172.7 |
| B | 0 | 219 | 177682 | 1023.54 | 891 | 868 | 172.7 |
| B | 15 | 204 | 62244 | 355.29 | 891 | 868 | 172.7 |
| C | 13 | 61 | 7002 | 30.56 | 864 | 867 | 200.7 |
| C | 8 | 128 | 6453 | 27.83 | 864 | 867 | 200.7 |
| C | 10 | 22 | 5979 | 25.47 | 864 | 867 | 200.7 |
| D | 12 | 220 | 2296049 | 11098.2 | 831 | 806 | 206.8 |
| D | 2 | 152 | 208190 | 1002.76 | 831 | 806 | 206.8 |
| D | 2 | 63 | 113160 | 543.27 | 831 | 806 | 206.8 |
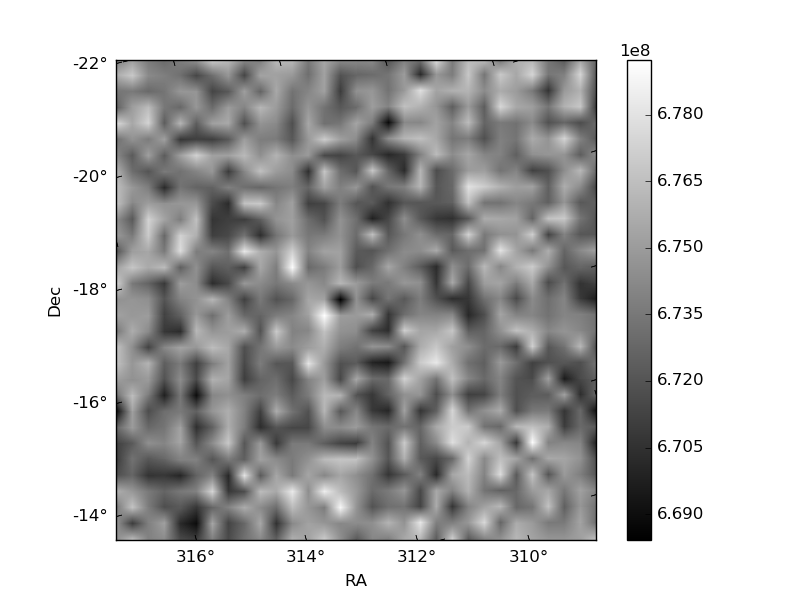
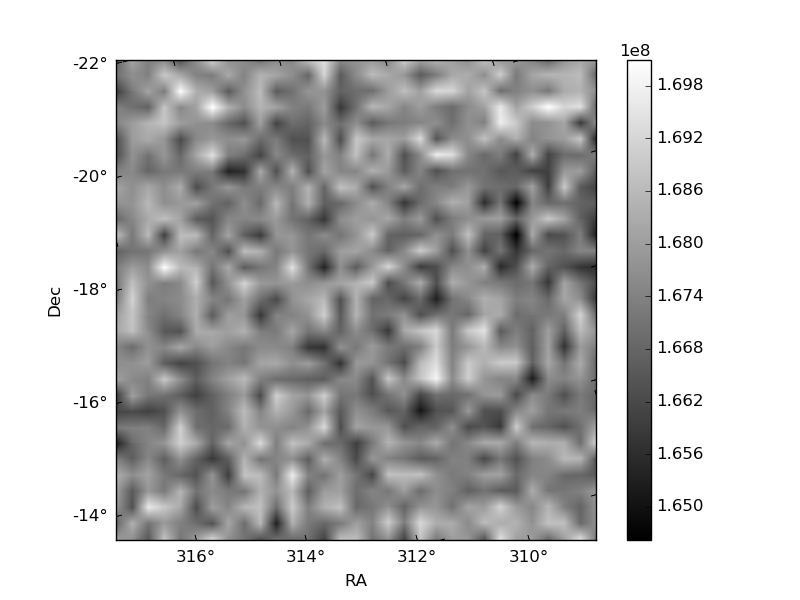
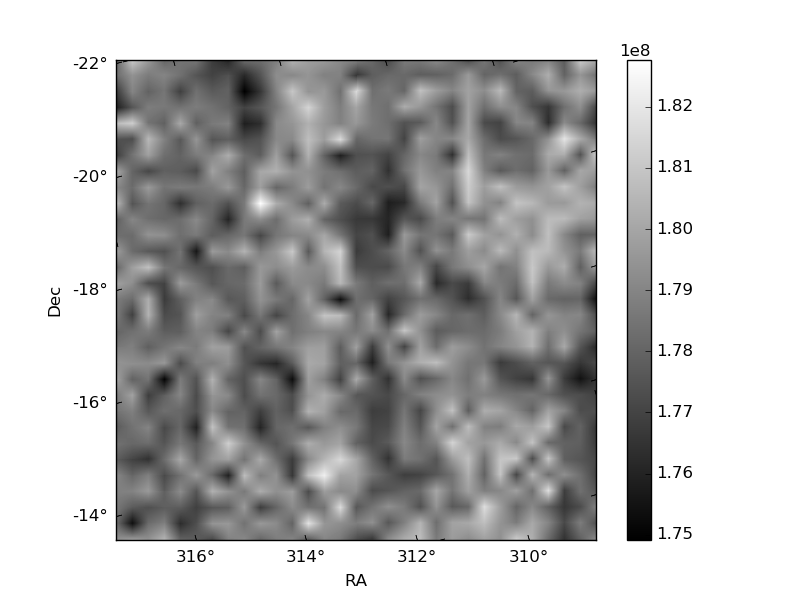
Histogram calculated using DETX and DETY for each event in the final _common_clean file
| Quadrant A | 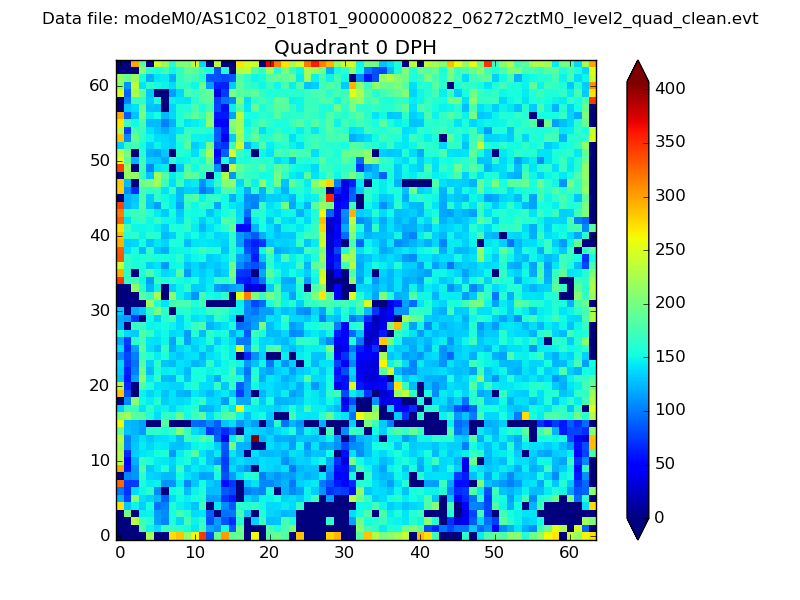 |
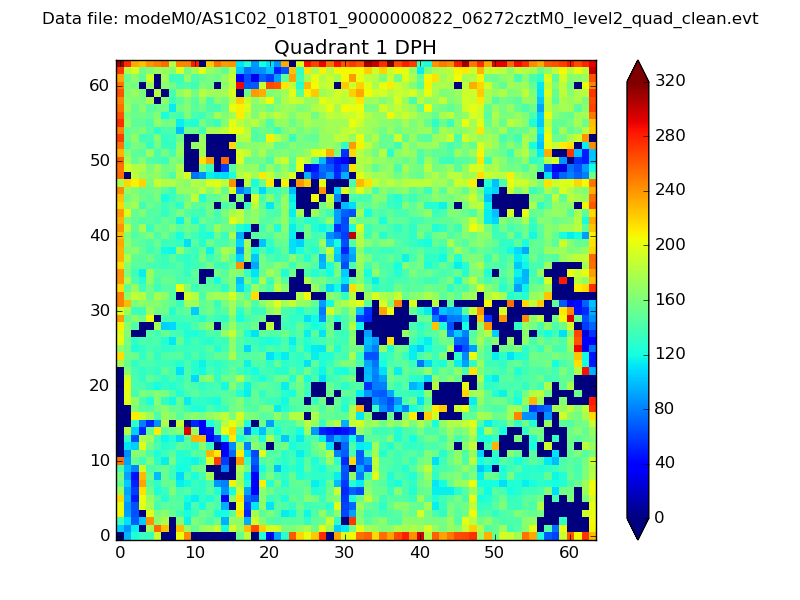 |
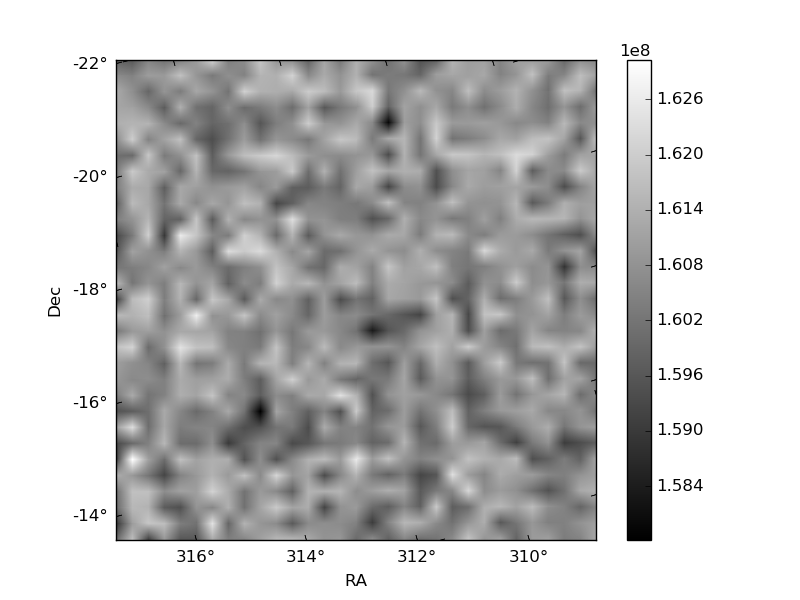
Quadrant B |
|---|---|---|---|
| Quadrant D | 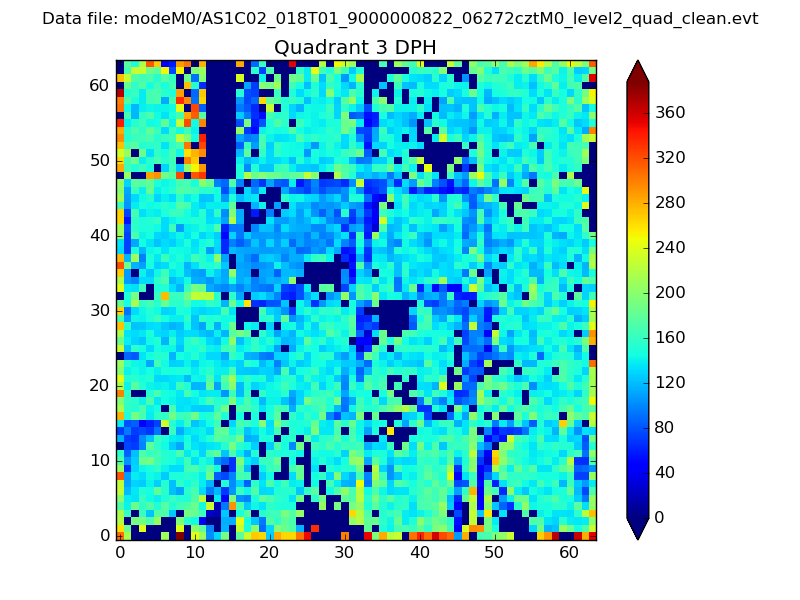 |
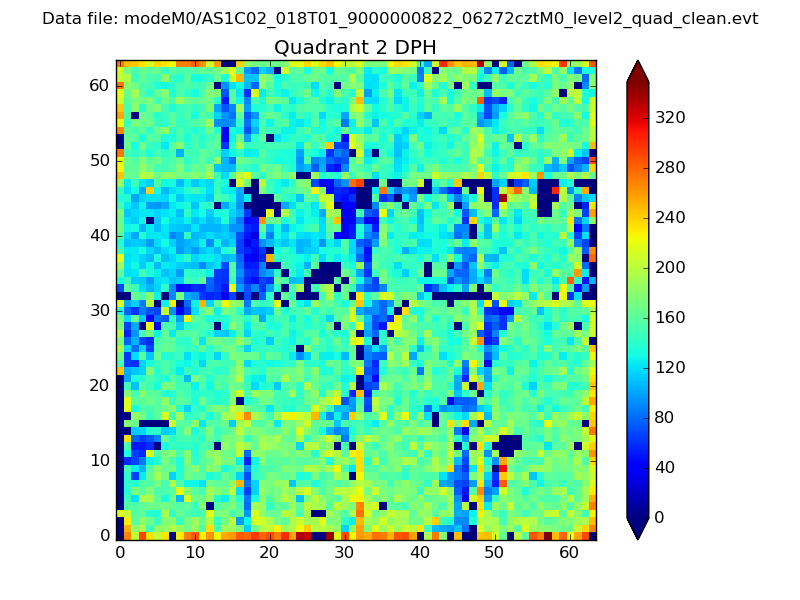 |
Quadrant C |
| Plot type | Count rate plots | Images |
|---|---|---|
| Comparison with Poisson distribution Blue bars denote a histogram of data divided into 1 sec bins. Red curve is a Poisson curve with rate = median count rate of data. |
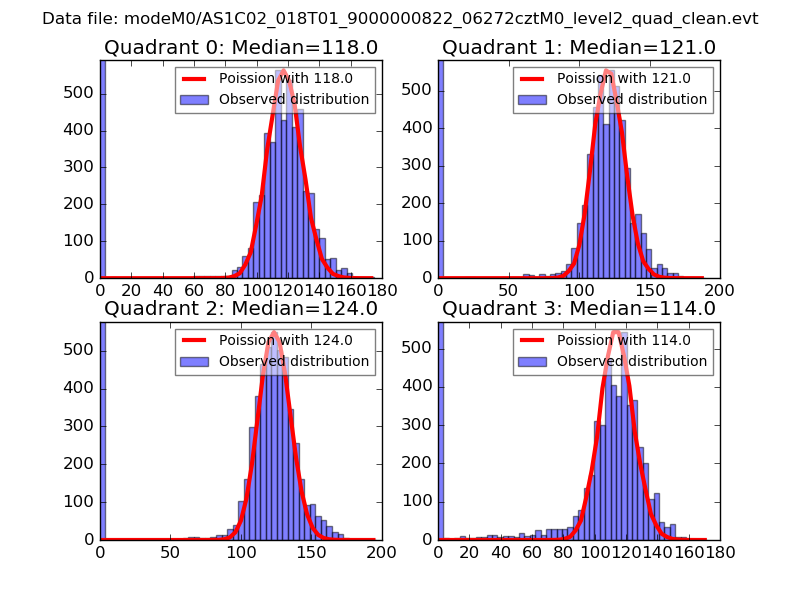 |
 |
| Quadrant-wise count rates Data is divided into 100 sec bins |
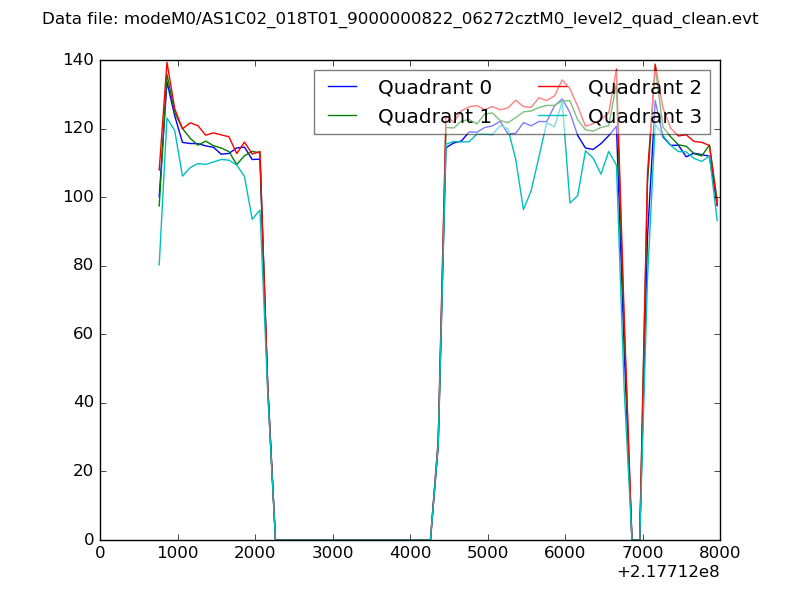 |
|
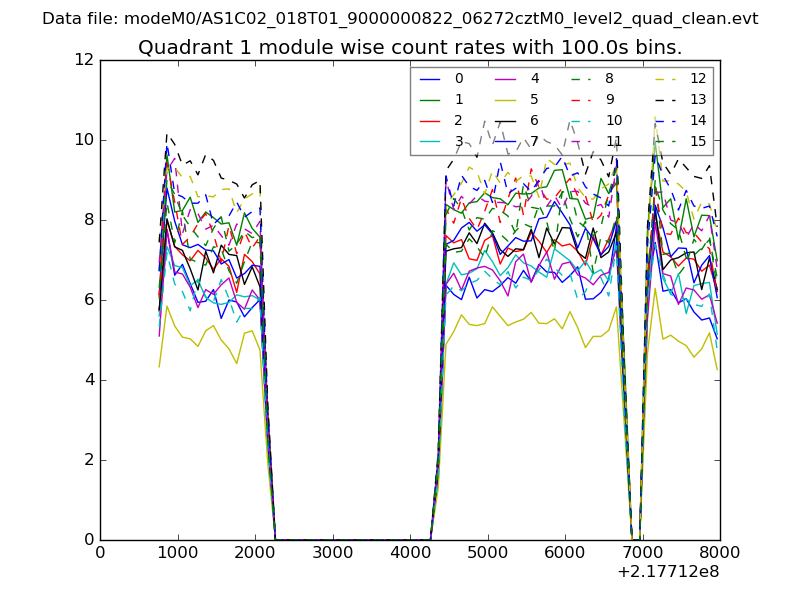
| Module-wise count rates for Quadrant A Data is divided into 100 sec bins |
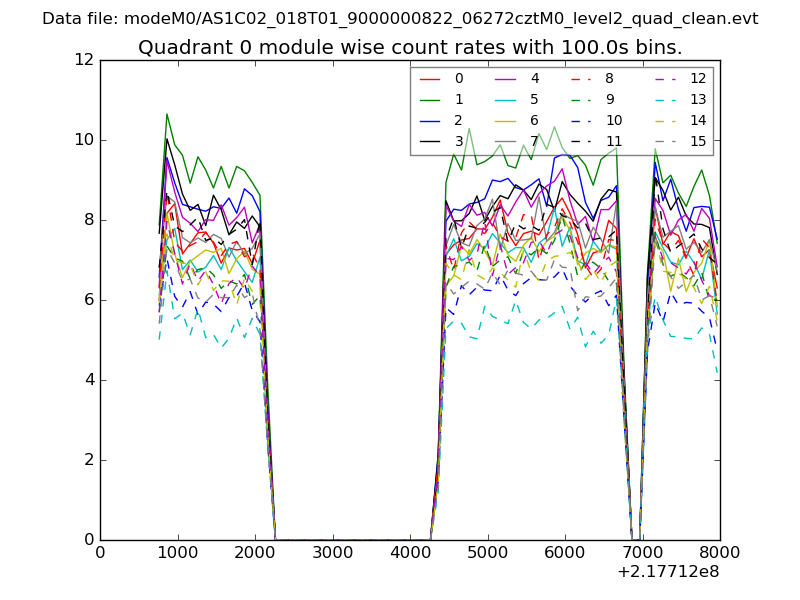 |
 |
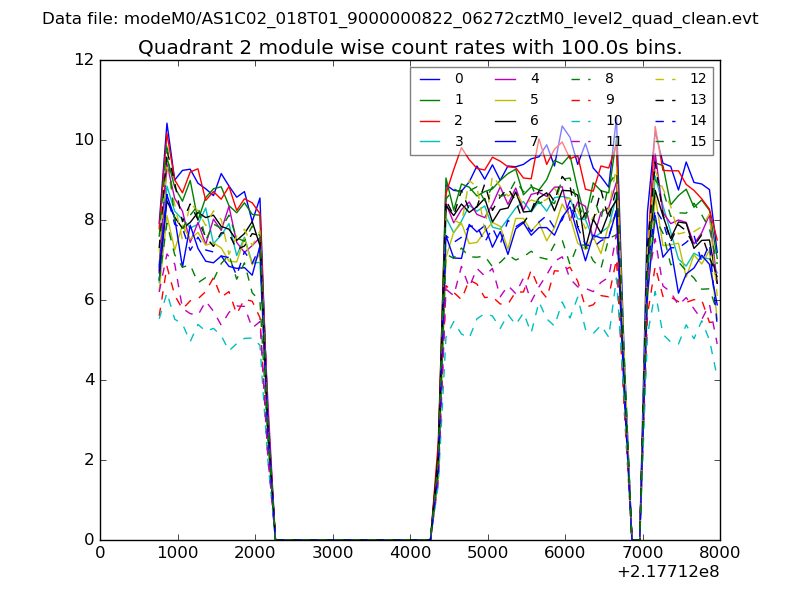
| Module-wise count rates for Quadrant B Data is divided into 100 sec bins |
 |
 |
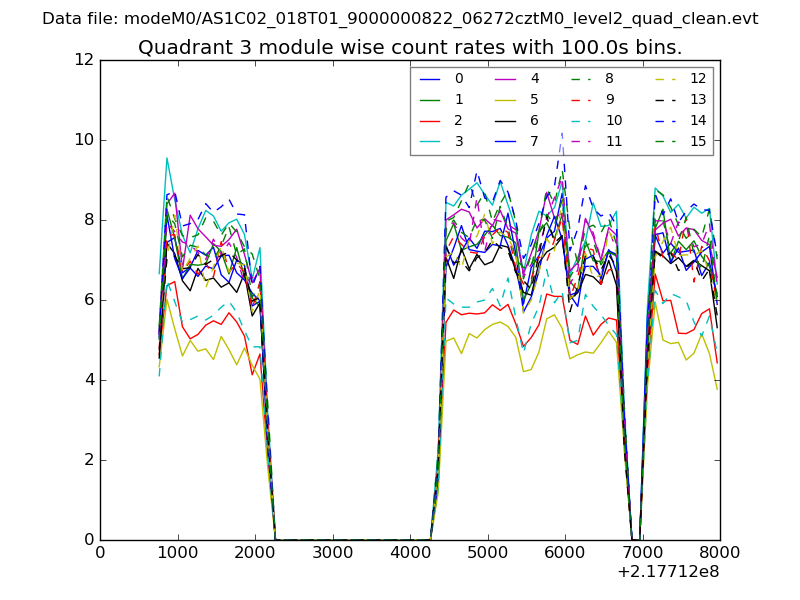
| Module-wise count rates for Quadrant C Data is divided into 100 sec bins |
 |
 |
| Module-wise count rates for Quadrant D Data is divided into 100 sec bins |
 |
 |
| Parameter | Plot |
|---|---|
| CZT HV Monitor | 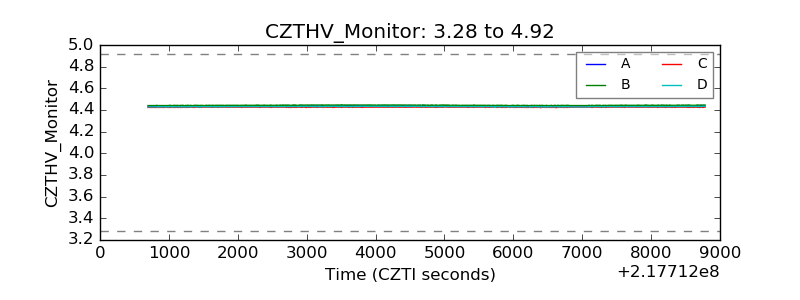 |
| D_VDD | 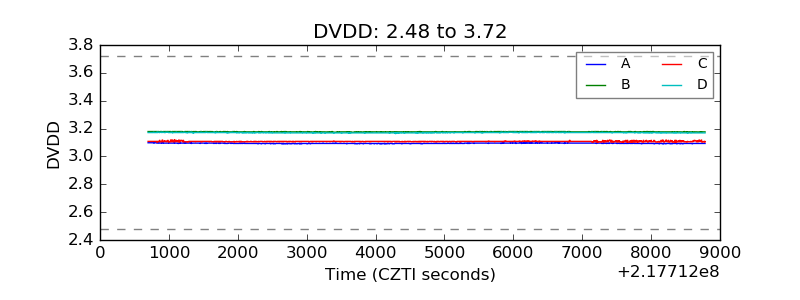 |
| Temperature 1 | 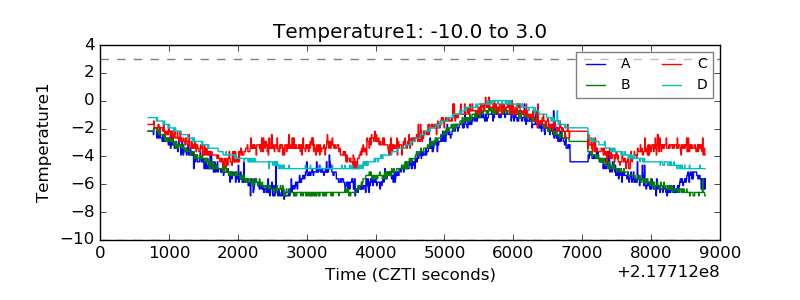 |
| Veto HV Monitor | 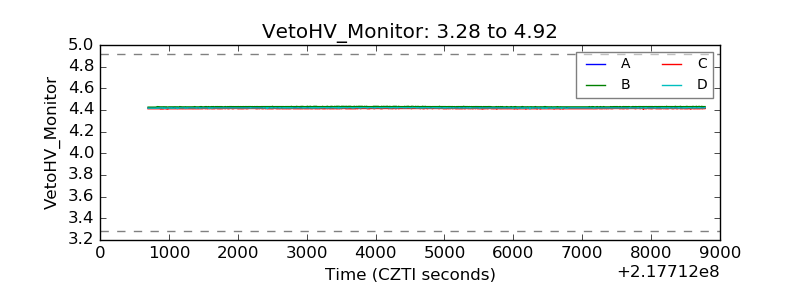 |
| Veto LLD | 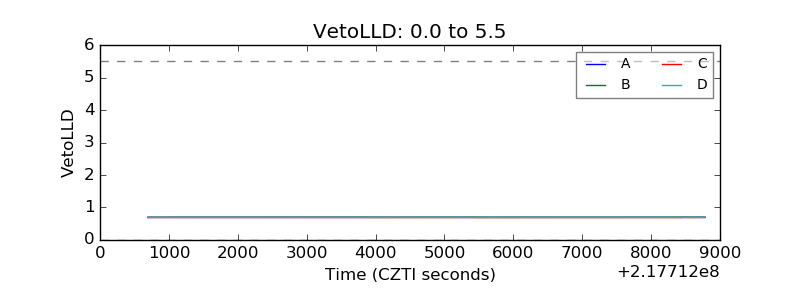 |
| Alpha Counter | 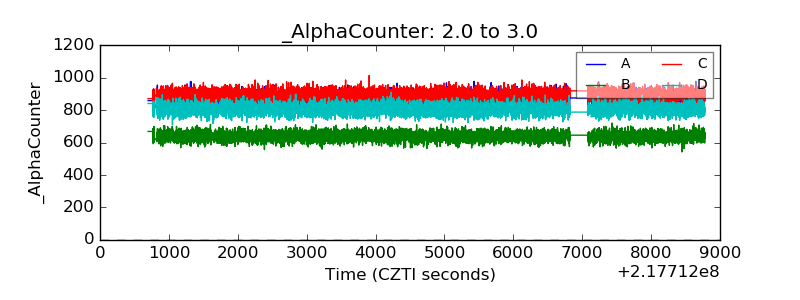 |
| _CPM_Rate | 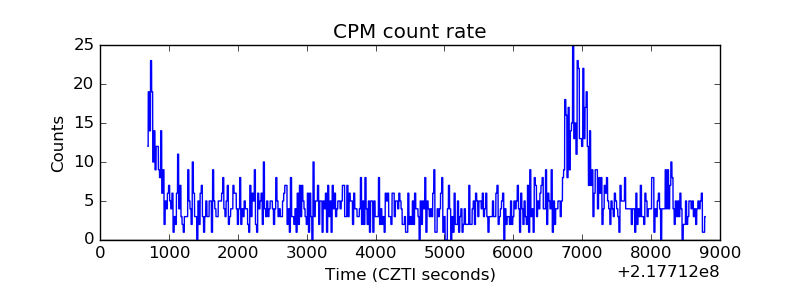 |
| CZT Counter | 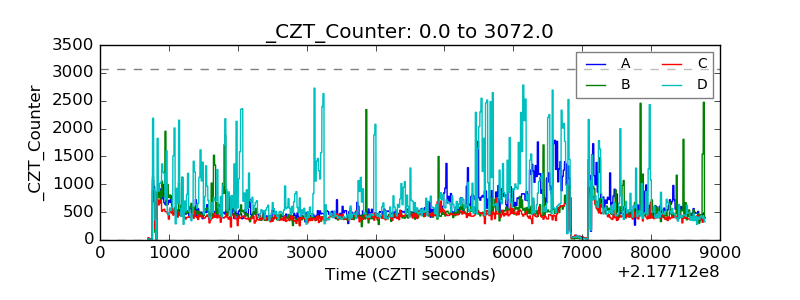 |
| +2.5 Volts monitor |  |
| +5 Volts monitor | 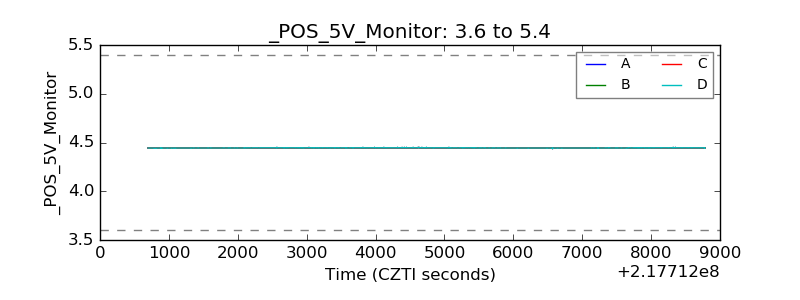 |
| _ROLL_ROT | 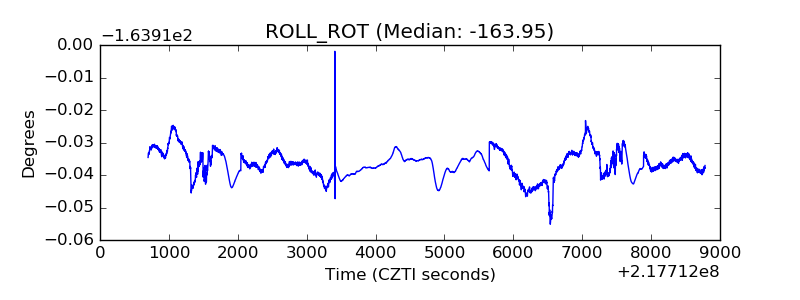 |
| _Roll_DEC | 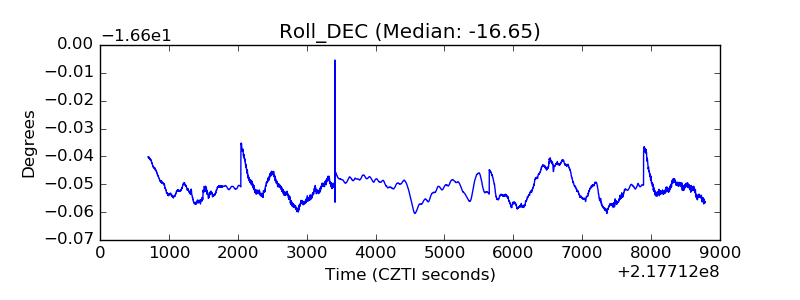 |
| _Roll_RA | 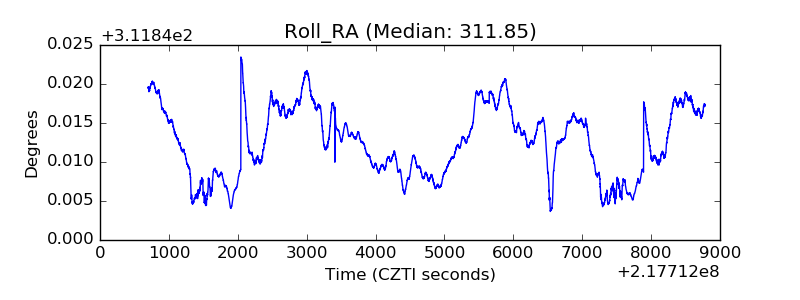 |
| Veto Counter | 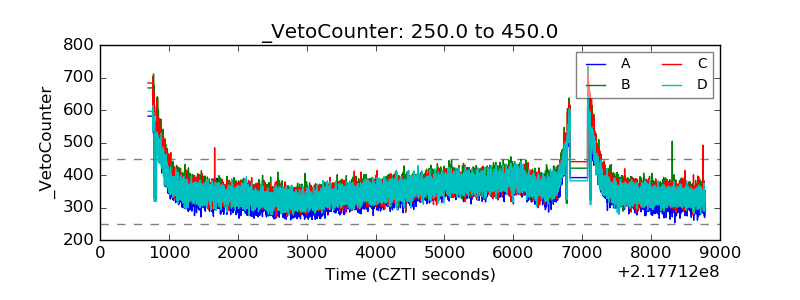 |