| Param | Original file | Final file |
|---|---|---|
| Filename | modeM0/AS1C02_018T01_9000000822_06275cztM0_level2.evt | modeM0/AS1C02_018T01_9000000822_06275cztM0_level2_quad_clean.evt |
| Size (bytes) | 285,825,600 | 33,690,240 |
| Size | 272.6 MB | 32.1 MB |
| Events in quadrant A | 2,269,173 | 183,259 |
| Events in quadrant B | 1,978,399 | 190,973 |
| Events in quadrant C | 1,668,300 | 195,512 |
| Events in quadrant D | 2,478,652 | 179,113 |
| Mode SS | |||
|---|---|---|---|
| Quadrant | BADHDUFLAG | Total packets | Discarded packets |
| A | 0 | 80 | 0 |
| B | 0 | 80 | 0 |
| C | 0 | 80 | 0 |
| D | 0 | 80 | 0 |
| Mode M0 | |||
|---|---|---|---|
| Quadrant | BADHDUFLAG | Total packets | Discarded packets |
| A | 0 | 9099 | 3 |
| B | 0 | 8593 | 3 |
| C | 0 | 7873 | 3 |
| D | 0 | 10016 | 3 |
| Mode M9 | |||
|---|---|---|---|
| Quadrant | BADHDUFLAG | Total packets | Discarded packets |
| A | 0 | 2 | 0 |
| B | 0 | 2 | 0 |
| C | 0 | 2 | 0 |
| D | 0 | 2 | 0 |
| Quadrant | Total seconds | Saturated seconds | Saturation percentage |
|---|---|---|---|
| A | 3825 | 118 | 3.084967% |
| B | 3825 | 84 | 2.196078% |
| C | 3825 | 21 | 0.549020% |
| D | 3825 | 236 | 6.169935% |
Noise dominated data is calculated using 1-second bins in cleaned event files. If a bin has >2000 counts, and if more than 50% of those come from <1% of pixels, then it is considered to be noise-dominated and hence unusable.
| Quadrant | # 1 sec bins | Bins with >0 counts | Bins with >2000 counts | High rate bins dominated by noise | Noise dominated (total time) | Noise dominated (detector-on time) | Marked lightcurve |
|---|---|---|---|---|---|---|---|
| A | 4110 | 3828 | 0 | 0 | 0.00% | 0.00% | 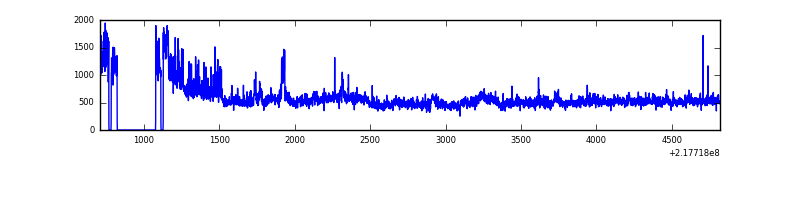 |
| B | 4110 | 3828 | 32 | 32 | 0.78% | 0.84% | 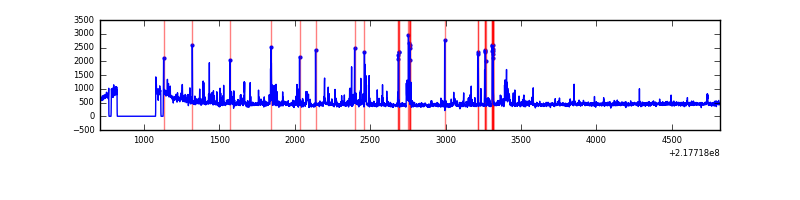 |
| C | 4110 | 3828 | 0 | 0 | 0.00% | 0.00% | 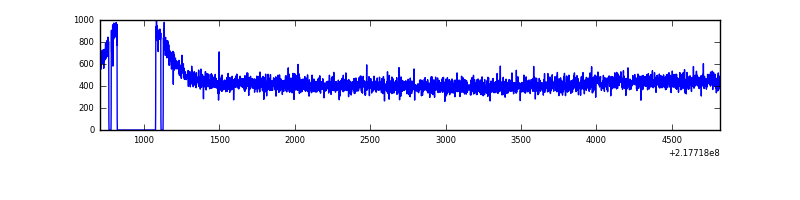 |
| D | 4110 | 3828 | 169 | 169 | 4.11% | 4.41% | 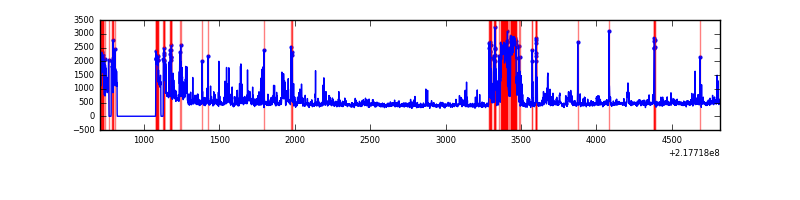 |
Top three noisy pixels from each quadrant. If the there are fewer than three noisy pixels in the level2.evt file, extra rows are filled as -1
| Pixel properties | Quadrant properties | ||||||
|---|---|---|---|---|---|---|---|
| Quadrant | DetID | PixID | Counts | Sigma | Mean | Median | Sigma |
| A | 8 | 15 | 356800 | 4026.04 | 423 | 414 | 88.5 |
| A | 15 | 236 | 259885 | 2931.21 | 423 | 414 | 88.5 |
| A | 13 | 251 | 17036 | 187.78 | 423 | 414 | 88.5 |
| B | 3 | 64 | 132704 | 1534.64 | 436 | 425 | 86.2 |
| B | 0 | 219 | 93027 | 1074.32 | 436 | 425 | 86.2 |
| B | 4 | 81 | 21395 | 243.28 | 436 | 425 | 86.2 |
| C | 8 | 128 | 5695 | 52.27 | 423 | 425 | 100.8 |
| C | 13 | 61 | 3354 | 29.05 | 423 | 425 | 100.8 |
| C | 8 | 112 | 2857 | 24.12 | 423 | 425 | 100.8 |
| D | 2 | 14 | 358594 | 3503.86 | 406 | 393 | 102.2 |
| D | 12 | 220 | 323122 | 3156.88 | 406 | 393 | 102.2 |
| D | 5 | 97 | 58081 | 564.29 | 406 | 393 | 102.2 |
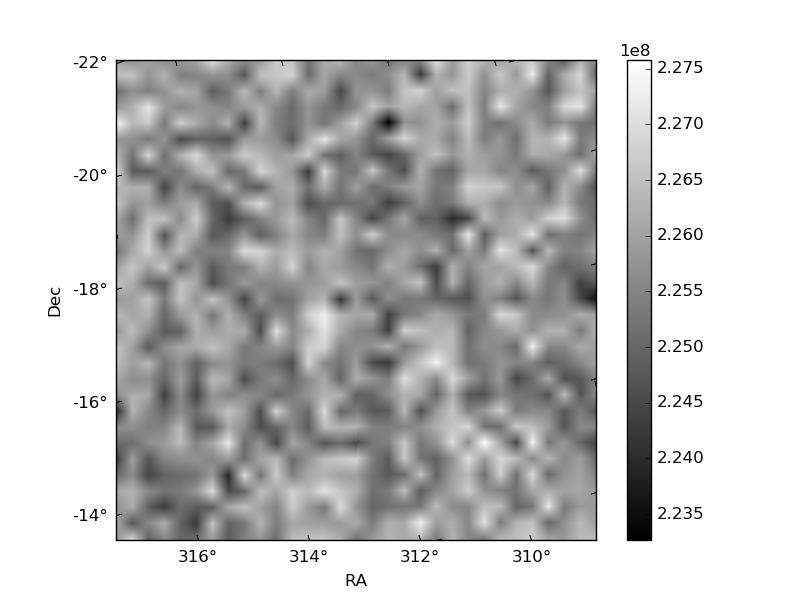
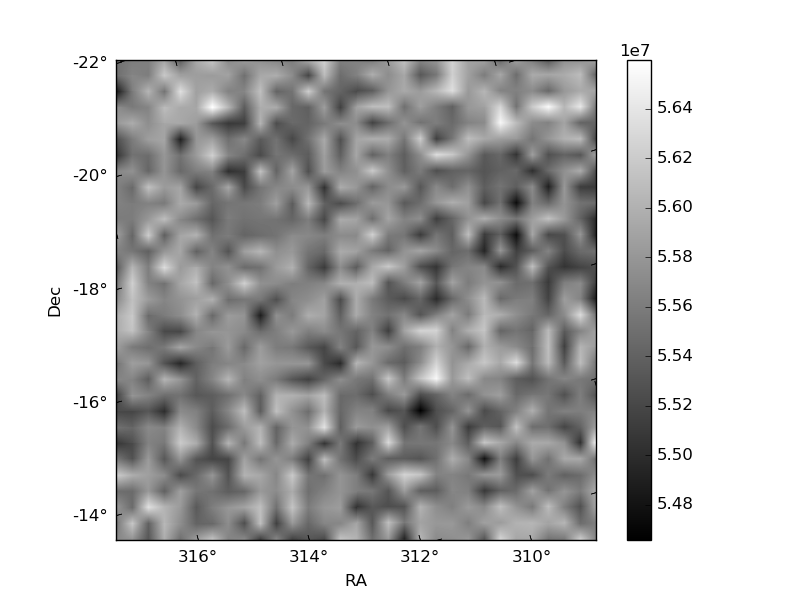
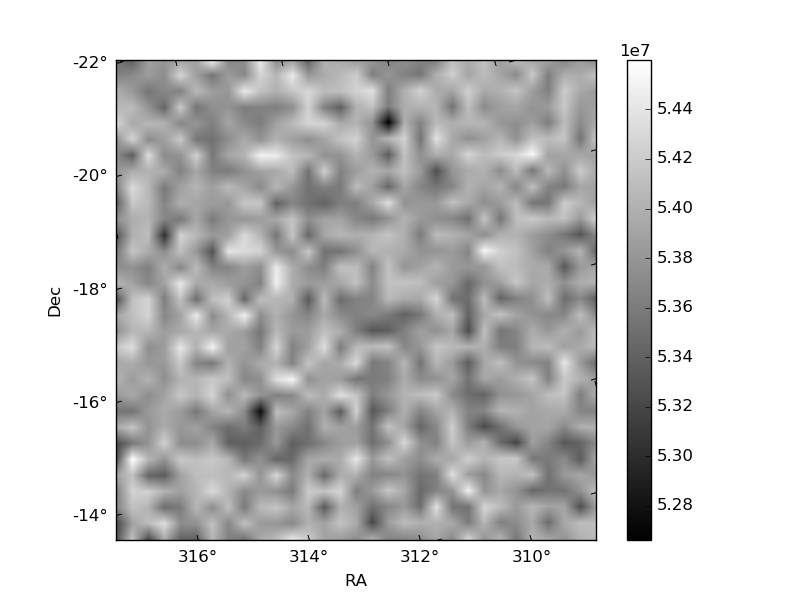
Histogram calculated using DETX and DETY for each event in the final _common_clean file
| Quadrant A | 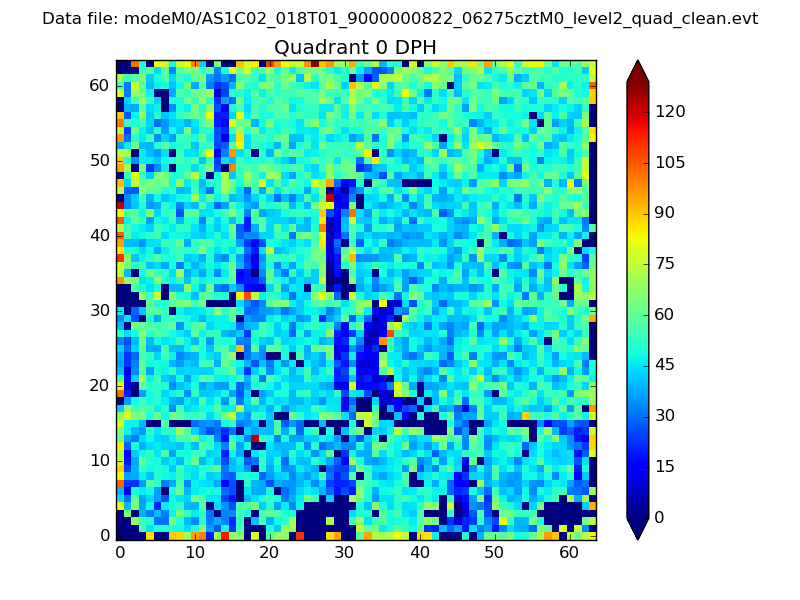 |
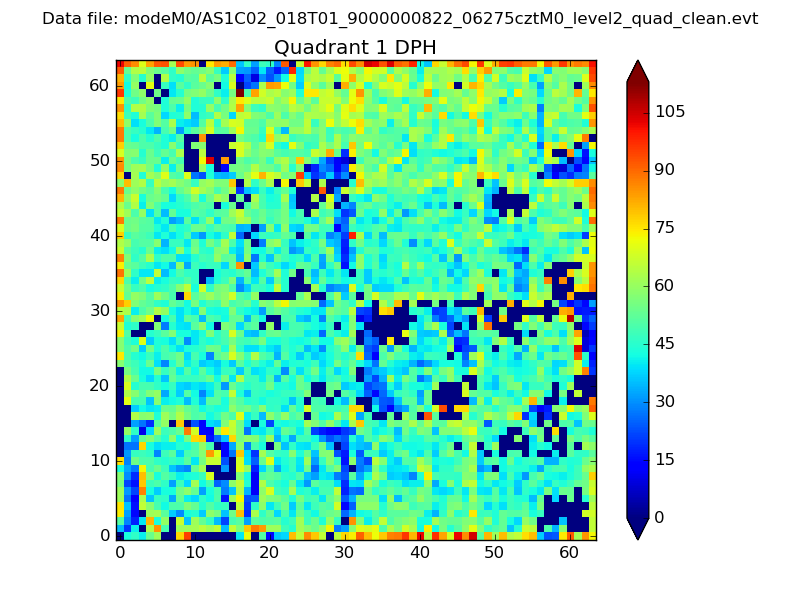 |
Quadrant B |
|---|---|---|---|
| Quadrant D | 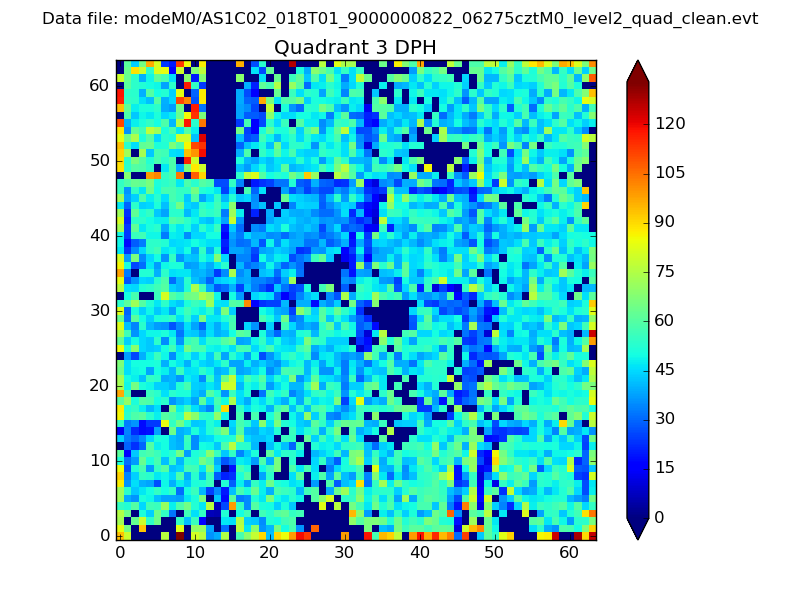 |
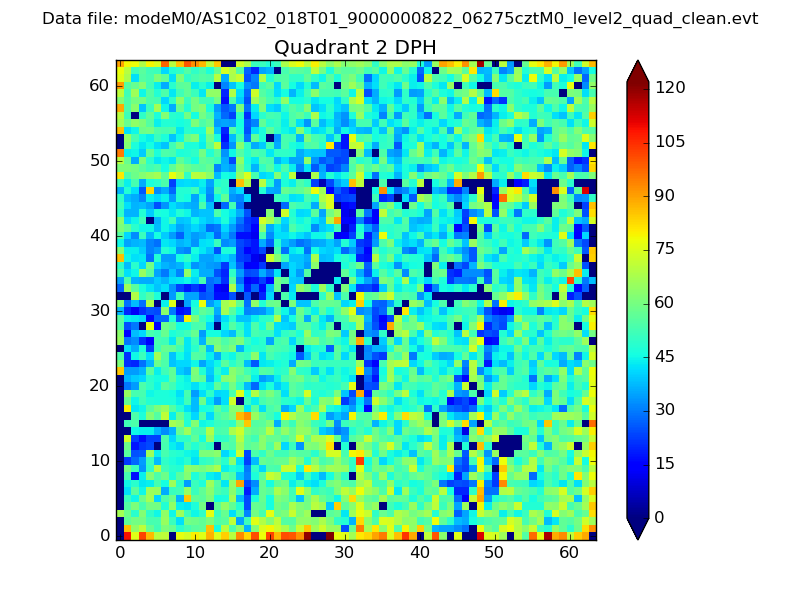 |
Quadrant C |
| Plot type | Count rate plots | Images |
|---|---|---|
| Comparison with Poisson distribution Blue bars denote a histogram of data divided into 1 sec bins. Red curve is a Poisson curve with rate = median count rate of data. |
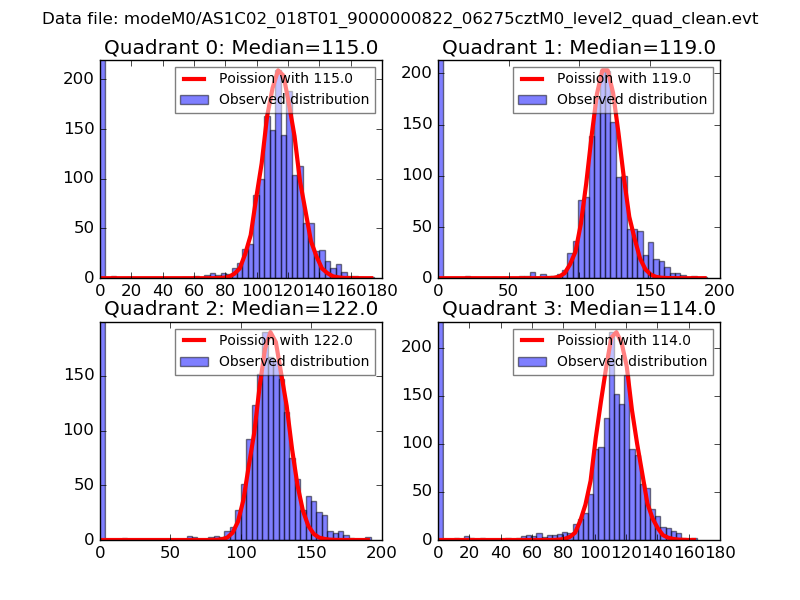 |
 |
| Quadrant-wise count rates Data is divided into 100 sec bins |
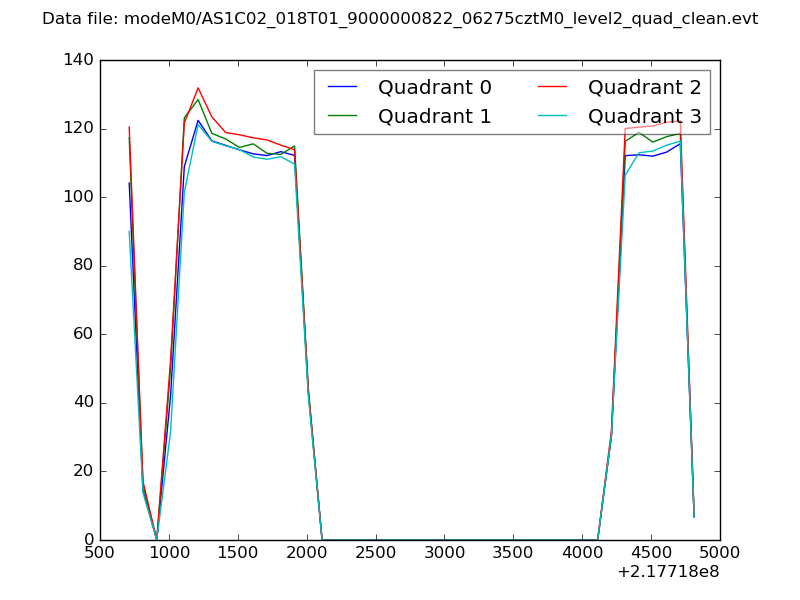 |
|
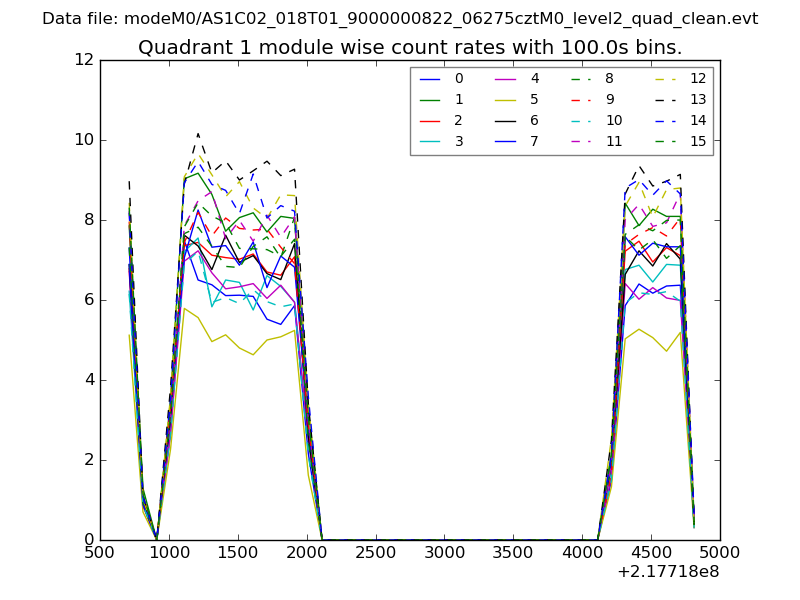
| Module-wise count rates for Quadrant A Data is divided into 100 sec bins |
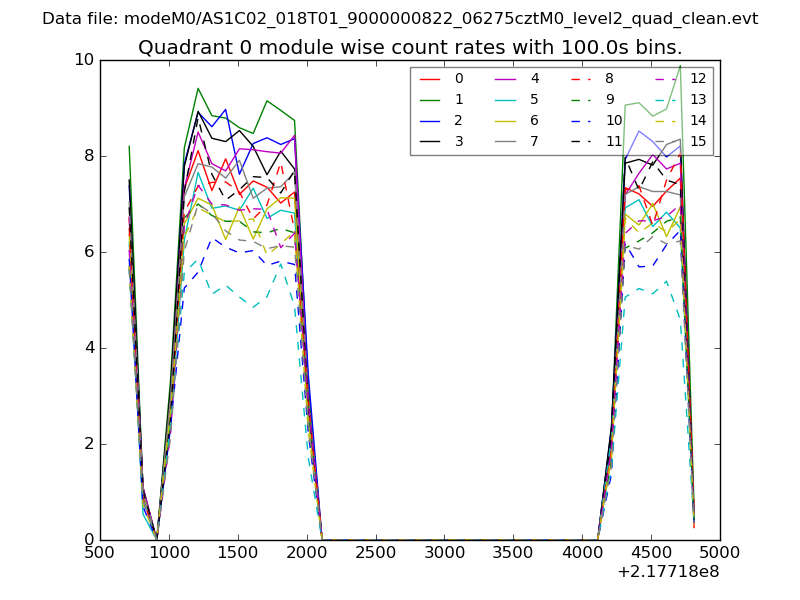 |
 |
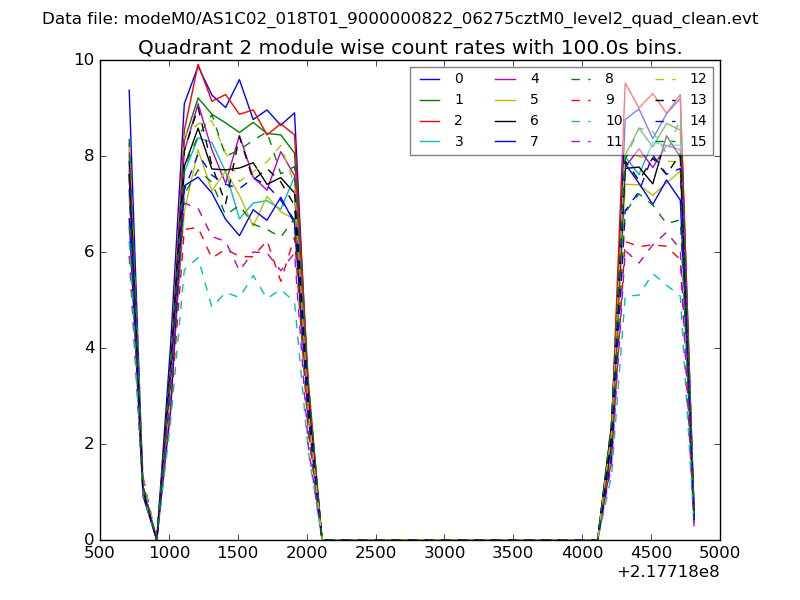
| Module-wise count rates for Quadrant B Data is divided into 100 sec bins |
 |
 |
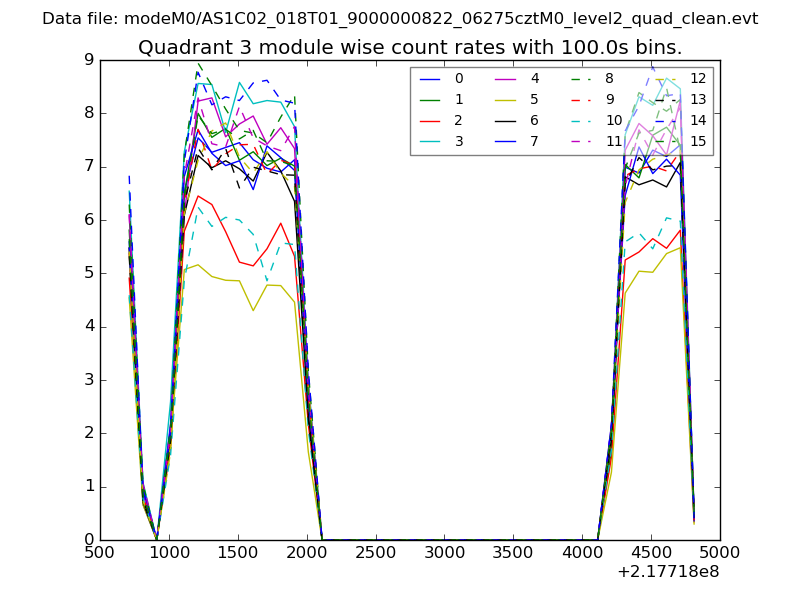
| Module-wise count rates for Quadrant C Data is divided into 100 sec bins |
 |
 |
| Module-wise count rates for Quadrant D Data is divided into 100 sec bins |
 |
 |
| Parameter | Plot |
|---|---|
| CZT HV Monitor | 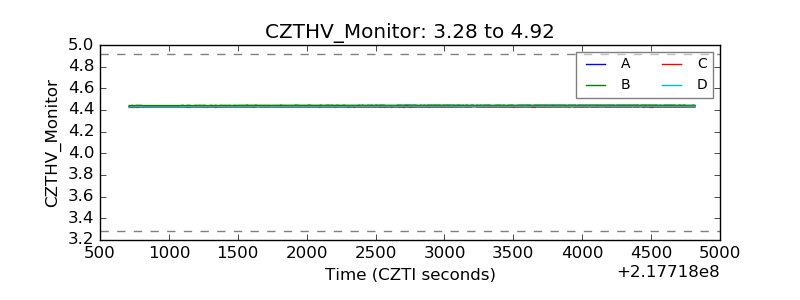 |
| D_VDD | 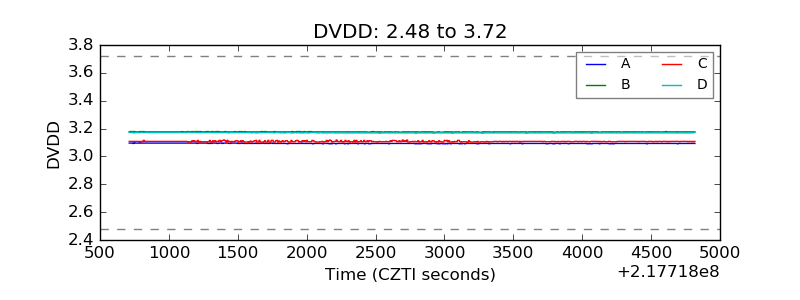 |
| Temperature 1 | 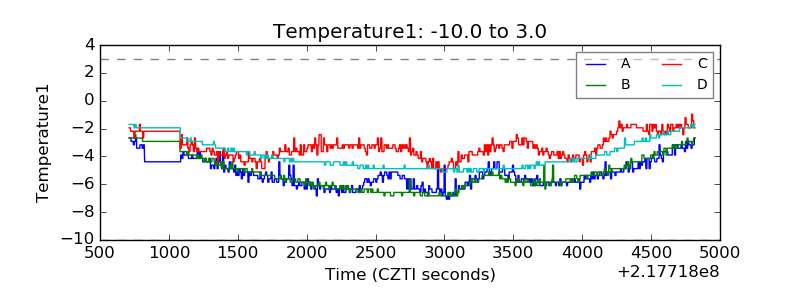 |
| Veto HV Monitor | 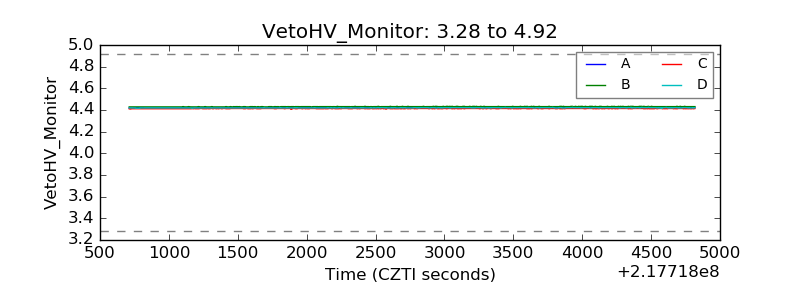 |
| Veto LLD | 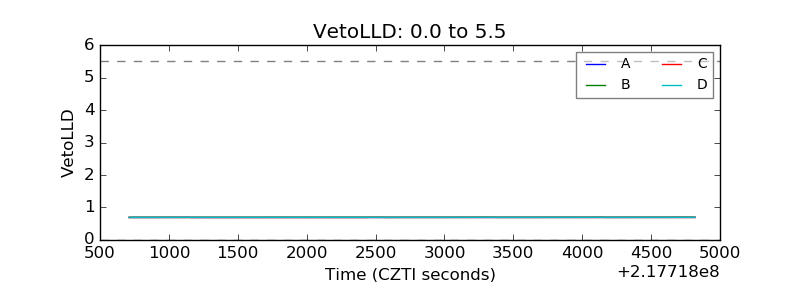 |
| Alpha Counter | 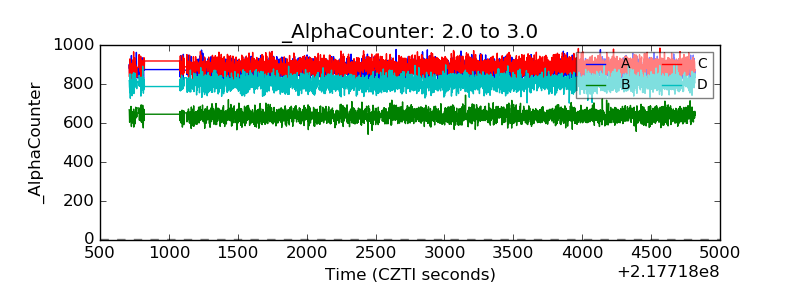 |
| _CPM_Rate | 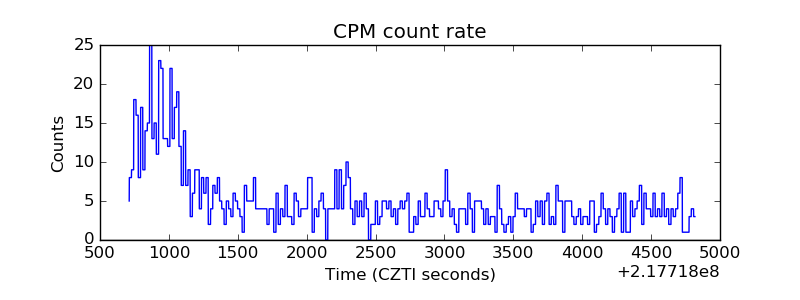 |
| CZT Counter | 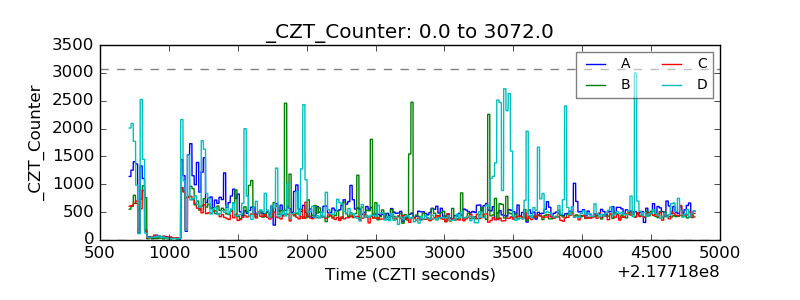 |
| +2.5 Volts monitor | 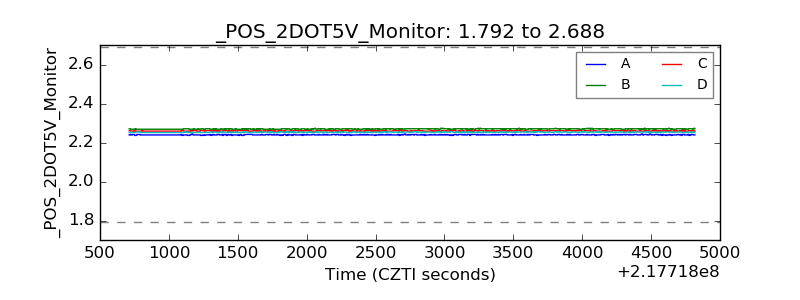 |
| +5 Volts monitor |  |
| _ROLL_ROT | 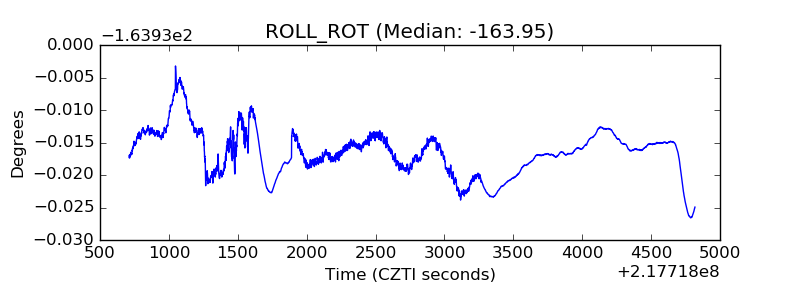 |
| _Roll_DEC | 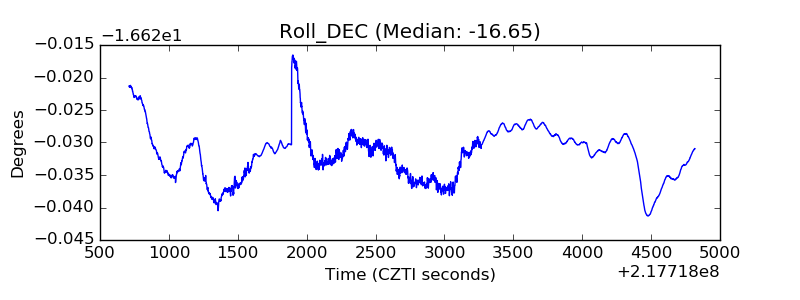 |
| _Roll_RA |  |
| Veto Counter | 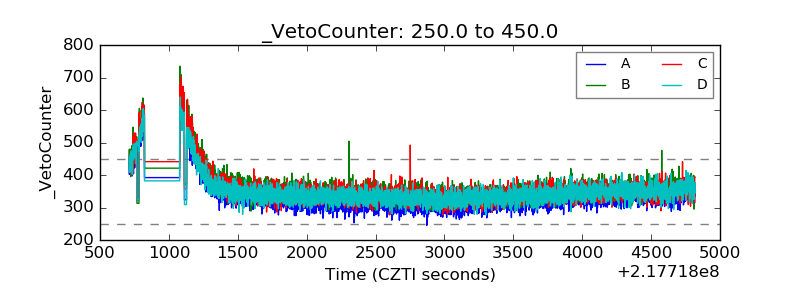 |