| Param | Original file | Final file |
|---|---|---|
| Filename | modeM0/AS1C02_018T02_9000000824cztM0_level2.fits | modeM0/AS1C02_018T02_9000000824cztM0_level2_quad_clean.evt |
| Size (bytes) | 337,155,840 | 337,605,120 |
| Size | 321.5 MB | 322.0 MB |
| Events in quadrant A | 2,028,214 | 1,994,793 |
| Events in quadrant B | 1,964,544 | 2,002,594 |
| Events in quadrant C | 2,023,770 | 1,975,605 |
| Events in quadrant D | 1,670,484 | 1,728,451 |
| Mode M9 | |||
|---|---|---|---|
| Quadrant | BADHDUFLAG | Total packets | Discarded packets |
| A | 0 | 73 | 0 |
| B | 0 | 73 | 0 |
| C | 0 | 73 | 0 |
| D | 0 | 73 | 0 |
| Mode M0 | |||
|---|---|---|---|
| Quadrant | BADHDUFLAG | Total packets | Discarded packets |
| A | 0 | 87805 | 0 |
| B | 0 | 83872 | 0 |
| C | 0 | 75567 | 0 |
| D | 0 | 109394 | 0 |
| Mode SS | |||
|---|---|---|---|
| Quadrant | BADHDUFLAG | Total packets | Discarded packets |
| A | 0 | 748 | 0 |
| B | 0 | 748 | 0 |
| C | 0 | 748 | 0 |
| D | 0 | 748 | 0 |
| Quadrant | Total seconds | Saturated seconds | Saturation percentage |
|---|---|---|---|
| A | 36732 | 638 | 1.736905% |
| B | 36731 | 1004 | 2.733386% |
| C | 36735 | 347 | 0.944603% |
| D | 36732 | 2666 | 7.257977% |
Noise dominated data is calculated using 1-second bins in cleaned event files. If a bin has >2000 counts, and if more than 50% of those come from <1% of pixels, then it is considered to be noise-dominated and hence unusable.
| Quadrant | # 1 sec bins | Bins with >0 counts | Bins with >2000 counts | High rate bins dominated by noise | Noise dominated (total time) | Noise dominated (detector-on time) | Marked lightcurve |
|---|---|---|---|---|---|---|---|
| A | 46564 | 36729 | 0 | 0 | 0.00% | 0.00% |  |
| B | 46564 | 36718 | 0 | 0 | 0.00% | 0.00% |  |
| C | 46563 | 36735 | 0 | 0 | 0.00% | 0.00% |  |
| D | 46564 | 36619 | 0 | 0 | 0.00% | 0.00% |  |
Top three noisy pixels from each quadrant. If the there are fewer than three noisy pixels in the level2.evt file, extra rows are filled as -1
| Pixel properties | Quadrant properties | ||||||
|---|---|---|---|---|---|---|---|
| Quadrant | DetID | PixID | Counts | Sigma | Mean | Median | Sigma |
| A | 0 | 29 | 1947 | 10.59 | 527 | 489 | 137.7 |
| A | 7 | 110 | 1637 | 8.34 | 527 | 489 | 137.7 |
| A | 9 | 19 | 1563 | 7.8 | 527 | 489 | 137.7 |
| B | 2 | 9 | 1729 | 11.64 | 517 | 491 | 106.4 |
| B | 12 | 226 | 1416 | 8.69 | 517 | 491 | 106.4 |
| B | 14 | 254 | 1355 | 8.12 | 517 | 491 | 106.4 |
| C | 1 | 81 | 1472 | 6.76 | 534 | 492 | 145.0 |
| C | 12 | 241 | 1440 | 6.54 | 534 | 492 | 145.0 |
| C | 1 | 80 | 1435 | 6.5 | 534 | 492 | 145.0 |
| D | 6 | 231 | 1280 | 6.46 | 476 | 430 | 131.5 |
| D | 3 | 14 | 1278 | 6.45 | 476 | 430 | 131.5 |
| D | 11 | 82 | 1257 | 6.29 | 476 | 430 | 131.5 |
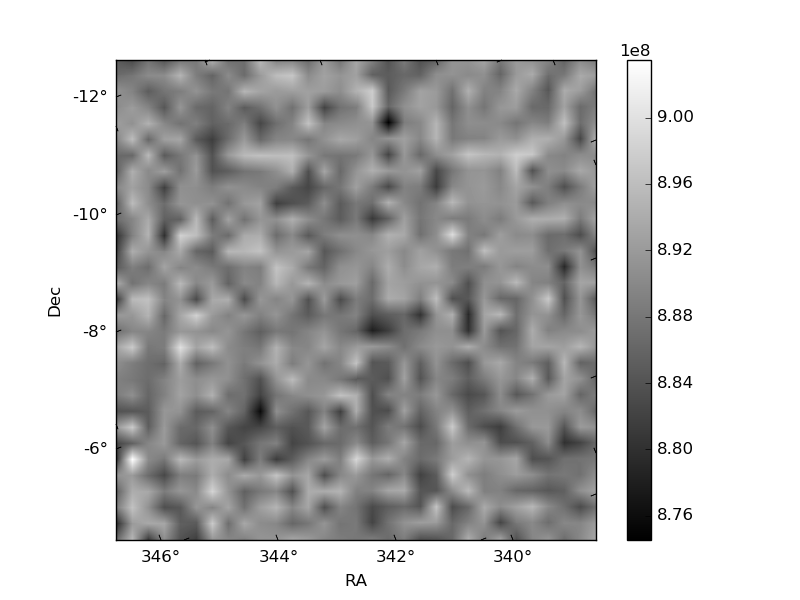
Histogram calculated using DETX and DETY for each event in the final _common_clean file
| Quadrant A |  |
 |
Quadrant B |
|---|---|---|---|
| Quadrant D |  |
 |
Quadrant C |
| Plot type | Count rate plots | Images |
|---|---|---|
| Comparison with Poisson distribution Blue bars denote a histogram of data divided into 1 sec bins. Red curve is a Poisson curve with rate = median count rate of data. |
 |
 |
| Quadrant-wise count rates Data is divided into 100 sec bins |
 |
|
| Module-wise count rates for Quadrant A Data is divided into 100 sec bins |
 |
 |
| Module-wise count rates for Quadrant B Data is divided into 100 sec bins |
 |
 |
| Module-wise count rates for Quadrant C Data is divided into 100 sec bins |
 |
 |
| Module-wise count rates for Quadrant D Data is divided into 100 sec bins |
 |
 |
| Parameter | Plot |
|---|---|
| CZT HV Monitor |  |
| D_VDD |  |
| Temperature 1 |  |
| Veto HV Monitor |  |
| Veto LLD | 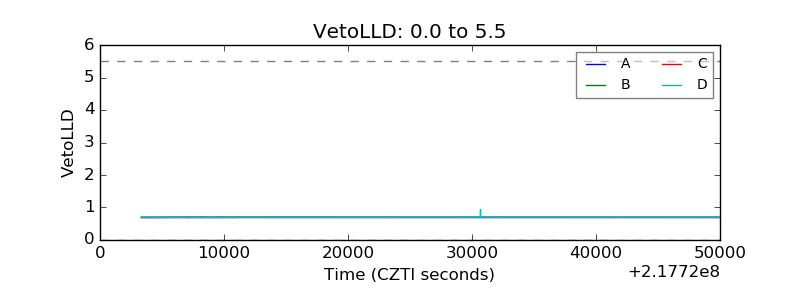 |
| Alpha Counter |  |
| _CPM_Rate |  |
| CZT Counter |  |
| +2.5 Volts monitor |  |
| +5 Volts monitor |  |
| _ROLL_ROT | 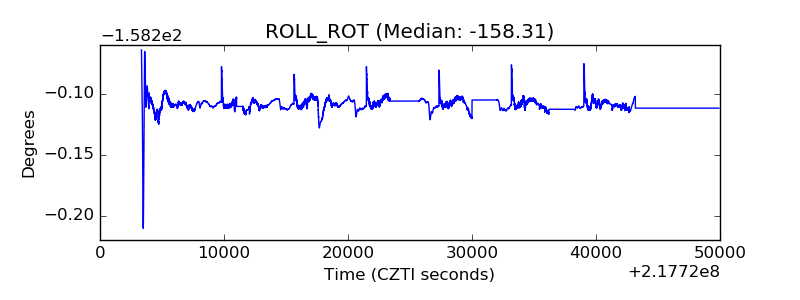 |
| _Roll_DEC |  |
| _Roll_RA |  |
| Veto Counter |  |