| Param | Original file | Final file |
|---|---|---|
| Filename | modeM0/AS1C02_018T02_9000000824_06275cztM0_level2.evt | modeM0/AS1C02_018T02_9000000824_06275cztM0_level2_quad_clean.evt |
| Size (bytes) | 1,159,329,600 | 168,030,720 |
| Size | 1.1 GB | 160.2 MB |
| Events in quadrant A | 9,203,441 | 1,012,084 |
| Events in quadrant B | 8,068,234 | 1,031,214 |
| Events in quadrant C | 6,496,484 | 1,053,022 |
| Events in quadrant D | 10,357,630 | 985,660 |
| Mode M9 | |||
|---|---|---|---|
| Quadrant | BADHDUFLAG | Total packets | Discarded packets |
| A | 0 | 17 | 0 |
| B | 0 | 17 | 0 |
| C | 0 | 17 | 0 |
| D | 0 | 17 | 0 |
| Mode M0 | |||
|---|---|---|---|
| Quadrant | BADHDUFLAG | Total packets | Discarded packets |
| A | 0 | 36611 | 4 |
| B | 0 | 33612 | 3 |
| C | 0 | 29699 | 3 |
| D | 0 | 40633 | 3 |
| Mode SS | |||
|---|---|---|---|
| Quadrant | BADHDUFLAG | Total packets | Discarded packets |
| A | 0 | 296 | 0 |
| B | 0 | 296 | 0 |
| C | 0 | 296 | 0 |
| D | 0 | 296 | 0 |
| Quadrant | Total seconds | Saturated seconds | Saturation percentage |
|---|---|---|---|
| A | 14588 | 255 | 1.748012% |
| B | 14588 | 349 | 2.392377% |
| C | 14588 | 90 | 0.616945% |
| D | 14588 | 630 | 4.318618% |
Noise dominated data is calculated using 1-second bins in cleaned event files. If a bin has >2000 counts, and if more than 50% of those come from <1% of pixels, then it is considered to be noise-dominated and hence unusable.
| Quadrant | # 1 sec bins | Bins with >0 counts | Bins with >2000 counts | High rate bins dominated by noise | Noise dominated (total time) | Noise dominated (detector-on time) | Marked lightcurve |
|---|---|---|---|---|---|---|---|
| A | 16253 | 14589 | 38 | 38 | 0.23% | 0.26% | 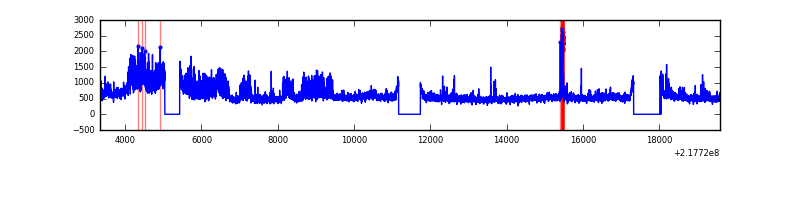 |
| B | 16253 | 14589 | 156 | 156 | 0.96% | 1.07% | 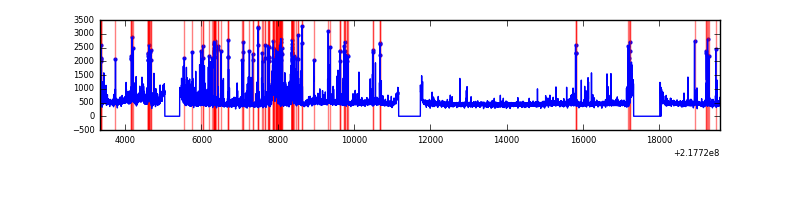 |
| C | 16253 | 14591 | 0 | 0 | 0.00% | 0.00% | 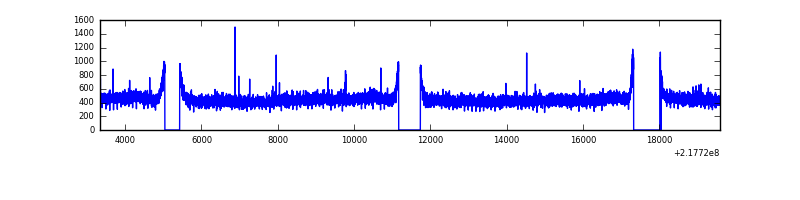 |
| D | 16253 | 14589 | 520 | 520 | 3.20% | 3.56% |  |
Top three noisy pixels from each quadrant. If the there are fewer than three noisy pixels in the level2.evt file, extra rows are filled as -1
| Pixel properties | Quadrant properties | ||||||
|---|---|---|---|---|---|---|---|
| Quadrant | DetID | PixID | Counts | Sigma | Mean | Median | Sigma |
| A | 8 | 15 | 1938564 | 5608.26 | 1686 | 1644 | 345.4 |
| A | 15 | 236 | 519117 | 1498.32 | 1686 | 1644 | 345.4 |
| A | 13 | 251 | 220986 | 635.09 | 1686 | 1644 | 345.4 |
| B | 3 | 64 | 715361 | 2159.09 | 1707 | 1667 | 330.6 |
| B | 0 | 219 | 269695 | 810.85 | 1707 | 1667 | 330.6 |
| B | 4 | 81 | 267397 | 803.89 | 1707 | 1667 | 330.6 |
| C | 8 | 128 | 14245 | 32.78 | 1654 | 1664 | 383.8 |
| C | 13 | 61 | 13380 | 30.53 | 1654 | 1664 | 383.8 |
| C | 9 | 54 | 11708 | 26.17 | 1654 | 1664 | 383.8 |
| D | 12 | 220 | 2558843 | 6358.43 | 1631 | 1582 | 402.2 |
| D | 12 | 221 | 353662 | 875.42 | 1631 | 1582 | 402.2 |
| D | 2 | 152 | 352191 | 871.76 | 1631 | 1582 | 402.2 |
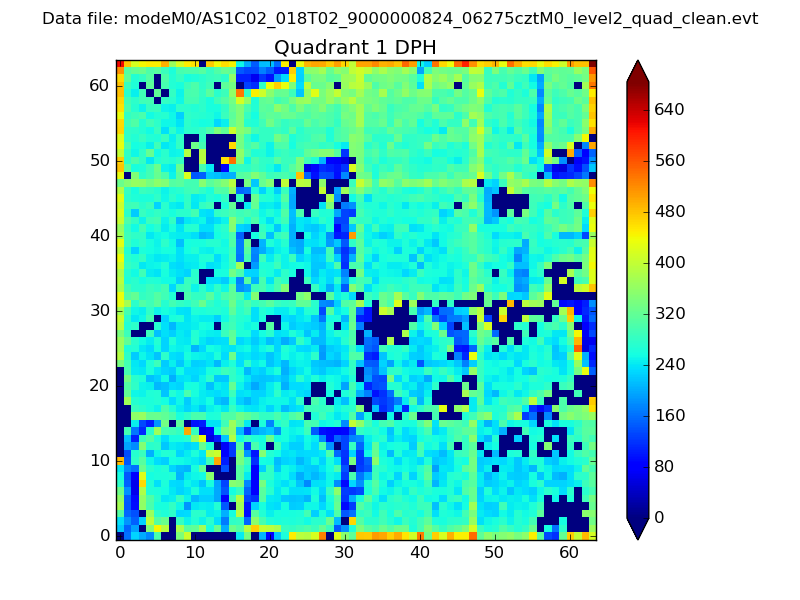
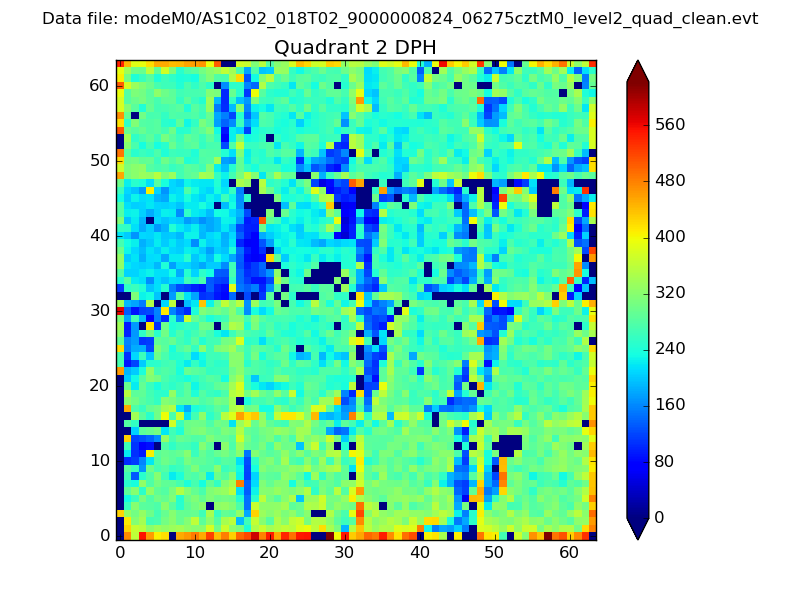
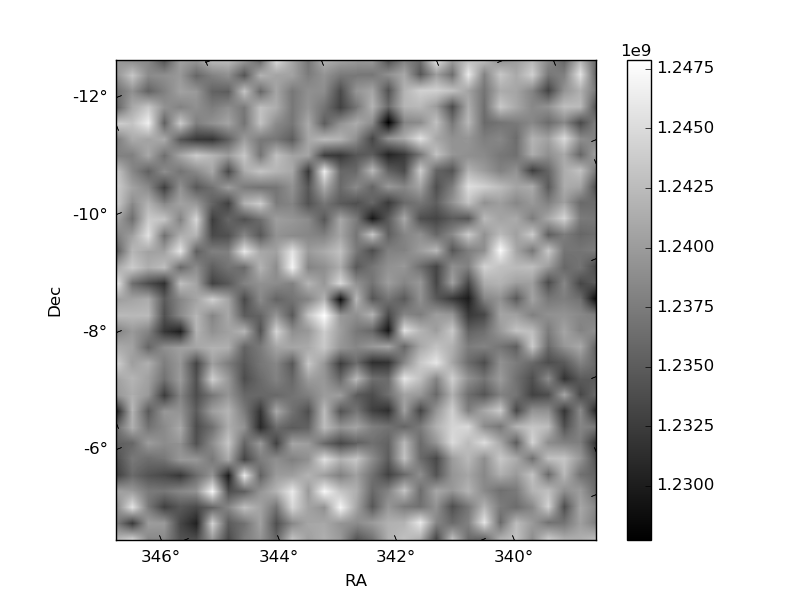
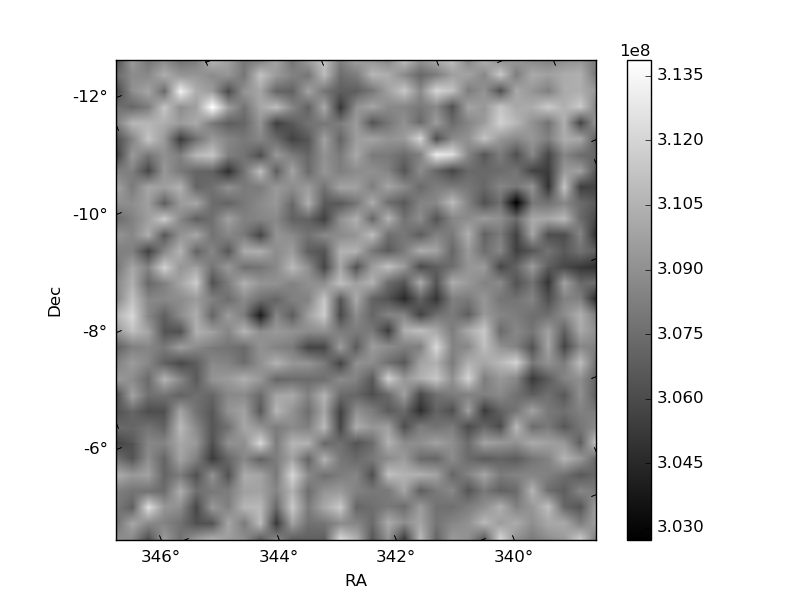
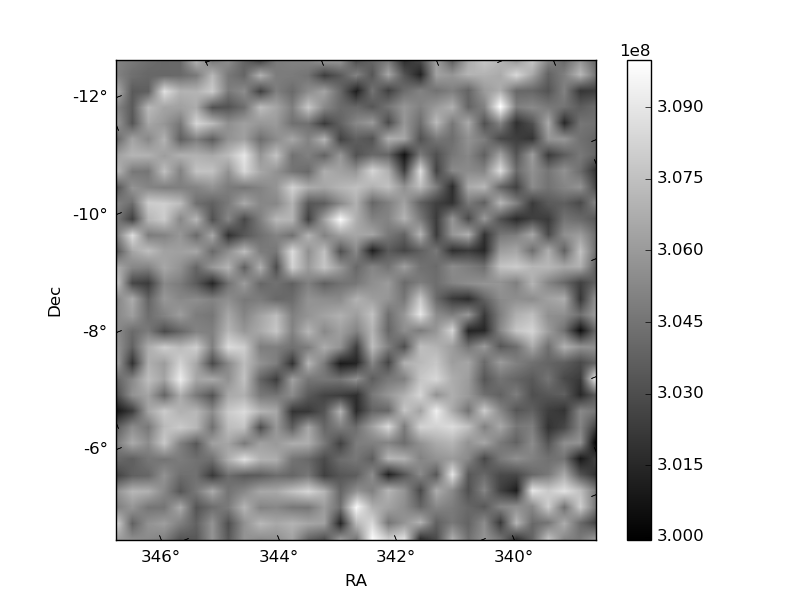
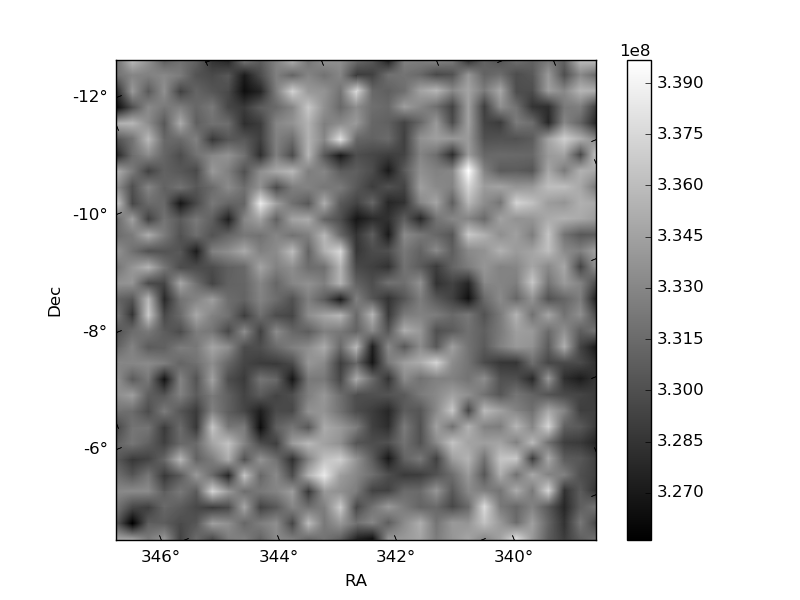
Histogram calculated using DETX and DETY for each event in the final _common_clean file
| Quadrant A | 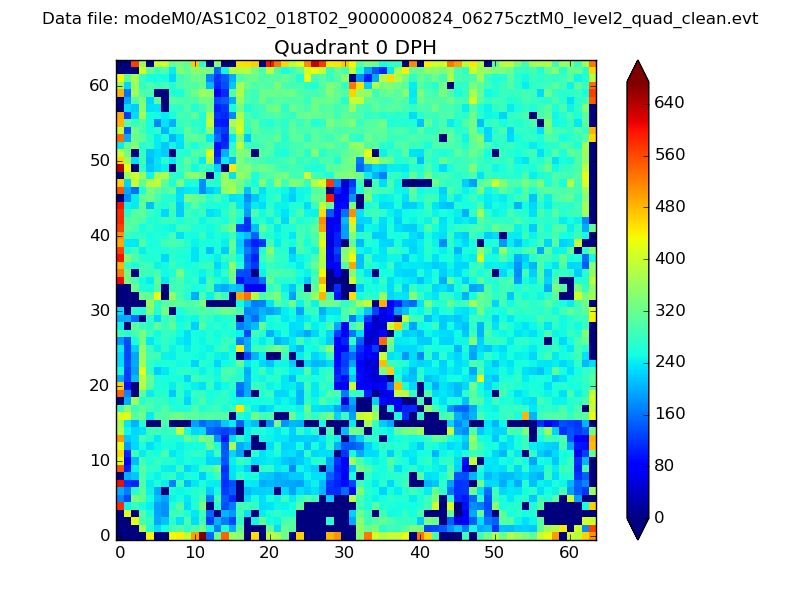 |
 |
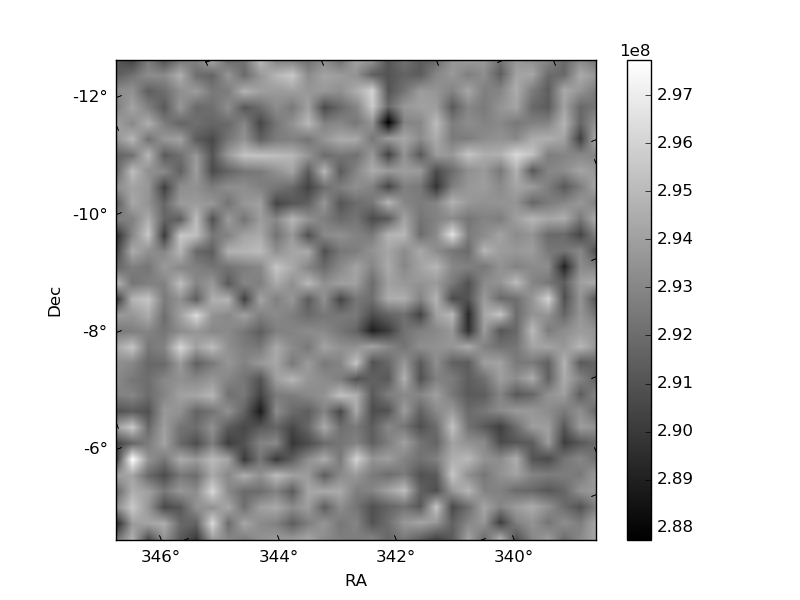
Quadrant B |
|---|---|---|---|
| Quadrant D | 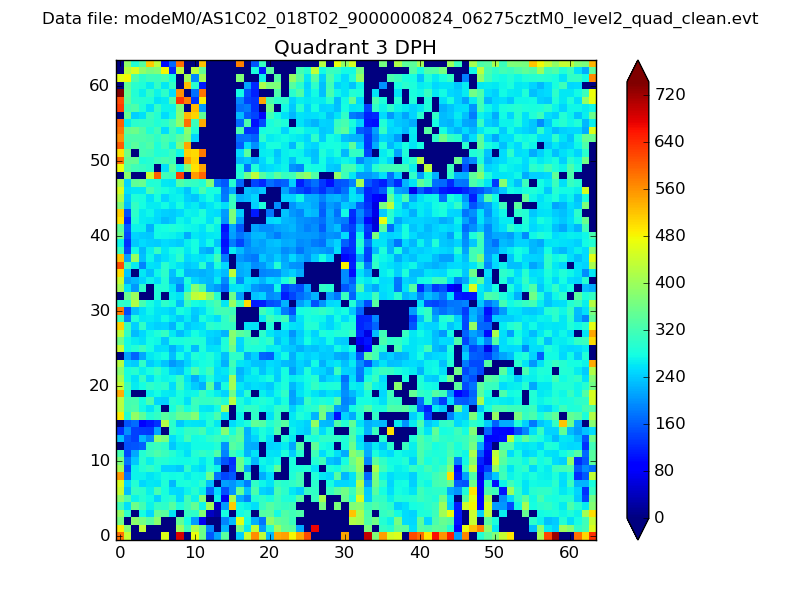 |
 |
Quadrant C |
| Plot type | Count rate plots | Images |
|---|---|---|
| Comparison with Poisson distribution Blue bars denote a histogram of data divided into 1 sec bins. Red curve is a Poisson curve with rate = median count rate of data. |
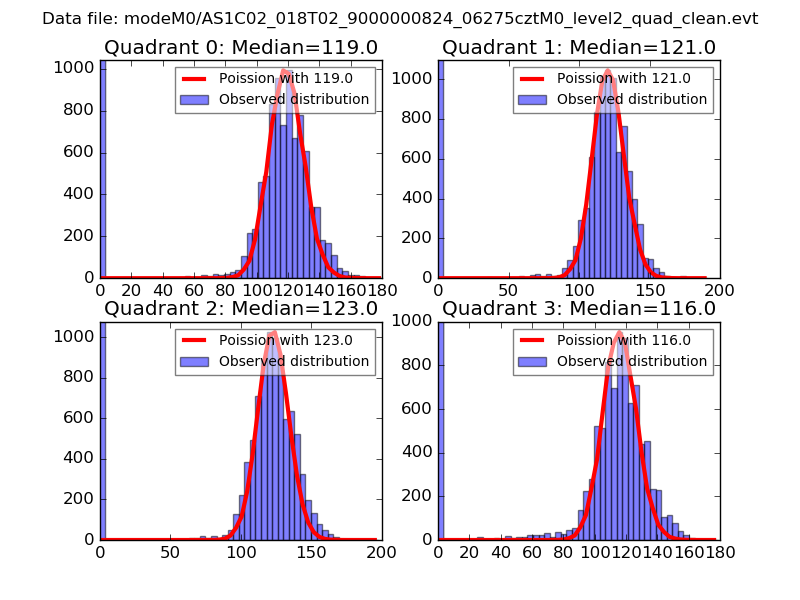 |
 |
| Quadrant-wise count rates Data is divided into 100 sec bins |
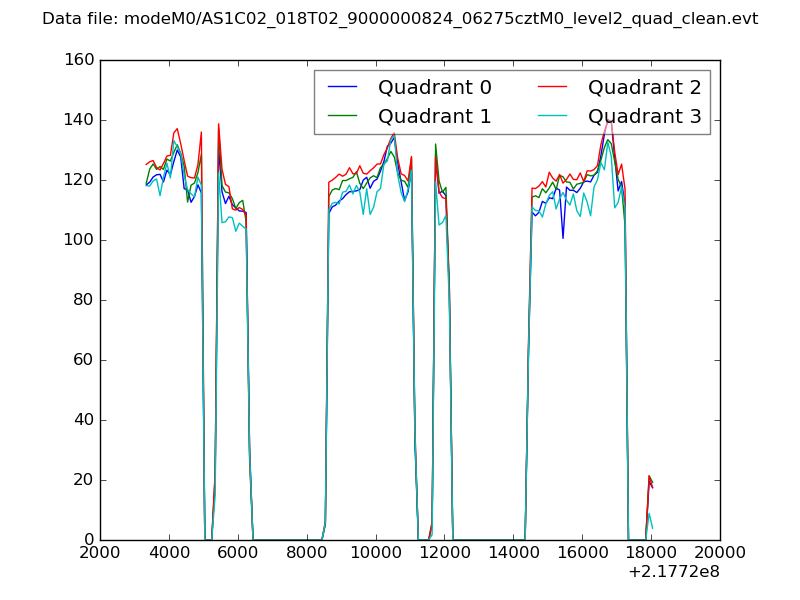 |
|
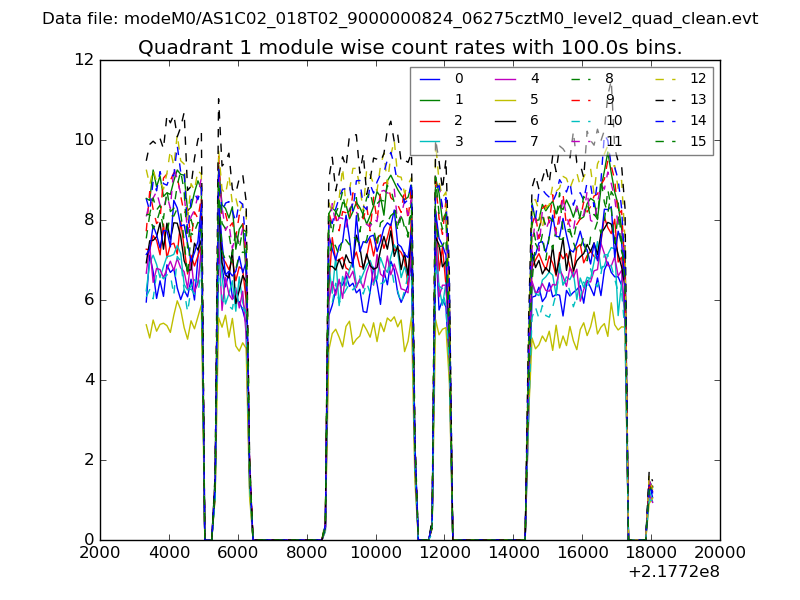
| Module-wise count rates for Quadrant A Data is divided into 100 sec bins |
 |
 |
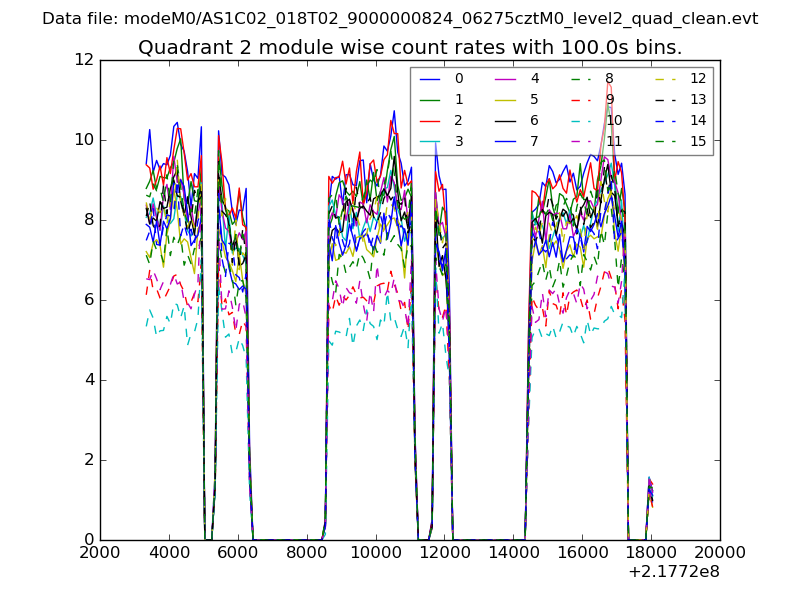
| Module-wise count rates for Quadrant B Data is divided into 100 sec bins |
 |
 |
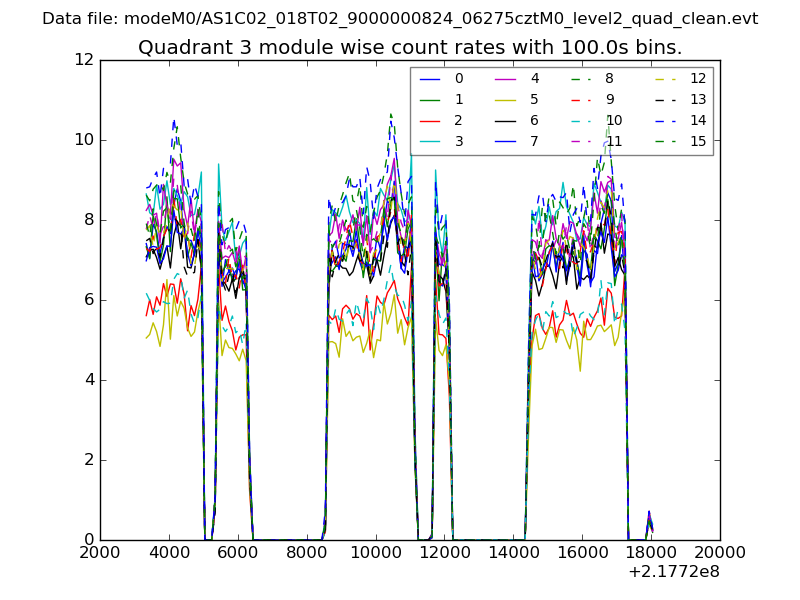
| Module-wise count rates for Quadrant C Data is divided into 100 sec bins |
 |
 |
| Module-wise count rates for Quadrant D Data is divided into 100 sec bins |
 |
 |
| Parameter | Plot |
|---|---|
| CZT HV Monitor | 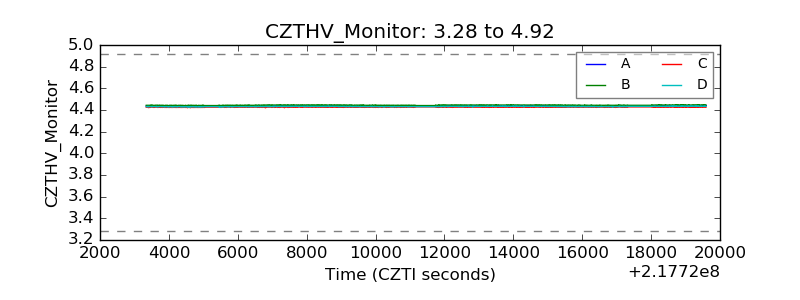 |
| D_VDD | 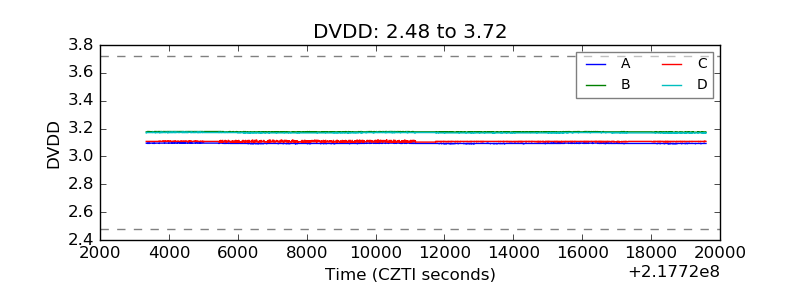 |
| Temperature 1 | 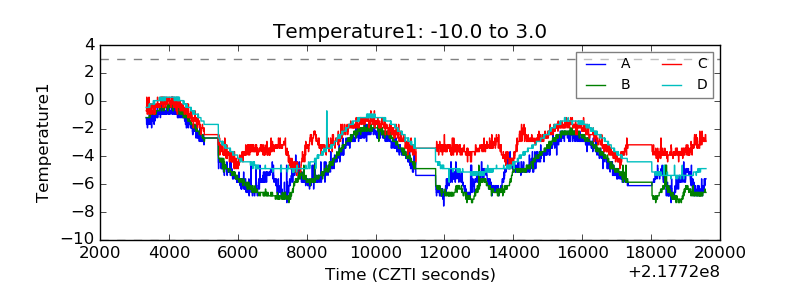 |
| Veto HV Monitor | 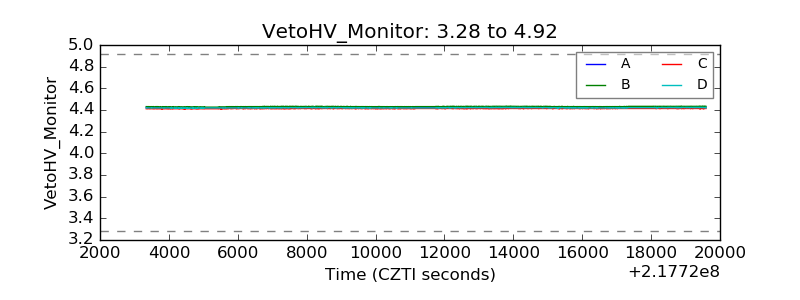 |
| Veto LLD |  |
| Alpha Counter | 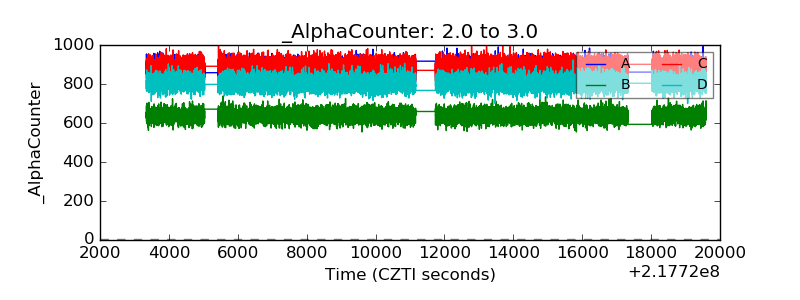 |
| _CPM_Rate | 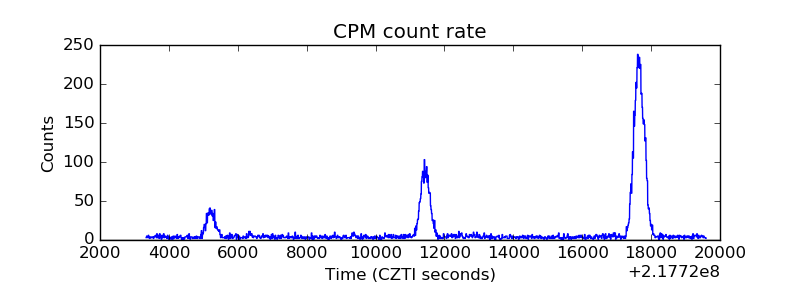 |
| CZT Counter | 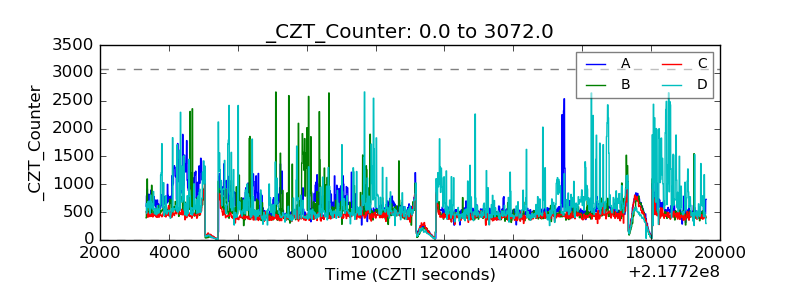 |
| +2.5 Volts monitor |  |
| +5 Volts monitor | 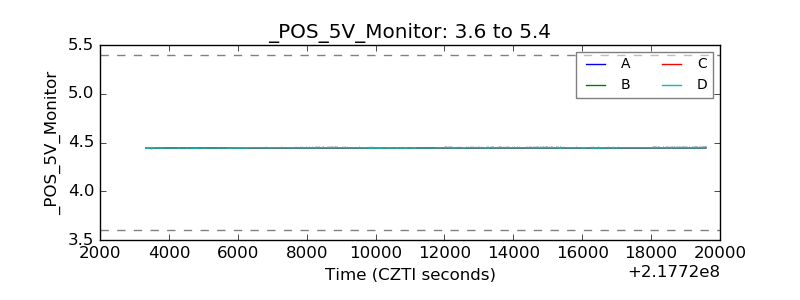 |
| _ROLL_ROT | 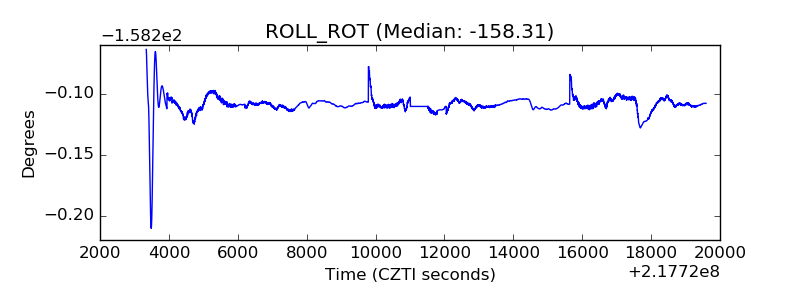 |
| _Roll_DEC | 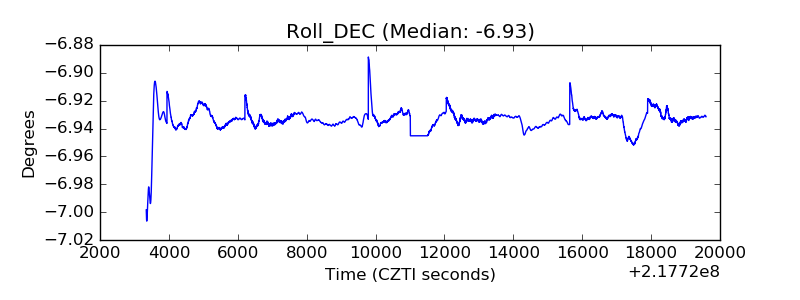 |
| _Roll_RA | 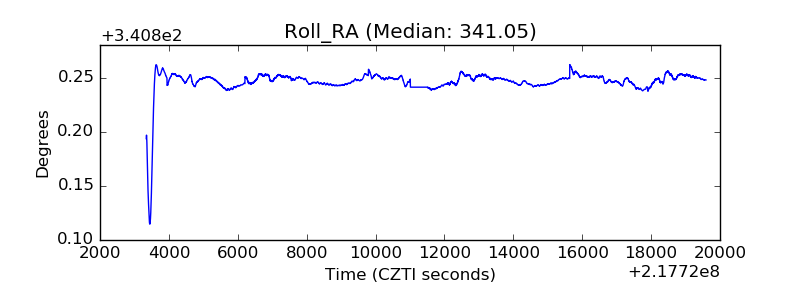 |
| Veto Counter | 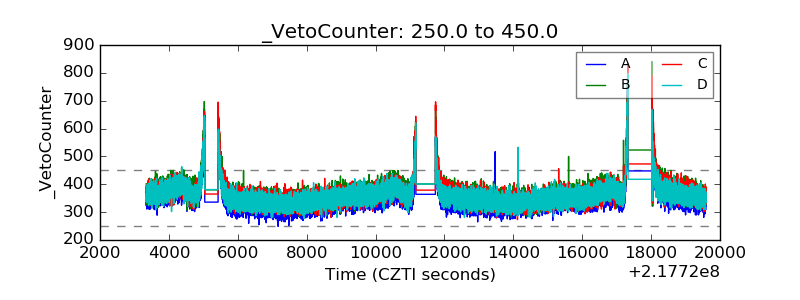 |