| Param | Original file | Final file |
|---|---|---|
| Filename | modeM0/AS1C02_018T02_9000000824_06276cztM0_level2.evt | modeM0/AS1C02_018T02_9000000824_06276cztM0_level2_quad_clean.evt |
| Size (bytes) | 585,236,160 | 68,417,280 |
| Size | 558.1 MB | 65.2 MB |
| Events in quadrant A | 3,977,298 | 400,527 |
| Events in quadrant B | 3,697,442 | 404,325 |
| Events in quadrant C | 3,212,135 | 410,619 |
| Events in quadrant D | 6,364,906 | 370,234 |
| Mode M9 | |||
|---|---|---|---|
| Quadrant | BADHDUFLAG | Total packets | Discarded packets |
| A | 0 | 16 | 0 |
| B | 0 | 16 | 0 |
| C | 0 | 16 | 0 |
| D | 0 | 16 | 0 |
| Mode M0 | |||
|---|---|---|---|
| Quadrant | BADHDUFLAG | Total packets | Discarded packets |
| A | 0 | 16106 | 3 |
| B | 0 | 15577 | 2 |
| C | 0 | 14397 | 2 |
| D | 0 | 23694 | 2 |
| Mode SS | |||
|---|---|---|---|
| Quadrant | BADHDUFLAG | Total packets | Discarded packets |
| A | 0 | 142 | 0 |
| B | 0 | 142 | 0 |
| C | 0 | 142 | 0 |
| D | 0 | 142 | 0 |
| Quadrant | Total seconds | Saturated seconds | Saturation percentage |
|---|---|---|---|
| A | 6973 | 101 | 1.448444% |
| B | 6973 | 205 | 2.939911% |
| C | 6973 | 82 | 1.175964% |
| D | 6973 | 703 | 10.081744% |
Noise dominated data is calculated using 1-second bins in cleaned event files. If a bin has >2000 counts, and if more than 50% of those come from <1% of pixels, then it is considered to be noise-dominated and hence unusable.
| Quadrant | # 1 sec bins | Bins with >0 counts | Bins with >2000 counts | High rate bins dominated by noise | Noise dominated (total time) | Noise dominated (detector-on time) | Marked lightcurve |
|---|---|---|---|---|---|---|---|
| A | 8553 | 6974 | 1 | 1 | 0.01% | 0.01% | 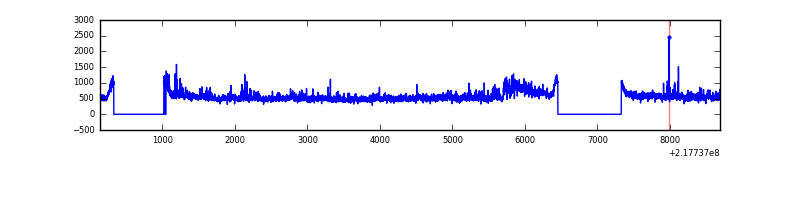 |
| B | 8553 | 6974 | 72 | 72 | 0.84% | 1.03% | 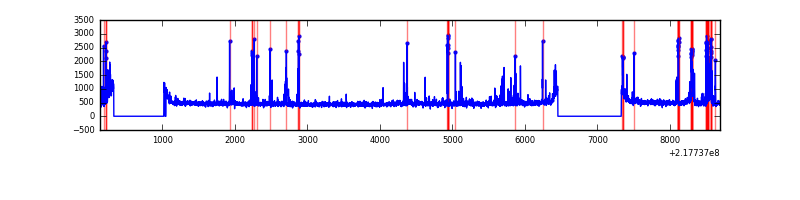 |
| C | 8553 | 6974 | 0 | 0 | 0.00% | 0.00% | 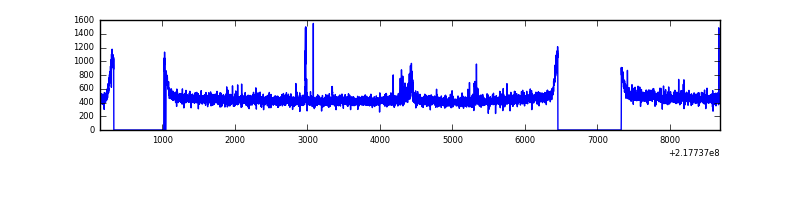 |
| D | 8553 | 6973 | 635 | 635 | 7.42% | 9.11% |  |
Top three noisy pixels from each quadrant. If the there are fewer than three noisy pixels in the level2.evt file, extra rows are filled as -1
| Pixel properties | Quadrant properties | ||||||
|---|---|---|---|---|---|---|---|
| Quadrant | DetID | PixID | Counts | Sigma | Mean | Median | Sigma |
| A | 8 | 15 | 461594 | 2723.86 | 823 | 806 | 169.2 |
| A | 15 | 236 | 268475 | 1582.27 | 823 | 806 | 169.2 |
| A | 13 | 251 | 67107 | 391.93 | 823 | 806 | 169.2 |
| B | 3 | 64 | 356255 | 2203.75 | 830 | 810 | 161.3 |
| B | 0 | 219 | 101728 | 625.69 | 830 | 810 | 161.3 |
| B | 12 | 111 | 16275 | 95.88 | 830 | 810 | 161.3 |
| C | 9 | 54 | 53942 | 281.58 | 808 | 811 | 188.7 |
| C | 13 | 61 | 6466 | 29.97 | 808 | 811 | 188.7 |
| C | 1 | 16 | 3531 | 14.42 | 808 | 811 | 188.7 |
| D | 12 | 220 | 2384915 | 12399.76 | 777 | 753 | 192.3 |
| D | 12 | 221 | 431860 | 2242.14 | 777 | 753 | 192.3 |
| D | 12 | 110 | 179861 | 931.52 | 777 | 753 | 192.3 |
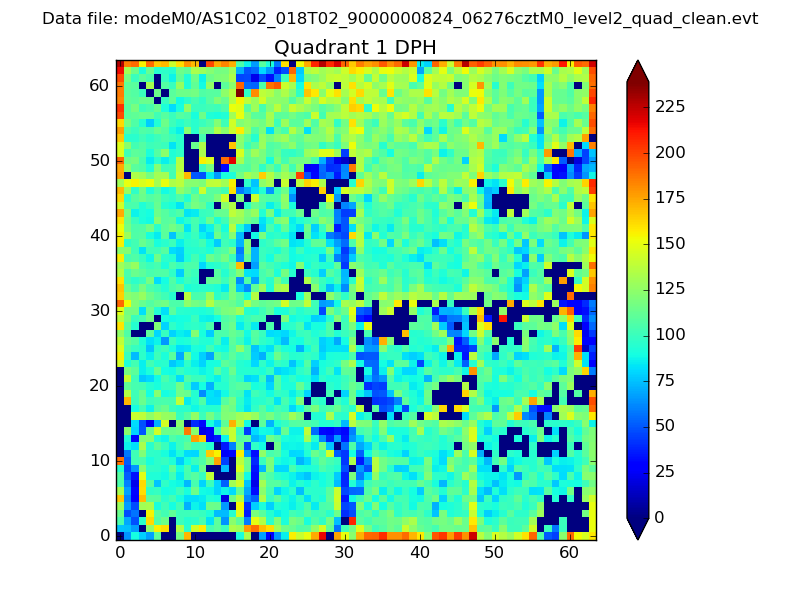
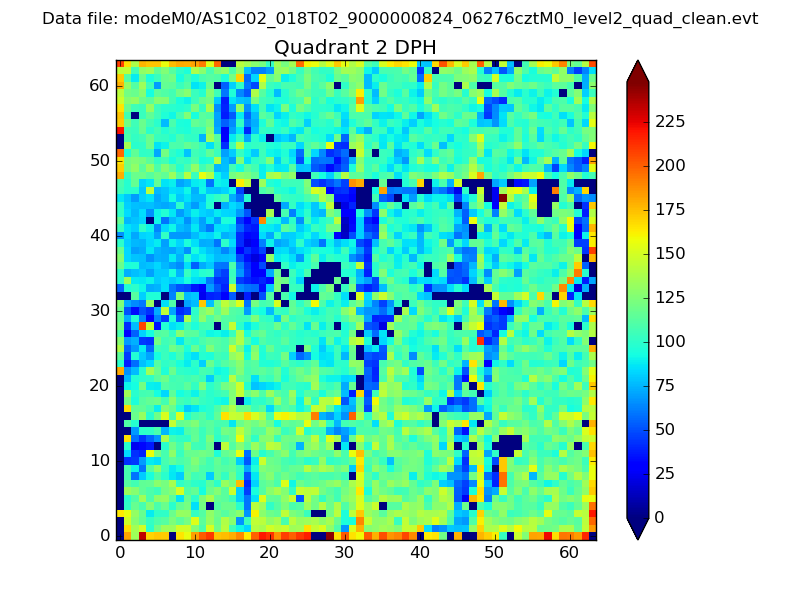
Histogram calculated using DETX and DETY for each event in the final _common_clean file
| Quadrant A | 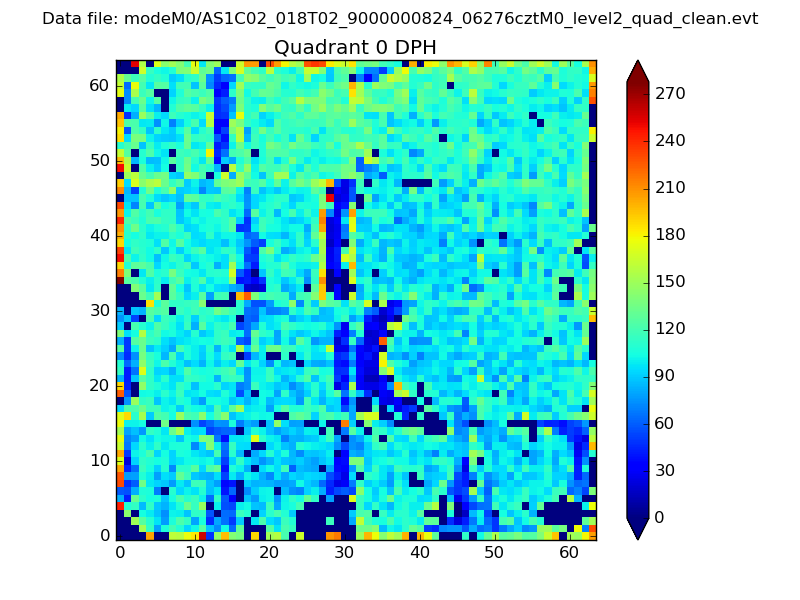 |
 |
Quadrant B |
|---|---|---|---|
| Quadrant D | 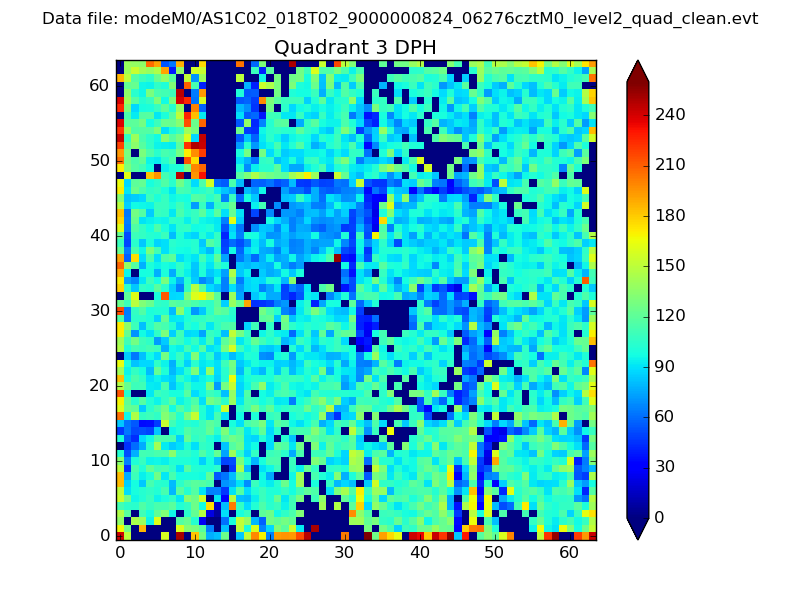 |
 |
Quadrant C |
| Plot type | Count rate plots | Images |
|---|---|---|
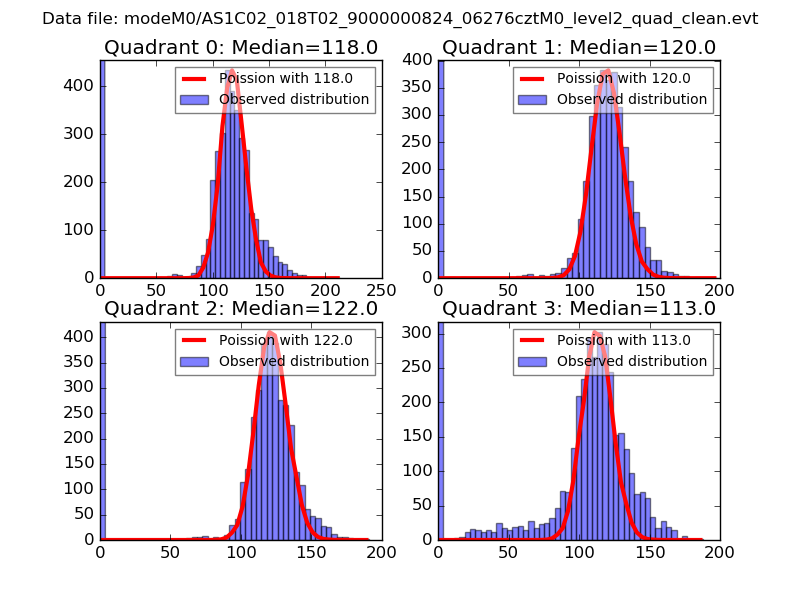
| Comparison with Poisson distribution Blue bars denote a histogram of data divided into 1 sec bins. Red curve is a Poisson curve with rate = median count rate of data. |
 |
 |
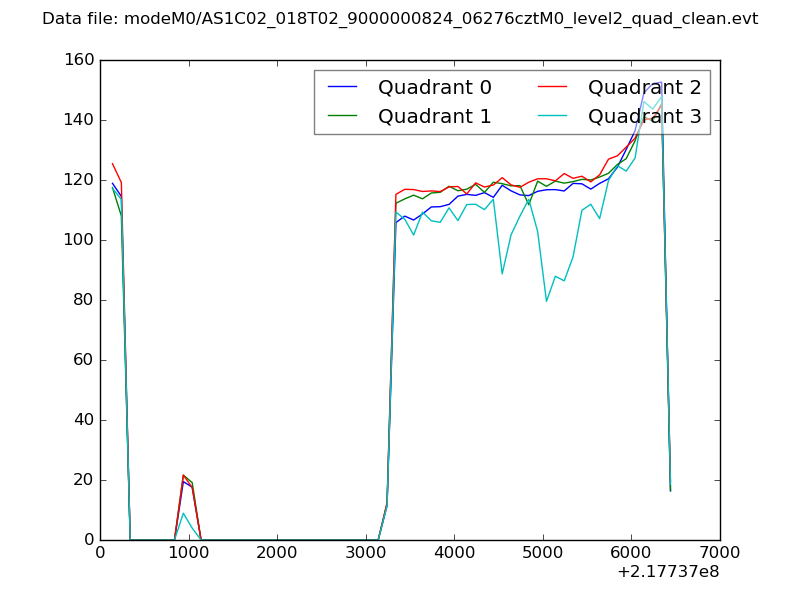
| Quadrant-wise count rates Data is divided into 100 sec bins |
 |
|
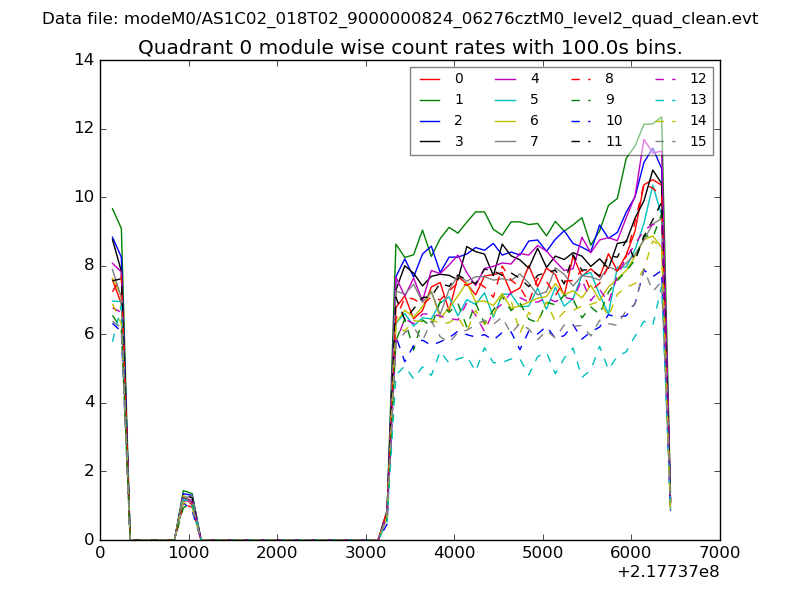
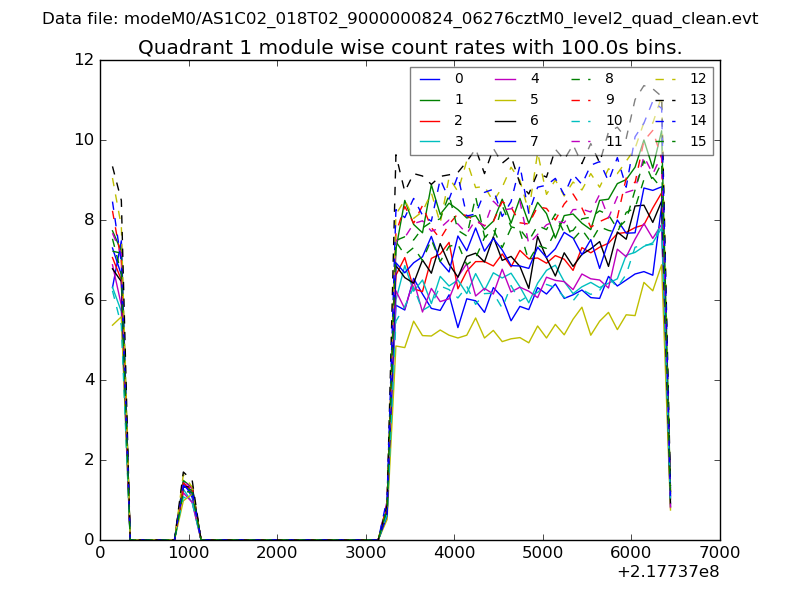
| Module-wise count rates for Quadrant A Data is divided into 100 sec bins |
 |
 |
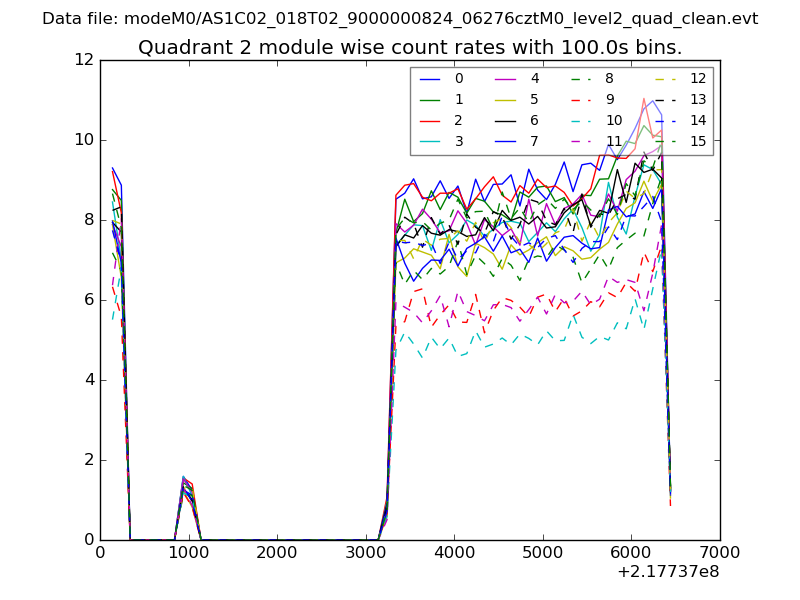
| Module-wise count rates for Quadrant B Data is divided into 100 sec bins |
 |
 |
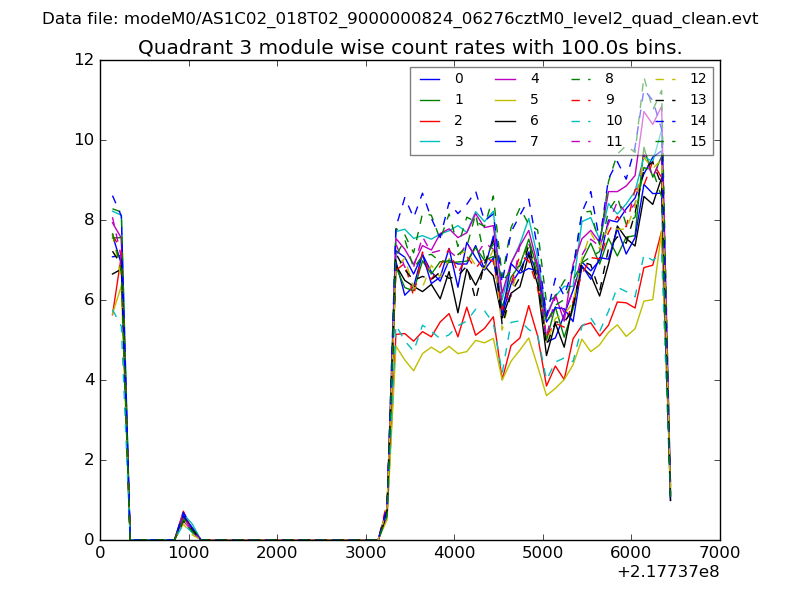
| Module-wise count rates for Quadrant C Data is divided into 100 sec bins |
 |
 |
| Module-wise count rates for Quadrant D Data is divided into 100 sec bins |
 |
 |
| Parameter | Plot |
|---|---|
| CZT HV Monitor | 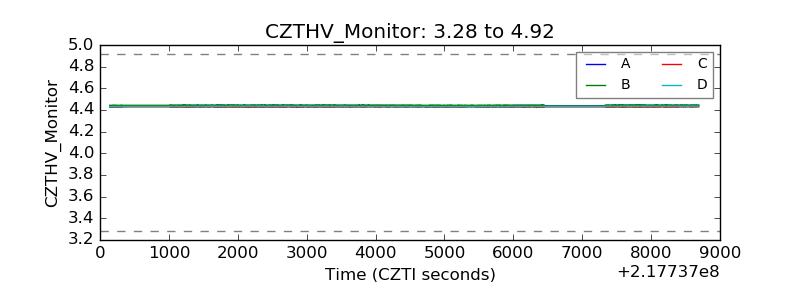 |
| D_VDD | 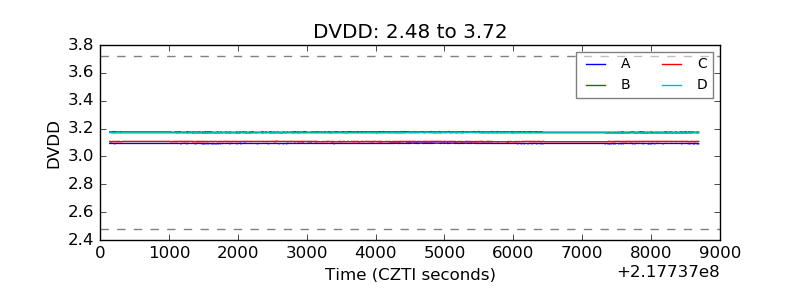 |
| Temperature 1 | 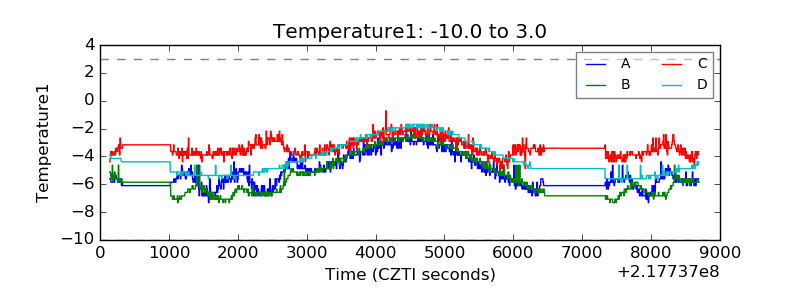 |
| Veto HV Monitor | 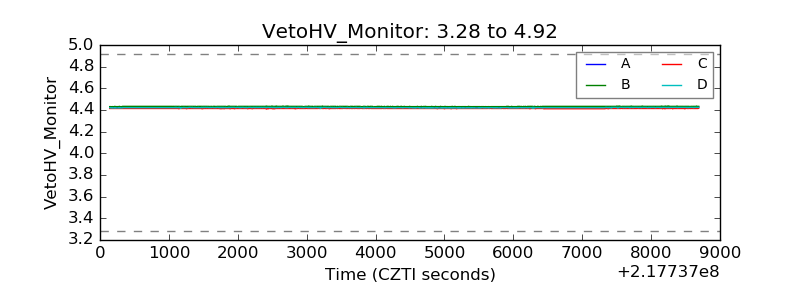 |
| Veto LLD | 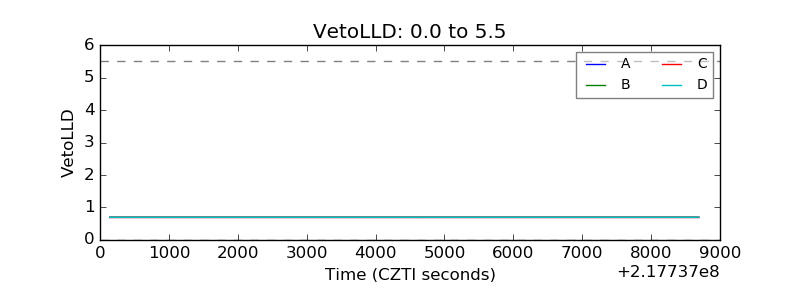 |
| Alpha Counter | 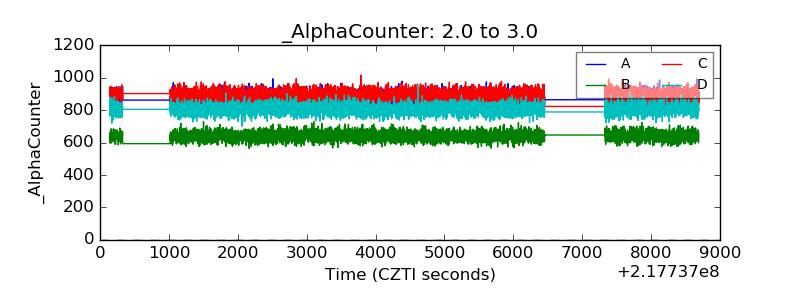 |
| _CPM_Rate | 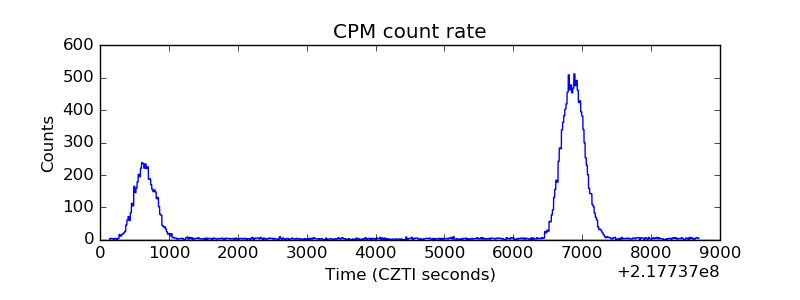 |
| CZT Counter | 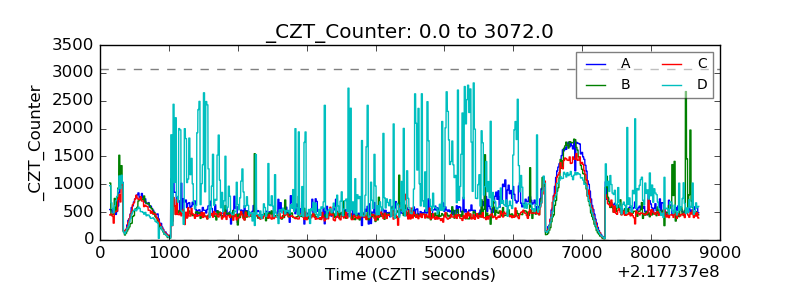 |
| +2.5 Volts monitor |  |
| +5 Volts monitor |  |
| _ROLL_ROT | 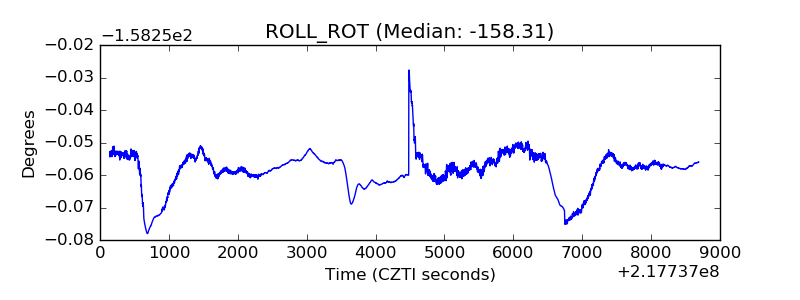 |
| _Roll_DEC | 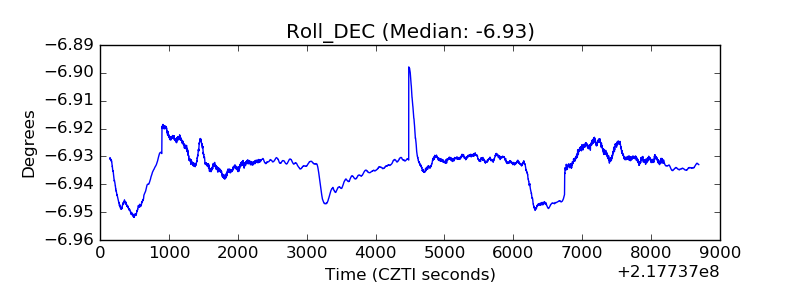 |
| _Roll_RA | 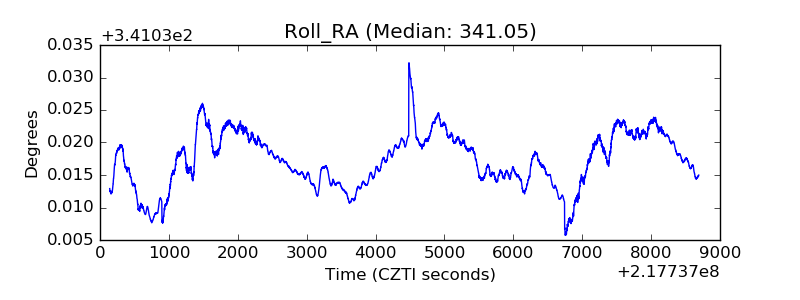 |
| Veto Counter | 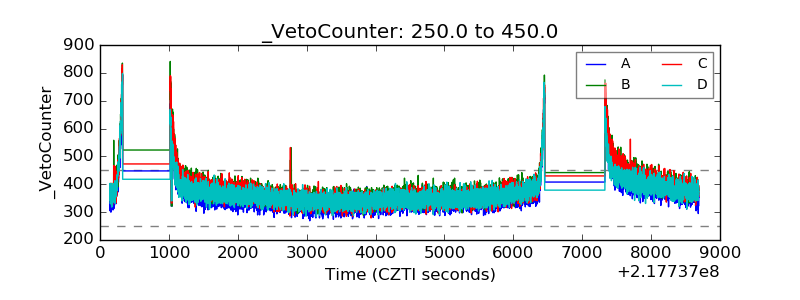 |