| Param | Original file | Final file |
|---|---|---|
| Filename | modeM0/AS1C02_018T02_9000000824_06279cztM0_level2.evt | modeM0/AS1C02_018T02_9000000824_06279cztM0_level2_quad_clean.evt |
| Size (bytes) | 536,100,480 | 77,253,120 |
| Size | 511.3 MB | 73.7 MB |
| Events in quadrant A | 3,647,388 | 473,290 |
| Events in quadrant B | 3,401,921 | 484,085 |
| Events in quadrant C | 3,037,924 | 484,724 |
| Events in quadrant D | 5,709,188 | 444,768 |
| Mode M9 | |||
|---|---|---|---|
| Quadrant | BADHDUFLAG | Total packets | Discarded packets |
| A | 0 | 18 | 0 |
| B | 0 | 18 | 0 |
| C | 0 | 18 | 0 |
| D | 0 | 19 | 0 |
| Mode M0 | |||
|---|---|---|---|
| Quadrant | BADHDUFLAG | Total packets | Discarded packets |
| A | 0 | 14871 | 3 |
| B | 0 | 14230 | 2 |
| C | 0 | 13410 | 2 |
| D | 0 | 21433 | 2 |
| Mode SS | |||
|---|---|---|---|
| Quadrant | BADHDUFLAG | Total packets | Discarded packets |
| A | 0 | 130 | 0 |
| B | 0 | 130 | 0 |
| C | 0 | 130 | 0 |
| D | 0 | 130 | 0 |
| Quadrant | Total seconds | Saturated seconds | Saturation percentage |
|---|---|---|---|
| A | 6489 | 69 | 1.063338% |
| B | 6489 | 119 | 1.833873% |
| C | 6489 | 43 | 0.662660% |
| D | 6489 | 452 | 6.965634% |
Noise dominated data is calculated using 1-second bins in cleaned event files. If a bin has >2000 counts, and if more than 50% of those come from <1% of pixels, then it is considered to be noise-dominated and hence unusable.
| Quadrant | # 1 sec bins | Bins with >0 counts | Bins with >2000 counts | High rate bins dominated by noise | Noise dominated (total time) | Noise dominated (detector-on time) | Marked lightcurve |
|---|---|---|---|---|---|---|---|
| A | 7629 | 6489 | 2 | 2 | 0.03% | 0.03% | 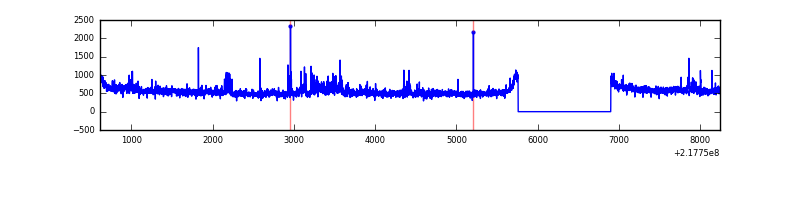 |
| B | 7629 | 6489 | 46 | 46 | 0.60% | 0.71% |  |
| C | 7629 | 6489 | 1 | 1 | 0.01% | 0.02% | 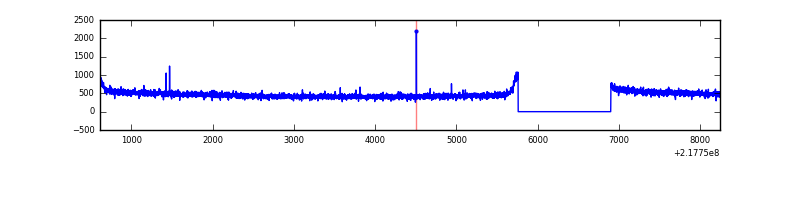 |
| D | 7629 | 6489 | 418 | 418 | 5.48% | 6.44% |  |
Top three noisy pixels from each quadrant. If the there are fewer than three noisy pixels in the level2.evt file, extra rows are filled as -1
| Pixel properties | Quadrant properties | ||||||
|---|---|---|---|---|---|---|---|
| Quadrant | DetID | PixID | Counts | Sigma | Mean | Median | Sigma |
| A | 8 | 15 | 404792 | 2494.95 | 799 | 782 | 161.9 |
| A | 15 | 236 | 100439 | 615.43 | 799 | 782 | 161.9 |
| A | 15 | 174 | 36386 | 219.87 | 799 | 782 | 161.9 |
| B | 3 | 64 | 142876 | 922.11 | 800 | 781 | 154.1 |
| B | 0 | 219 | 126214 | 813.98 | 800 | 781 | 154.1 |
| B | 4 | 81 | 27981 | 176.51 | 800 | 781 | 154.1 |
| C | 9 | 54 | 6657 | 32.76 | 776 | 779 | 179.4 |
| C | 13 | 61 | 6129 | 29.82 | 776 | 779 | 179.4 |
| C | 8 | 222 | 3201 | 13.5 | 776 | 779 | 179.4 |
| D | 12 | 220 | 1679266 | 8974.86 | 760 | 737 | 187.0 |
| D | 12 | 221 | 633959 | 3385.75 | 760 | 737 | 187.0 |
| D | 2 | 152 | 147763 | 786.13 | 760 | 737 | 187.0 |
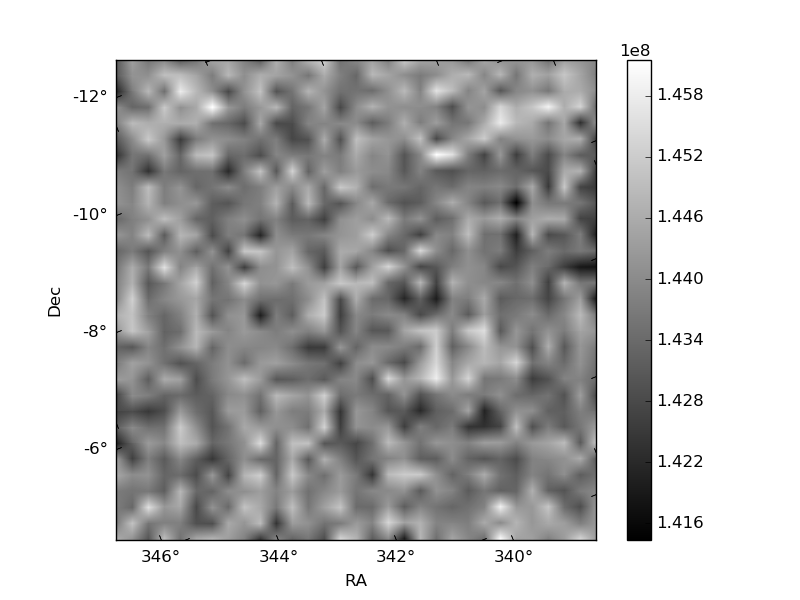
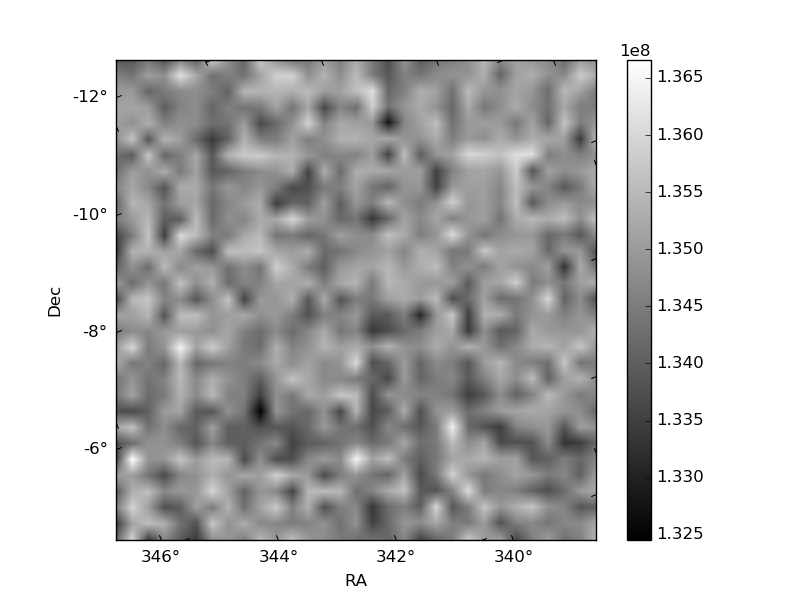
Histogram calculated using DETX and DETY for each event in the final _common_clean file
| Quadrant A | 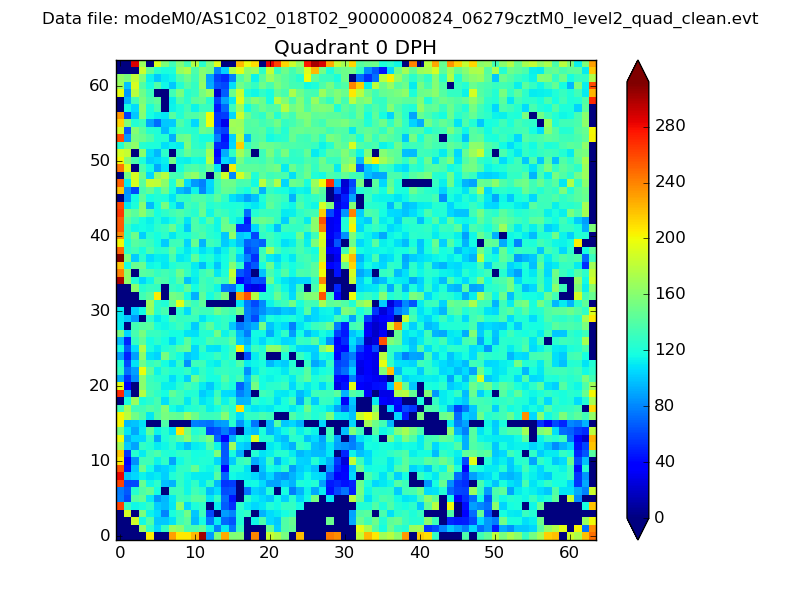 |
 |
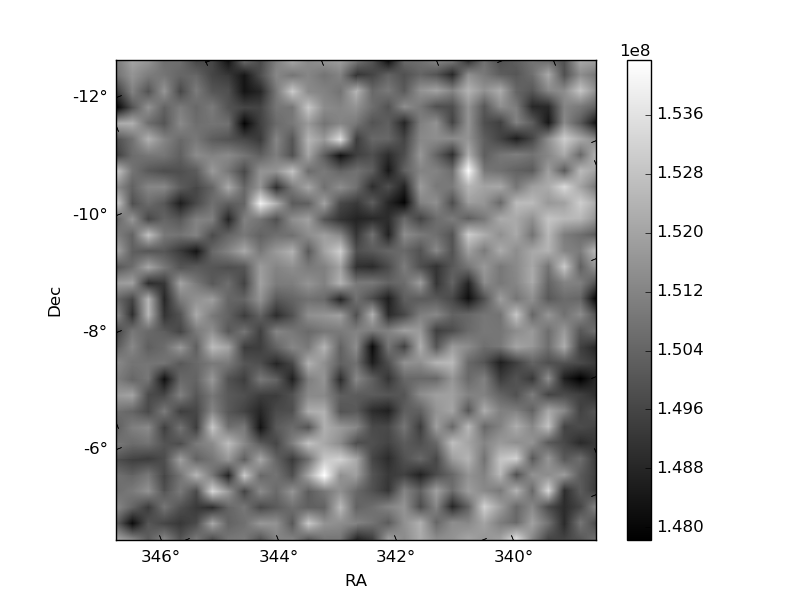
Quadrant B |
|---|---|---|---|
| Quadrant D | 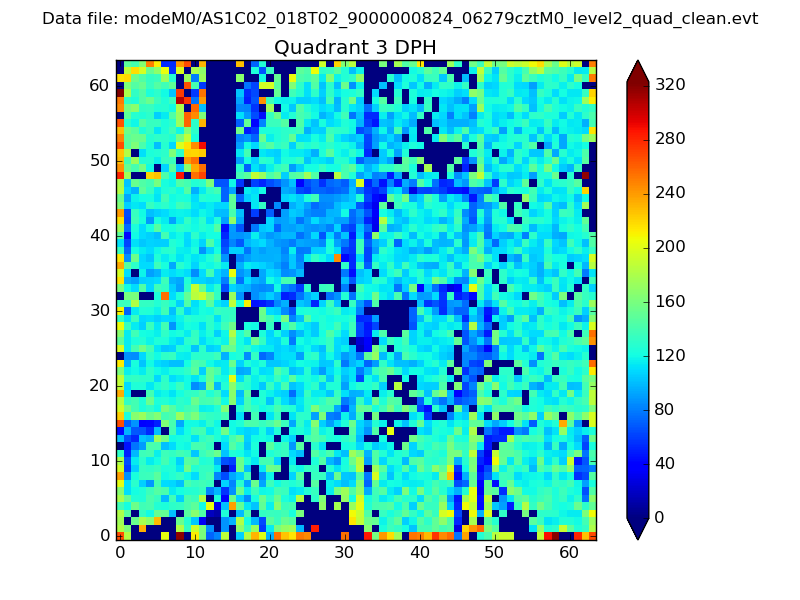 |
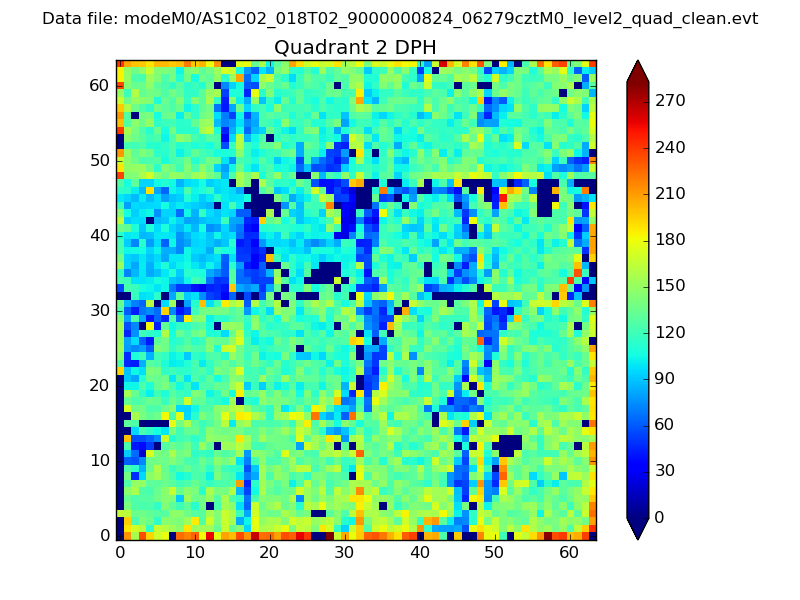 |
Quadrant C |
| Plot type | Count rate plots | Images |
|---|---|---|
| Comparison with Poisson distribution Blue bars denote a histogram of data divided into 1 sec bins. Red curve is a Poisson curve with rate = median count rate of data. |
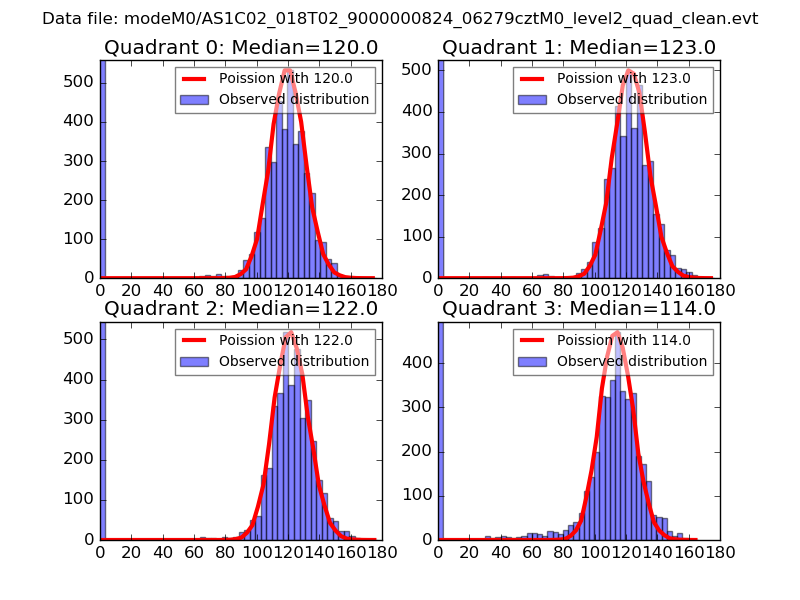 |
 |
| Quadrant-wise count rates Data is divided into 100 sec bins |
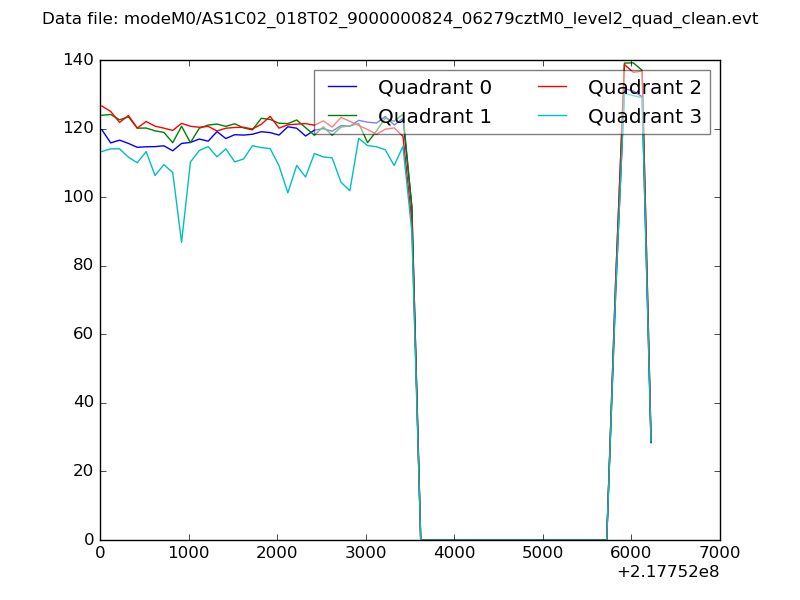 |
|
| Module-wise count rates for Quadrant A Data is divided into 100 sec bins |
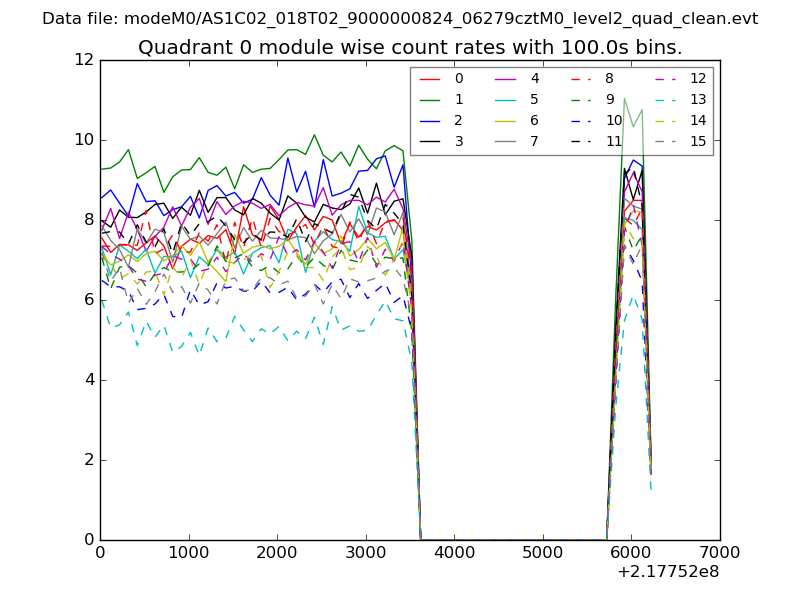 |
 |
| Module-wise count rates for Quadrant B Data is divided into 100 sec bins |
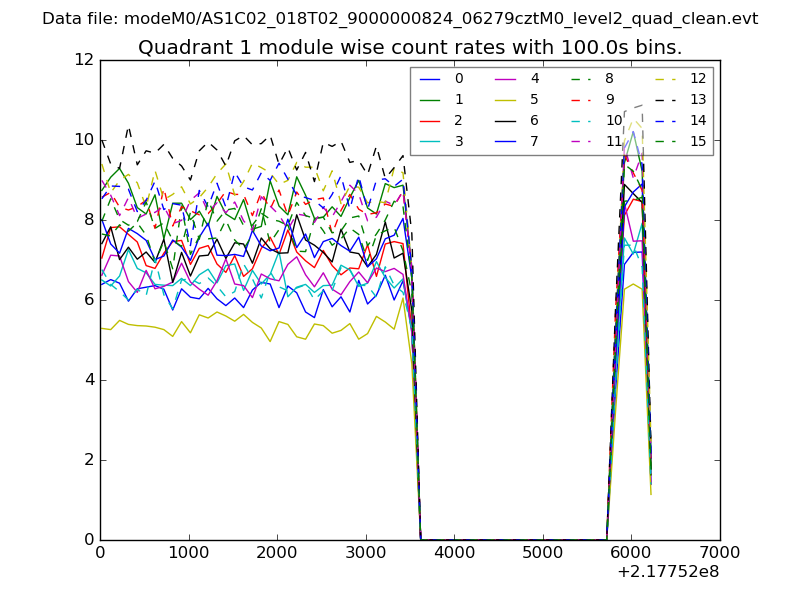 |
 |
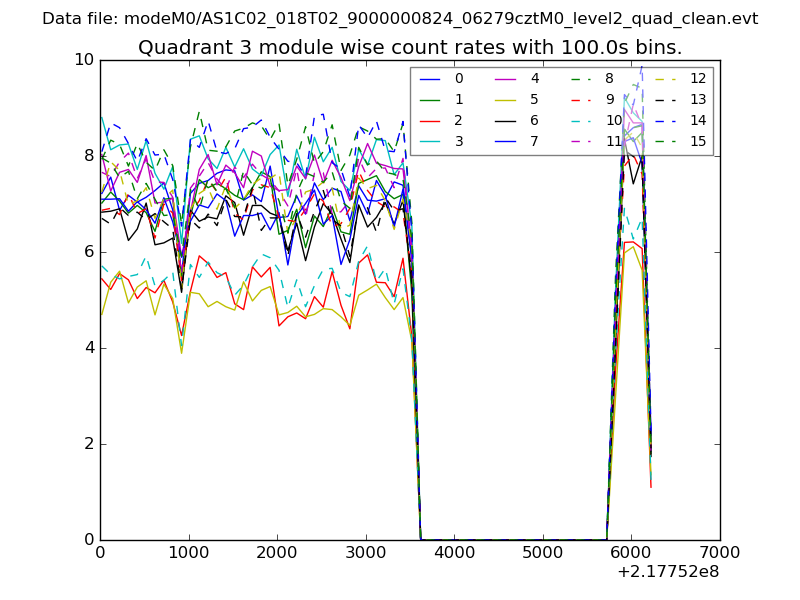
| Module-wise count rates for Quadrant C Data is divided into 100 sec bins |
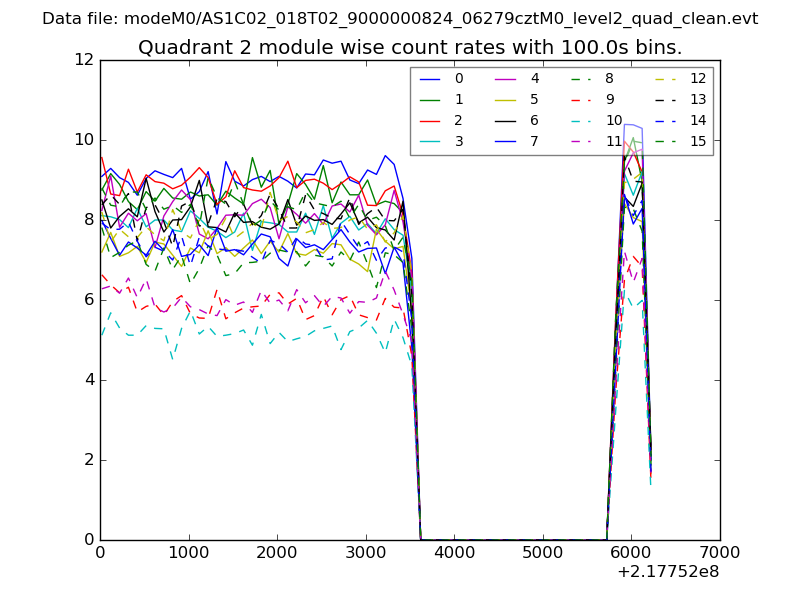 |
 |
| Module-wise count rates for Quadrant D Data is divided into 100 sec bins |
 |
 |
| Parameter | Plot |
|---|---|
| CZT HV Monitor | 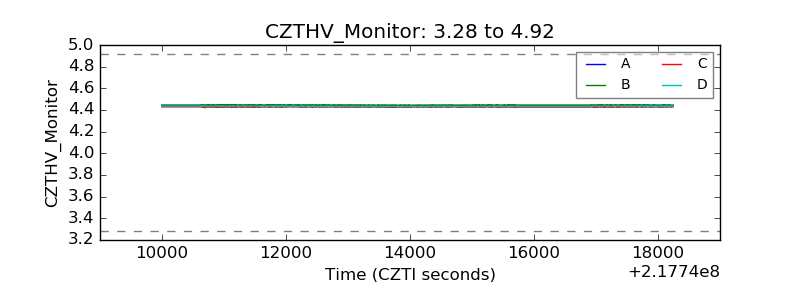 |
| D_VDD | 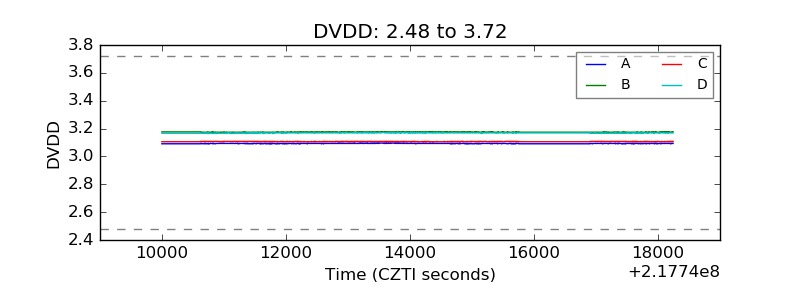 |
| Temperature 1 |  |
| Veto HV Monitor | 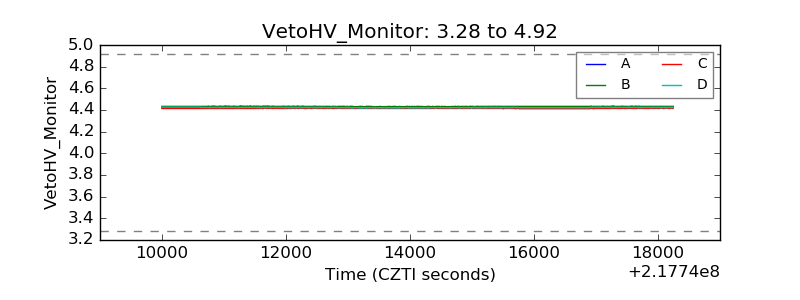 |
| Veto LLD | 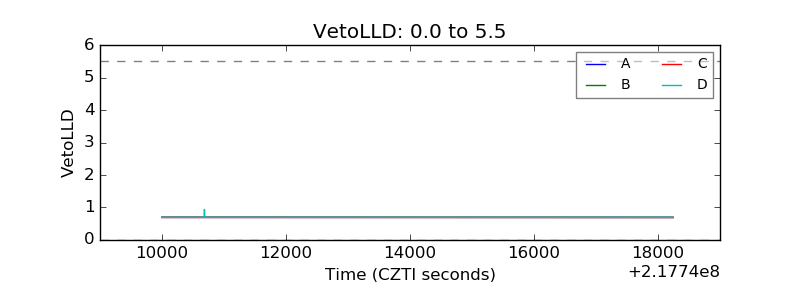 |
| Alpha Counter | 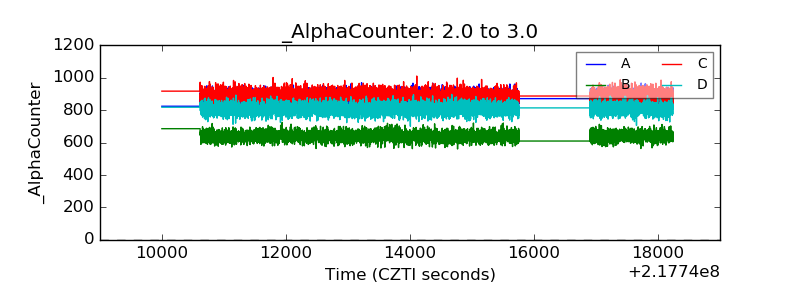 |
| _CPM_Rate | 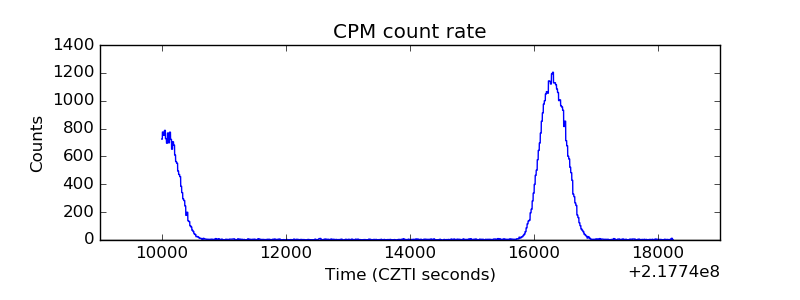 |
| CZT Counter | 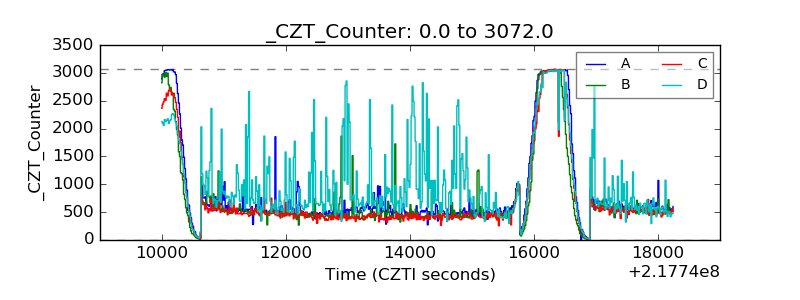 |
| +2.5 Volts monitor |  |
| +5 Volts monitor |  |
| _ROLL_ROT | 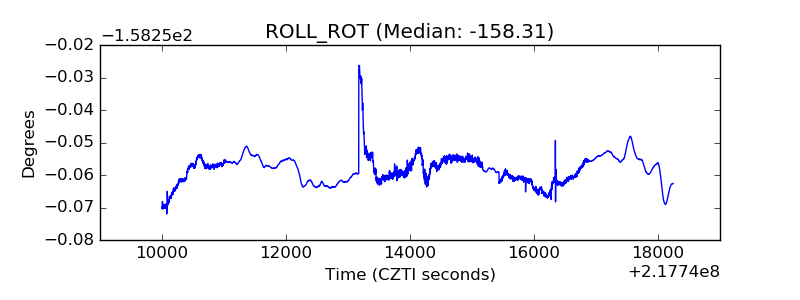 |
| _Roll_DEC | 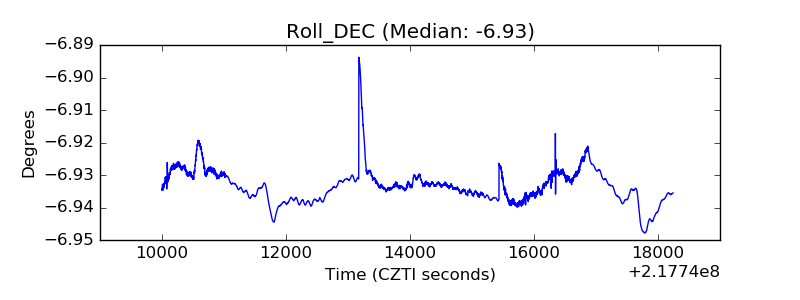 |
| _Roll_RA | 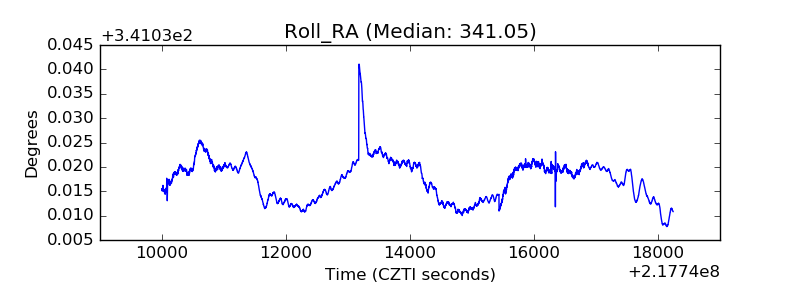 |
| Veto Counter | 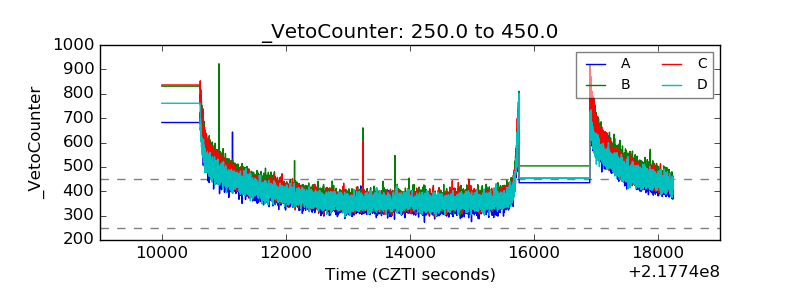 |