| Param | Original file | Final file |
|---|---|---|
| Filename | modeM0/AS1C02_018T02_9000000824_06282cztM0_level2.evt | modeM0/AS1C02_018T02_9000000824_06282cztM0_level2_quad_clean.evt |
| Size (bytes) | 367,185,600 | 69,350,400 |
| Size | 350.2 MB | 66.1 MB |
| Events in quadrant A | 2,864,689 | 446,173 |
| Events in quadrant B | 2,661,680 | 454,968 |
| Events in quadrant C | 2,095,762 | 452,763 |
| Events in quadrant D | 3,190,668 | 428,538 |
| Mode M9 | |||
|---|---|---|---|
| Quadrant | BADHDUFLAG | Total packets | Discarded packets |
| A | 0 | 13 | 0 |
| B | 0 | 13 | 0 |
| C | 0 | 13 | 0 |
| D | 0 | 13 | 0 |
| Mode M0 | |||
|---|---|---|---|
| Quadrant | BADHDUFLAG | Total packets | Discarded packets |
| A | 0 | 11512 | 1 |
| B | 0 | 10897 | 1 |
| C | 0 | 9397 | 1 |
| D | 0 | 12499 | 1 |
| Mode SS | |||
|---|---|---|---|
| Quadrant | BADHDUFLAG | Total packets | Discarded packets |
| A | 0 | 92 | 0 |
| B | 0 | 92 | 0 |
| C | 0 | 92 | 0 |
| D | 0 | 92 | 0 |
| Quadrant | Total seconds | Saturated seconds | Saturation percentage |
|---|---|---|---|
| A | 4517 | 200 | 4.427718% |
| B | 4517 | 183 | 4.051362% |
| C | 4517 | 83 | 1.837503% |
| D | 4517 | 241 | 5.335400% |
Noise dominated data is calculated using 1-second bins in cleaned event files. If a bin has >2000 counts, and if more than 50% of those come from <1% of pixels, then it is considered to be noise-dominated and hence unusable.
| Quadrant | # 1 sec bins | Bins with >0 counts | Bins with >2000 counts | High rate bins dominated by noise | Noise dominated (total time) | Noise dominated (detector-on time) | Marked lightcurve |
|---|---|---|---|---|---|---|---|
| A | 5742 | 4517 | 2 | 2 | 0.03% | 0.04% | 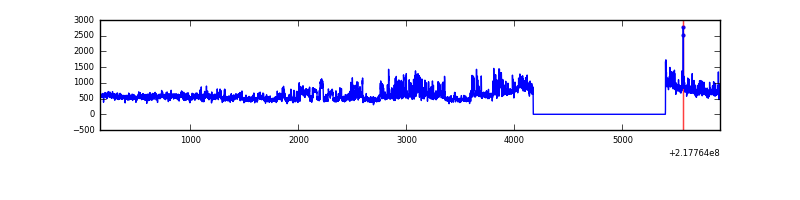 |
| B | 5742 | 4517 | 71 | 71 | 1.24% | 1.57% | 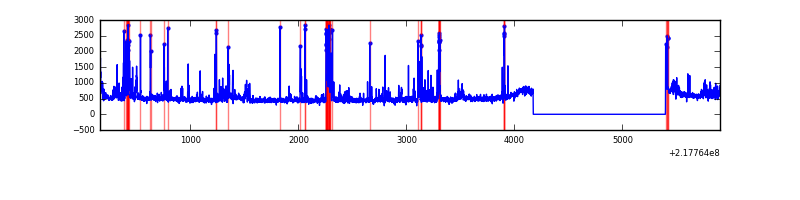 |
| C | 5742 | 4517 | 0 | 0 | 0.00% | 0.00% |  |
| D | 5742 | 4517 | 147 | 147 | 2.56% | 3.25% | 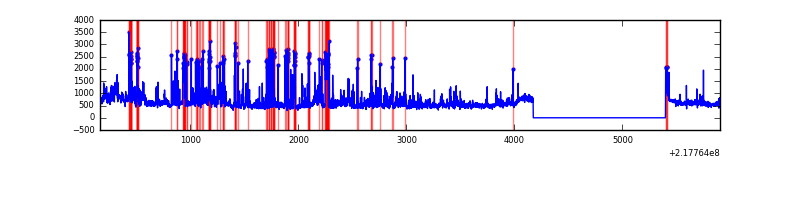 |
Top three noisy pixels from each quadrant. If the there are fewer than three noisy pixels in the level2.evt file, extra rows are filled as -1
| Pixel properties | Quadrant properties | ||||||
|---|---|---|---|---|---|---|---|
| Quadrant | DetID | PixID | Counts | Sigma | Mean | Median | Sigma |
| A | 8 | 15 | 647360 | 5732.04 | 551 | 538 | 112.8 |
| A | 14 | 111 | 77737 | 684.12 | 551 | 538 | 112.8 |
| A | 13 | 251 | 12586 | 106.76 | 551 | 538 | 112.8 |
| B | 3 | 64 | 326009 | 3056.81 | 553 | 541 | 106.5 |
| B | 4 | 81 | 98027 | 915.59 | 553 | 541 | 106.5 |
| B | 0 | 219 | 52336 | 486.46 | 553 | 541 | 106.5 |
| C | 9 | 54 | 8881 | 66.84 | 534 | 537 | 124.8 |
| C | 13 | 61 | 4313 | 30.25 | 534 | 537 | 124.8 |
| C | 1 | 16 | 2867 | 18.66 | 534 | 537 | 124.8 |
| D | 12 | 220 | 505724 | 3812.9 | 534 | 517 | 132.5 |
| D | 2 | 152 | 300904 | 2267.08 | 534 | 517 | 132.5 |
| D | 11 | 241 | 176388 | 1327.33 | 534 | 517 | 132.5 |
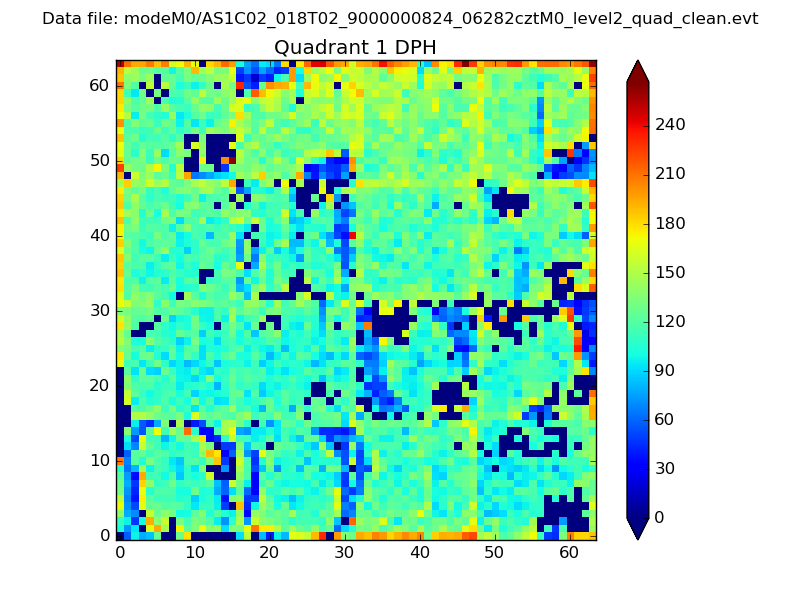
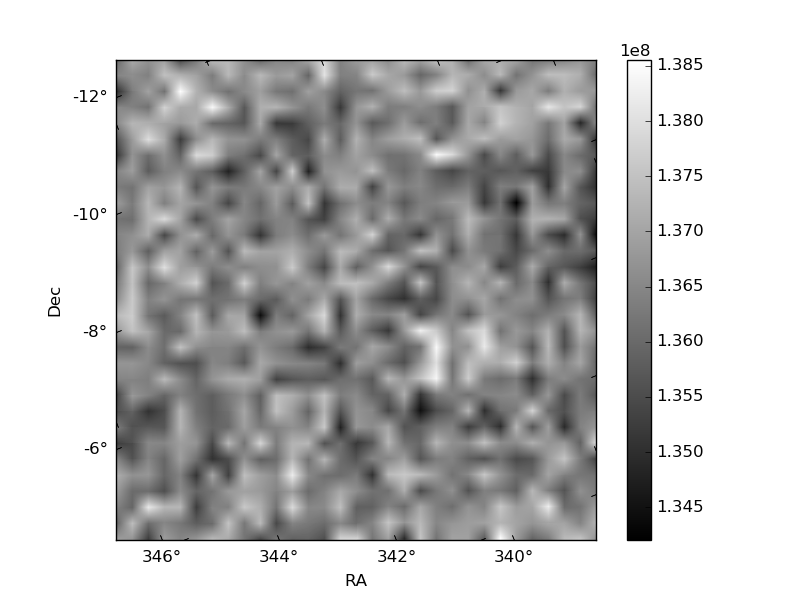
Histogram calculated using DETX and DETY for each event in the final _common_clean file
| Quadrant A | 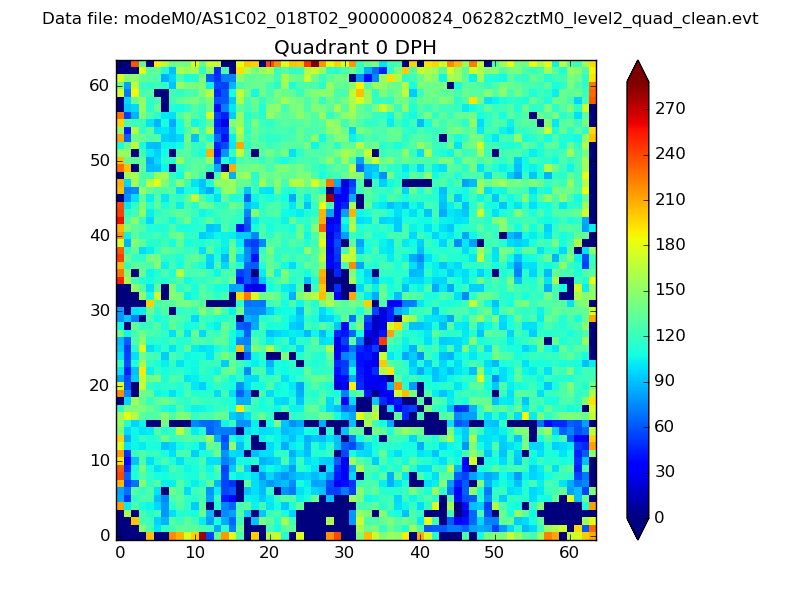 |
 |
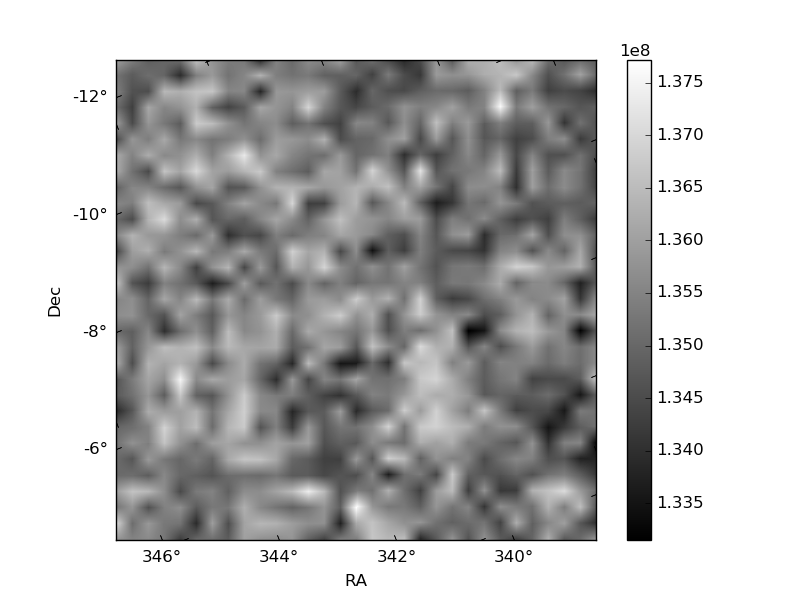
Quadrant B |
|---|---|---|---|
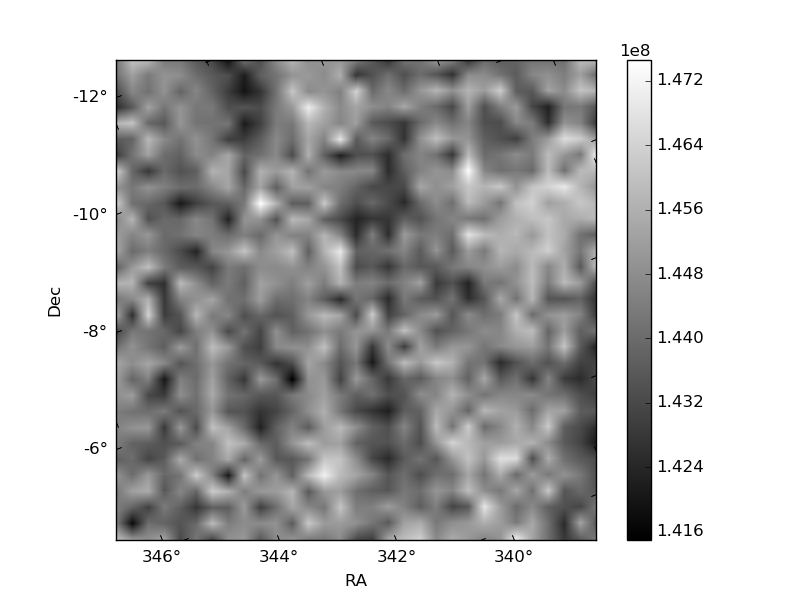
| Quadrant D | 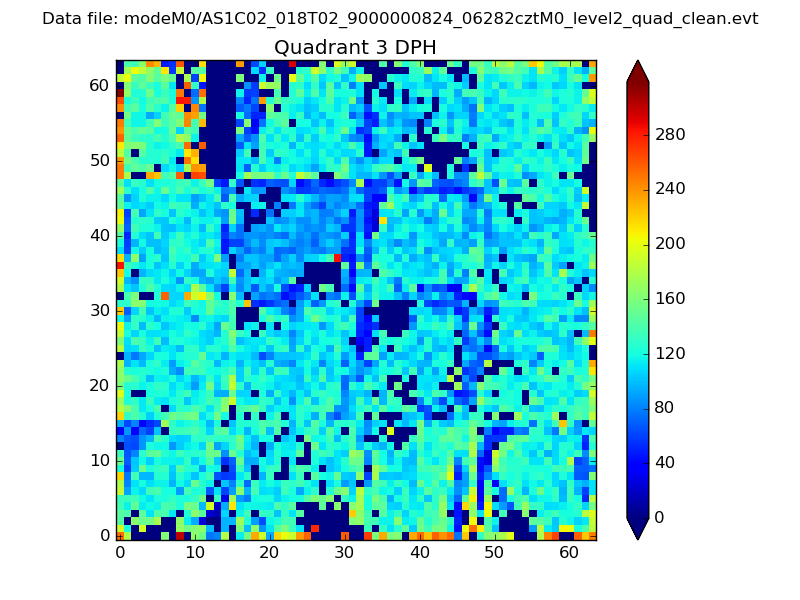 |
 |
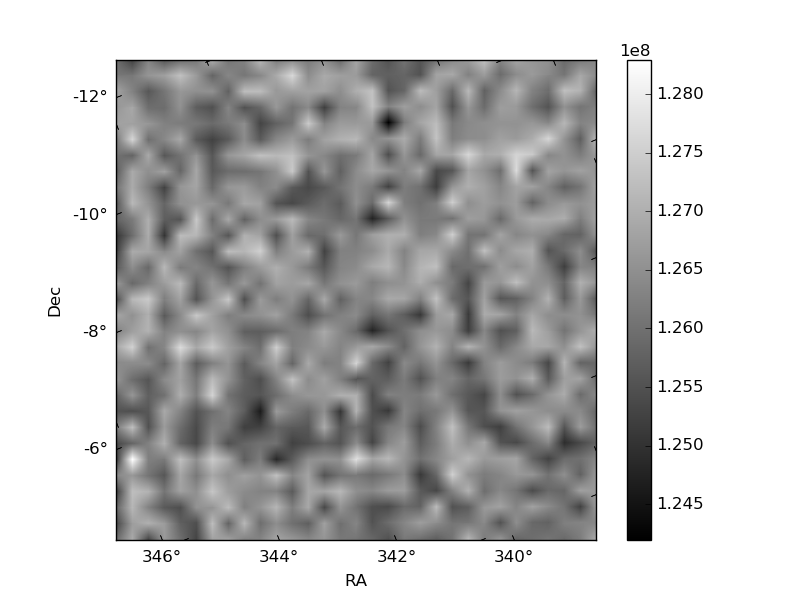
Quadrant C |
| Plot type | Count rate plots | Images |
|---|---|---|
| Comparison with Poisson distribution Blue bars denote a histogram of data divided into 1 sec bins. Red curve is a Poisson curve with rate = median count rate of data. |
 |
 |
| Quadrant-wise count rates Data is divided into 100 sec bins |
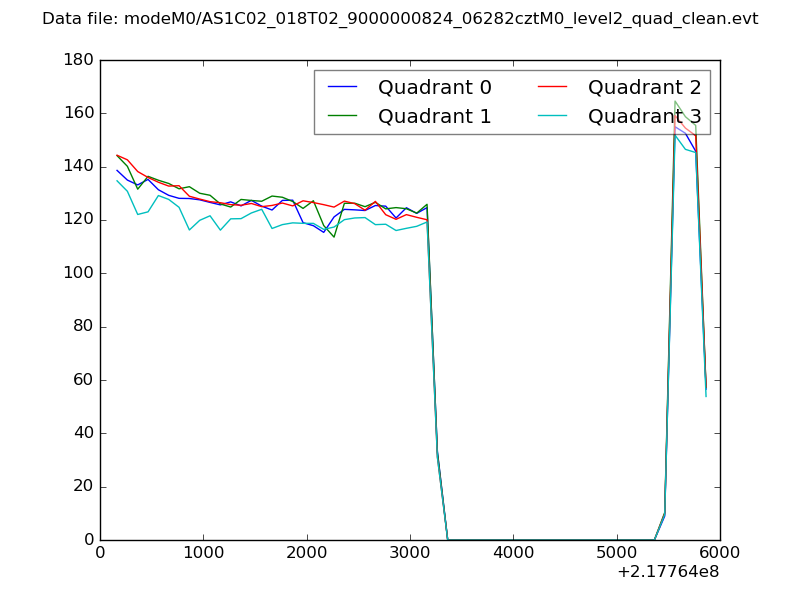 |
|
| Module-wise count rates for Quadrant A Data is divided into 100 sec bins |
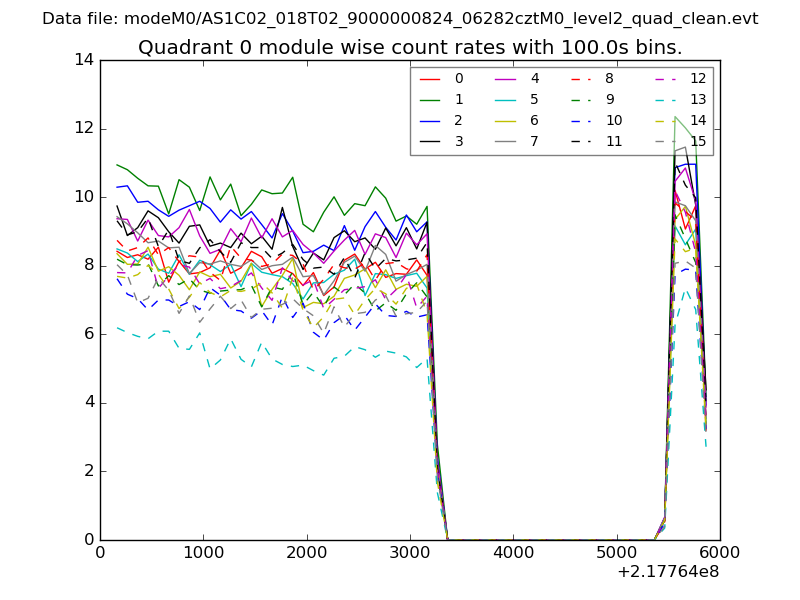 |
 |
| Module-wise count rates for Quadrant B Data is divided into 100 sec bins |
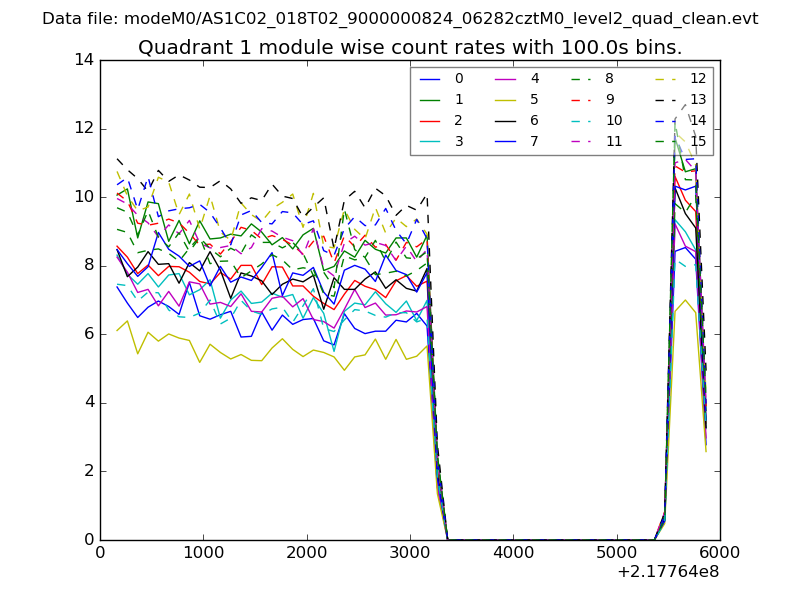 |
 |
| Module-wise count rates for Quadrant C Data is divided into 100 sec bins |
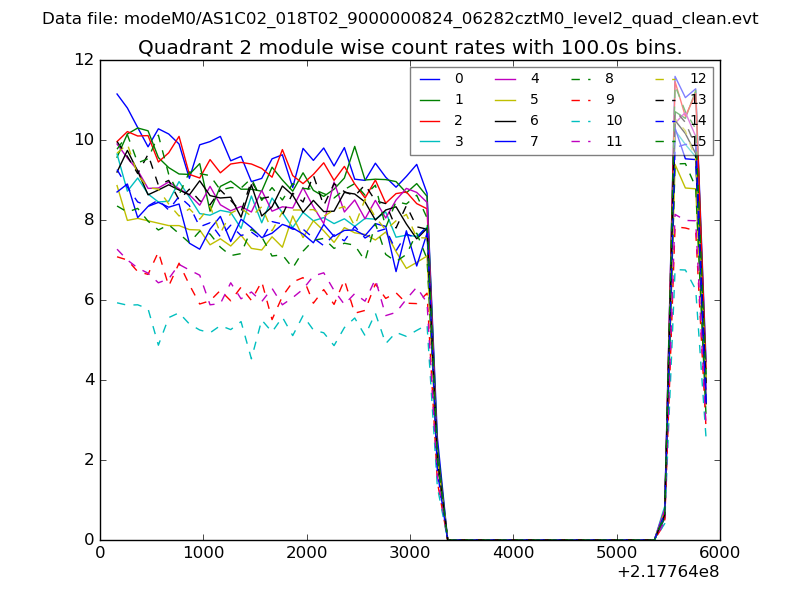 |
 |
| Module-wise count rates for Quadrant D Data is divided into 100 sec bins |
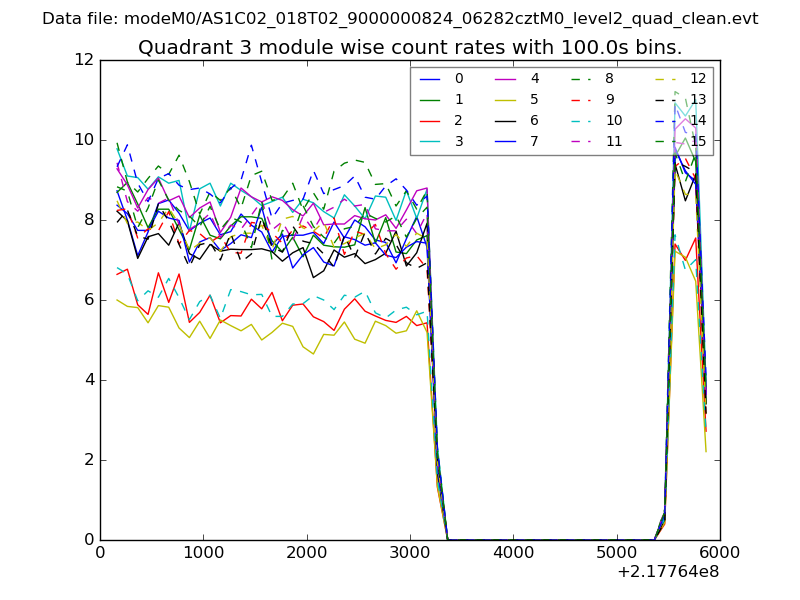 |
 |
| Parameter | Plot |
|---|---|
| CZT HV Monitor | 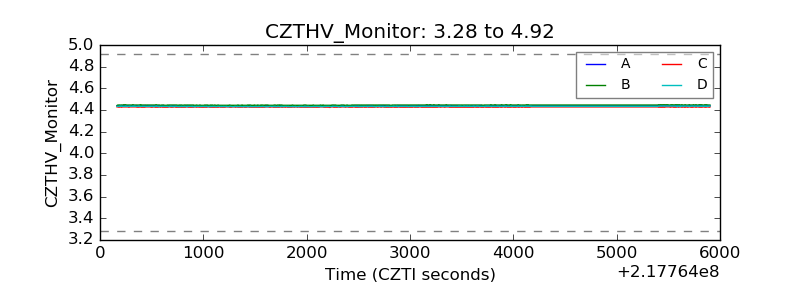 |
| D_VDD | 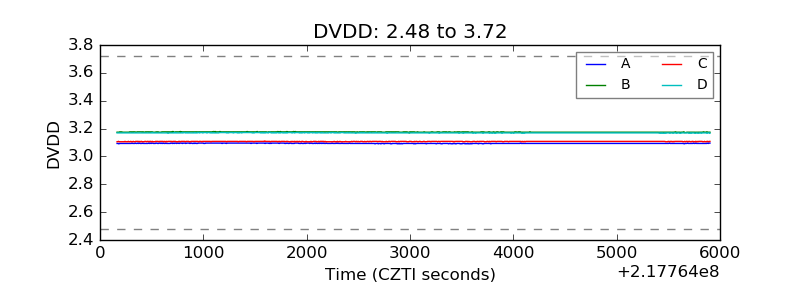 |
| Temperature 1 | 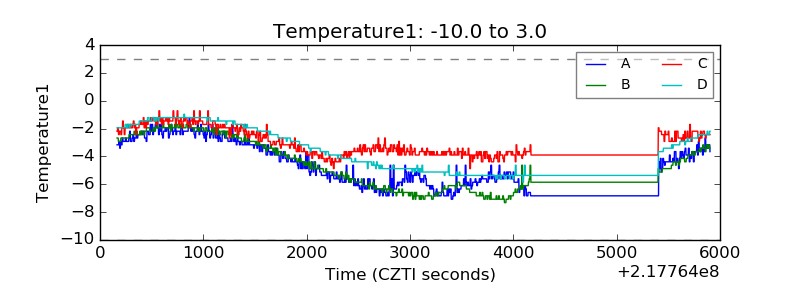 |
| Veto HV Monitor | 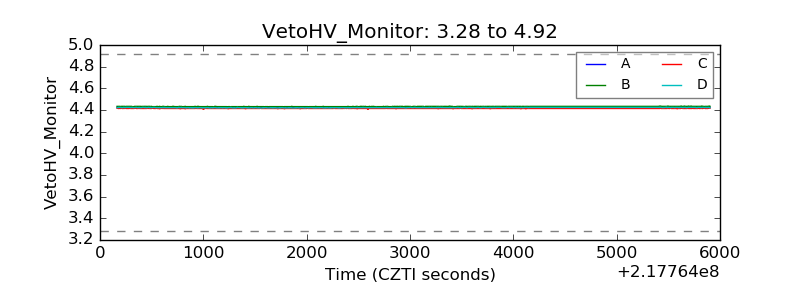 |
| Veto LLD | 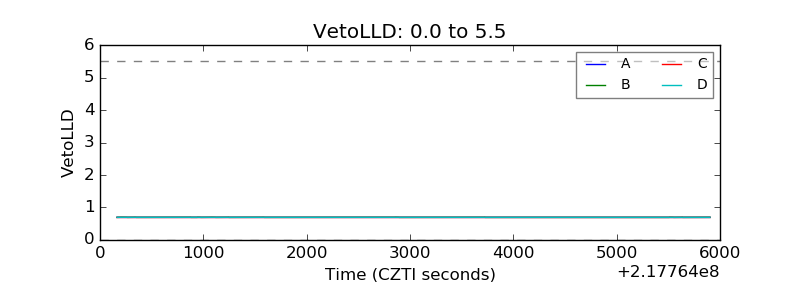 |
| Alpha Counter | 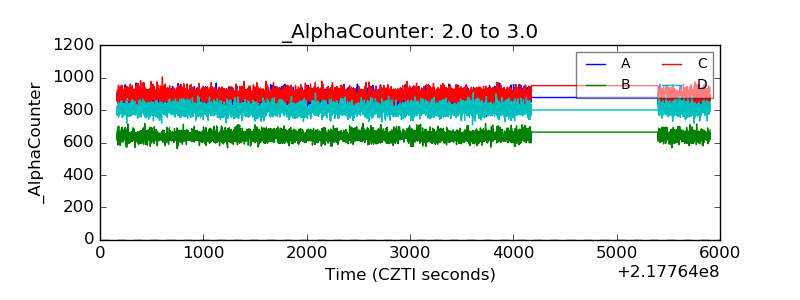 |
| _CPM_Rate | 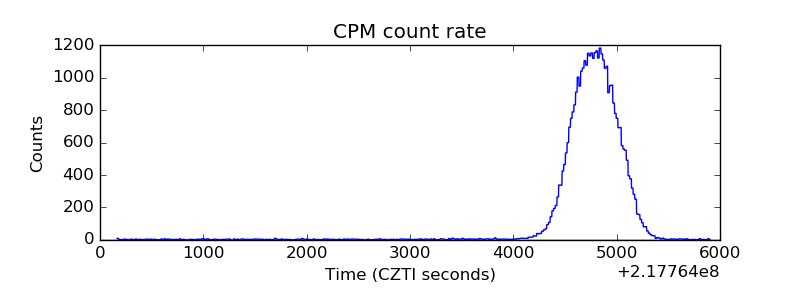 |
| CZT Counter |  |
| +2.5 Volts monitor |  |
| +5 Volts monitor |  |
| _ROLL_ROT | 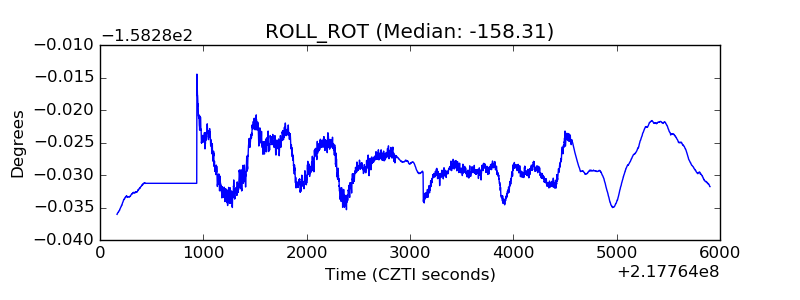 |
| _Roll_DEC | 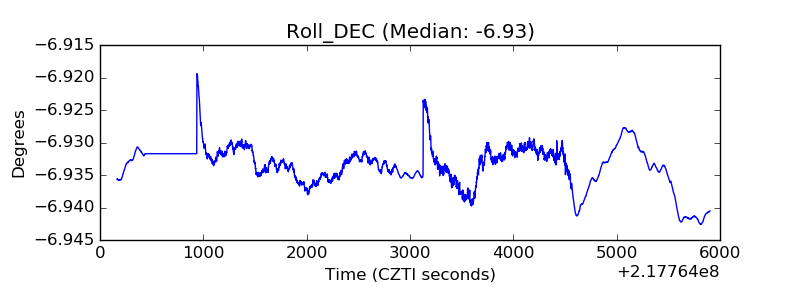 |
| _Roll_RA | 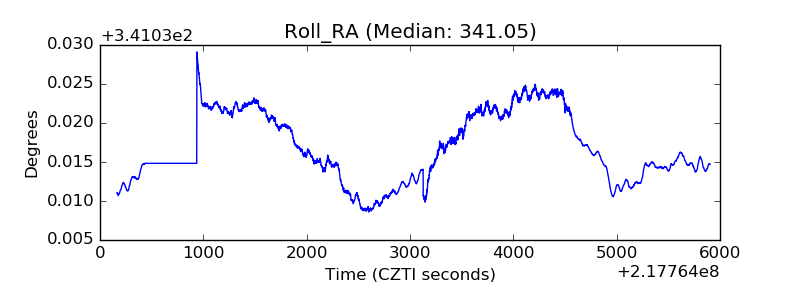 |
| Veto Counter | 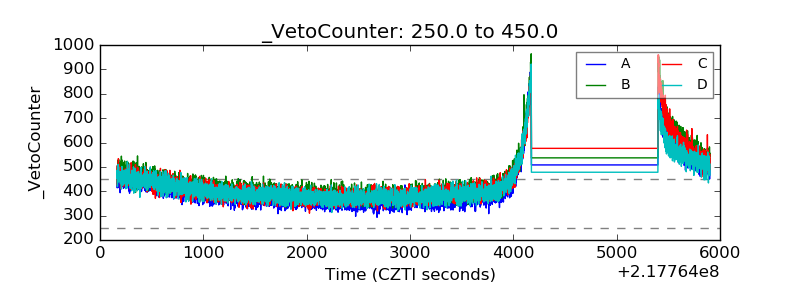 |