| Param | Original file | Final file |
|---|---|---|
| Filename | modeM0/AS1G06_168T04_9000000820cztM0_level2.fits | modeM0/AS1G06_168T04_9000000820cztM0_level2_quad_clean.evt |
| Size (bytes) | 174,654,720 | 181,077,120 |
| Size | 166.6 MB | 172.7 MB |
| Events in quadrant A | 1,043,146 | 1,098,975 |
| Events in quadrant B | 1,014,202 | 1,090,237 |
| Events in quadrant C | 1,038,928 | 1,066,802 |
| Events in quadrant D | 805,042 | 840,643 |
| Mode SS | |||
|---|---|---|---|
| Quadrant | BADHDUFLAG | Total packets | Discarded packets |
| A | 0 | 408 | 0 |
| B | 0 | 408 | 0 |
| C | 0 | 408 | 0 |
| D | 0 | 408 | 0 |
| Mode M9 | |||
|---|---|---|---|
| Quadrant | BADHDUFLAG | Total packets | Discarded packets |
| A | 0 | 25 | 0 |
| B | 0 | 25 | 0 |
| C | 0 | 25 | 0 |
| D | 0 | 25 | 0 |
| Mode M0 | |||
|---|---|---|---|
| Quadrant | BADHDUFLAG | Total packets | Discarded packets |
| A | 0 | 41075 | 0 |
| B | 0 | 43620 | 0 |
| C | 0 | 40617 | 0 |
| D | 0 | 68457 | 0 |
| Quadrant | Total seconds | Saturated seconds | Saturation percentage |
|---|---|---|---|
| A | 20136 | 135 | 0.670441% |
| B | 20136 | 326 | 1.618991% |
| C | 20136 | 94 | 0.466826% |
| D | 20136 | 3311 | 16.443186% |
Noise dominated data is calculated using 1-second bins in cleaned event files. If a bin has >2000 counts, and if more than 50% of those come from <1% of pixels, then it is considered to be noise-dominated and hence unusable.
| Quadrant | # 1 sec bins | Bins with >0 counts | Bins with >2000 counts | High rate bins dominated by noise | Noise dominated (total time) | Noise dominated (detector-on time) | Marked lightcurve |
|---|---|---|---|---|---|---|---|
| A | 22552 | 20134 | 0 | 0 | 0.00% | 0.00% | 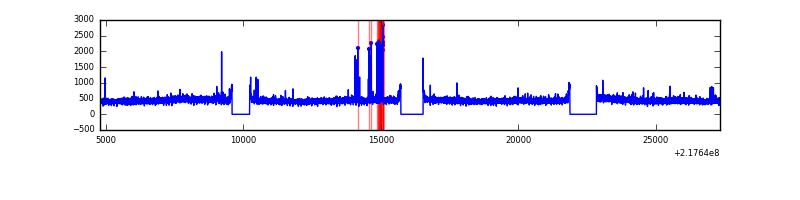 |
| B | 22552 | 20129 | 0 | 0 | 0.00% | 0.00% |  |
| C | 22552 | 20133 | 0 | 0 | 0.00% | 0.00% |  |
| D | 22552 | 20004 | 0 | 0 | 0.00% | 0.00% |  |
Top three noisy pixels from each quadrant. If the there are fewer than three noisy pixels in the level2.evt file, extra rows are filled as -1
| Pixel properties | Quadrant properties | ||||||
|---|---|---|---|---|---|---|---|
| Quadrant | DetID | PixID | Counts | Sigma | Mean | Median | Sigma |
| A | 14 | 188 | 1021 | 10.95 | 270 | 253 | 70.1 |
| A | 0 | 29 | 1012 | 10.82 | 270 | 253 | 70.1 |
| A | 14 | 204 | 916 | 9.45 | 270 | 253 | 70.1 |
| B | 2 | 9 | 913 | 11.69 | 267 | 253 | 56.4 |
| B | 12 | 226 | 756 | 8.91 | 267 | 253 | 56.4 |
| B | 14 | 254 | 716 | 8.2 | 267 | 253 | 56.4 |
| C | 12 | 241 | 777 | 6.94 | 273 | 252 | 75.6 |
| C | 1 | 81 | 773 | 6.89 | 273 | 252 | 75.6 |
| C | 1 | 80 | 761 | 6.73 | 273 | 252 | 75.6 |
| D | 11 | 82 | 605 | 6.18 | 229 | 209 | 64.0 |
| D | 1 | 19 | 597 | 6.06 | 229 | 209 | 64.0 |
| D | 6 | 231 | 590 | 5.95 | 229 | 209 | 64.0 |
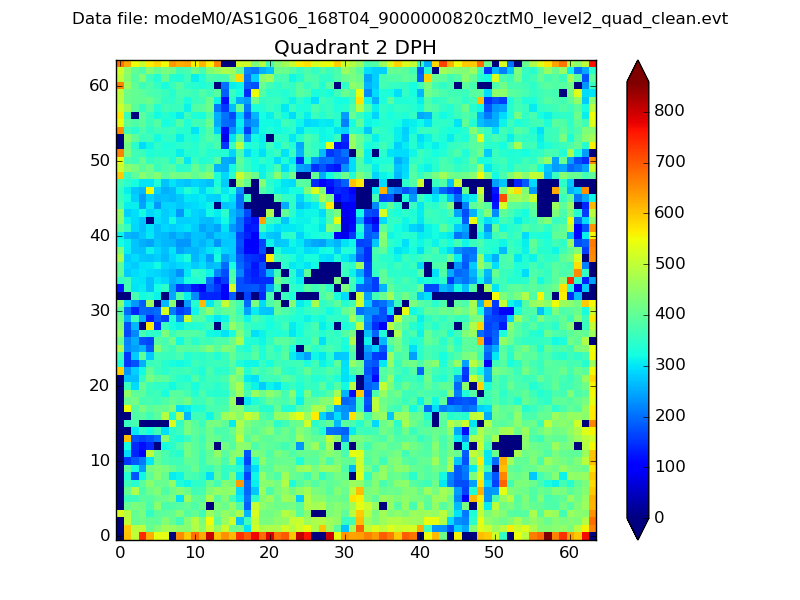
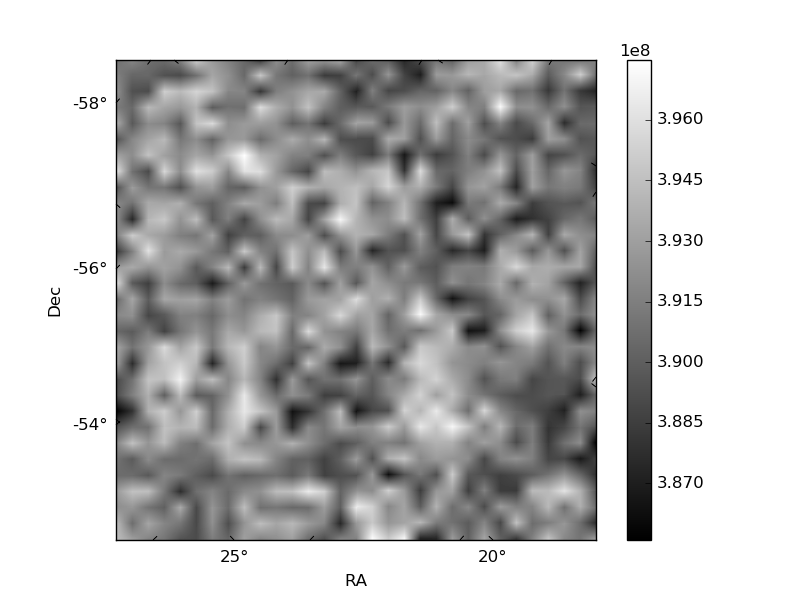
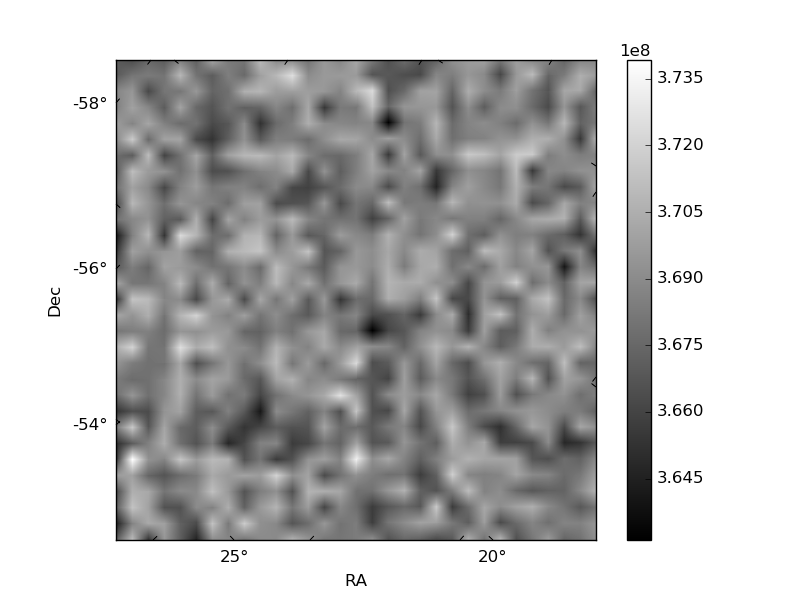
Histogram calculated using DETX and DETY for each event in the final _common_clean file
| Quadrant A |  |
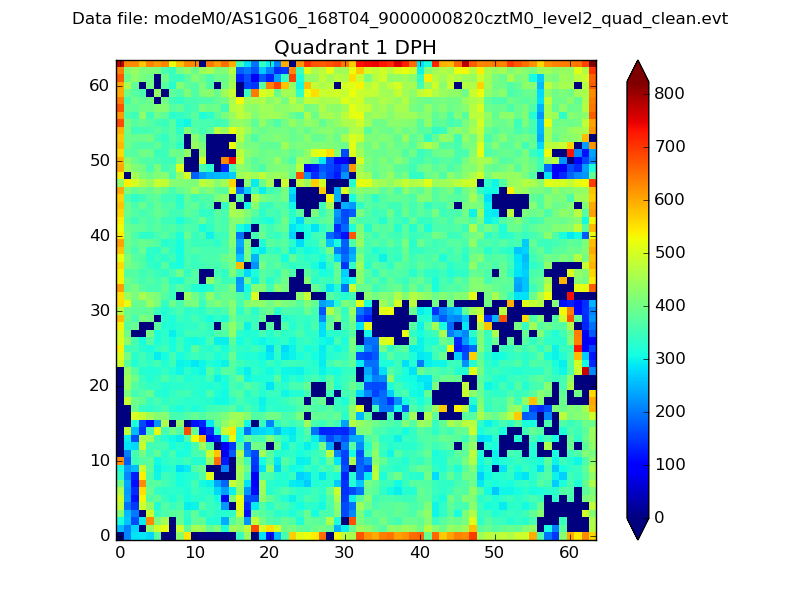 |
Quadrant B |
|---|---|---|---|
| Quadrant D | 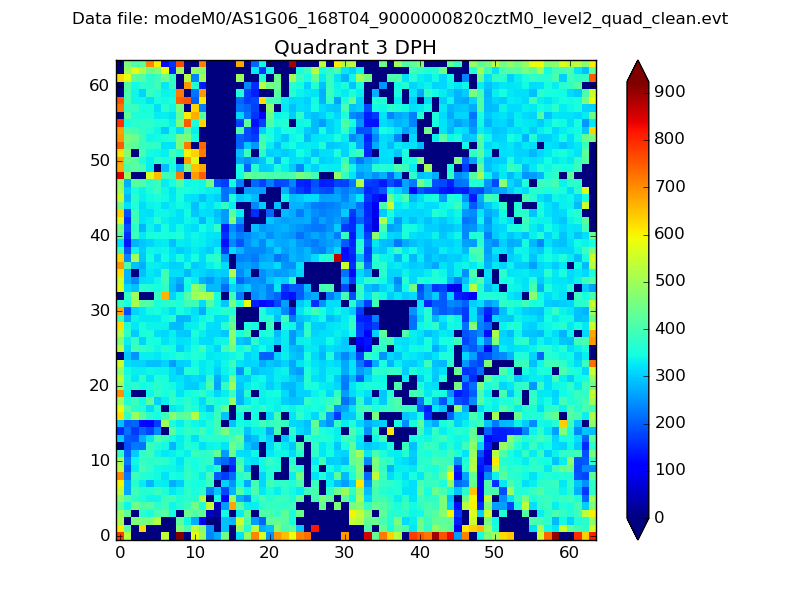 |
 |
Quadrant C |
| Plot type | Count rate plots | Images |
|---|---|---|
| Comparison with Poisson distribution Blue bars denote a histogram of data divided into 1 sec bins. Red curve is a Poisson curve with rate = median count rate of data. |
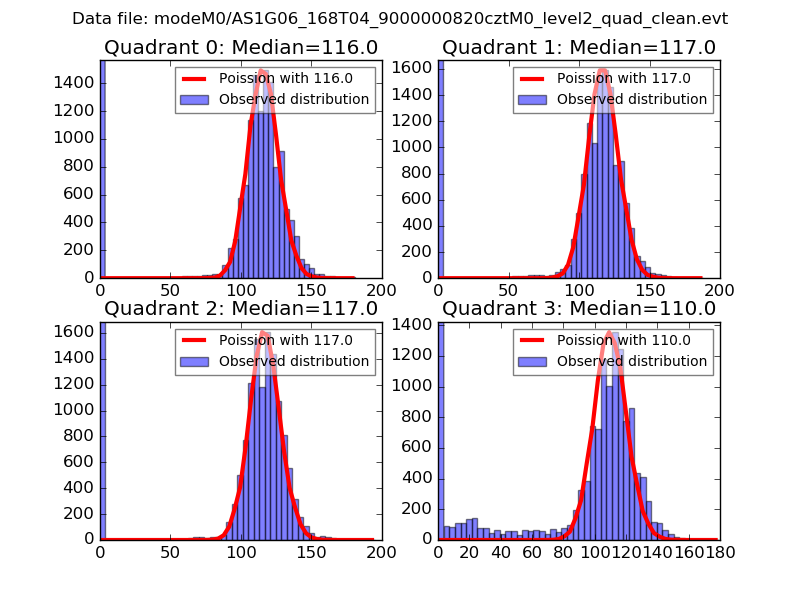 |
 |
| Quadrant-wise count rates Data is divided into 100 sec bins |
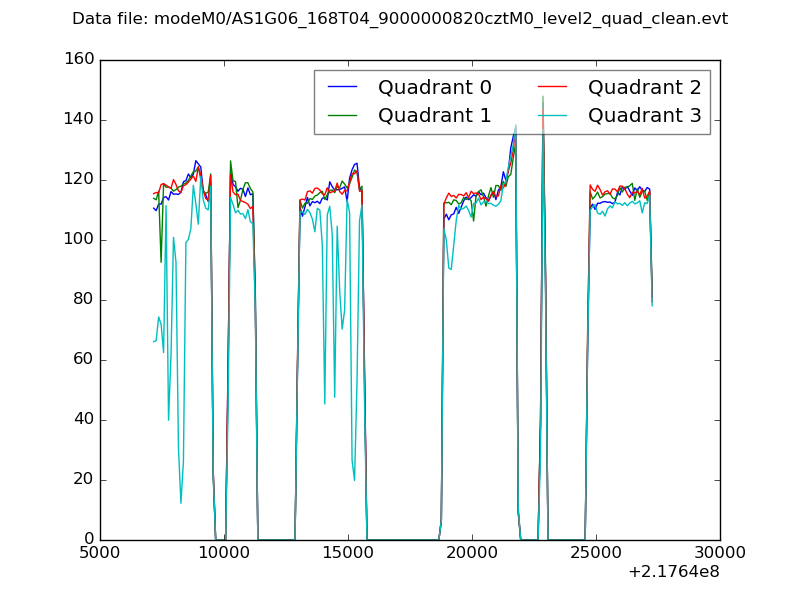 |
|
| Module-wise count rates for Quadrant A Data is divided into 100 sec bins |
 |
 |
| Module-wise count rates for Quadrant B Data is divided into 100 sec bins |
 |
 |
| Module-wise count rates for Quadrant C Data is divided into 100 sec bins |
 |
 |
| Module-wise count rates for Quadrant D Data is divided into 100 sec bins |
 |
 |
| Parameter | Plot |
|---|---|
| CZT HV Monitor |  |
| D_VDD | 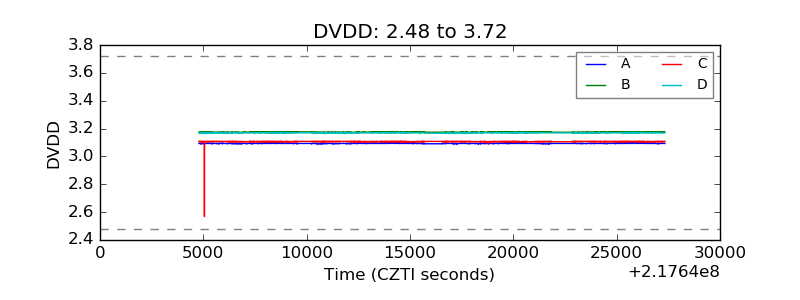 |
| Temperature 1 |  |
| Veto HV Monitor |  |
| Veto LLD |  |
| Alpha Counter | 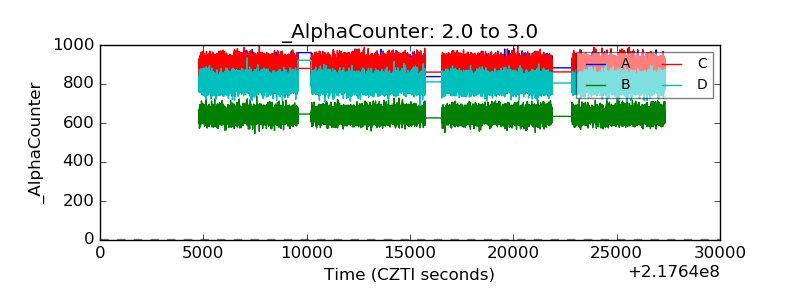 |
| _CPM_Rate |  |
| CZT Counter |  |
| +2.5 Volts monitor |  |
| +5 Volts monitor | 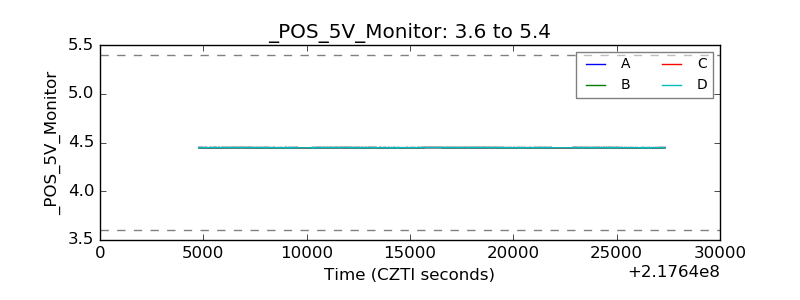 |
| _ROLL_ROT | 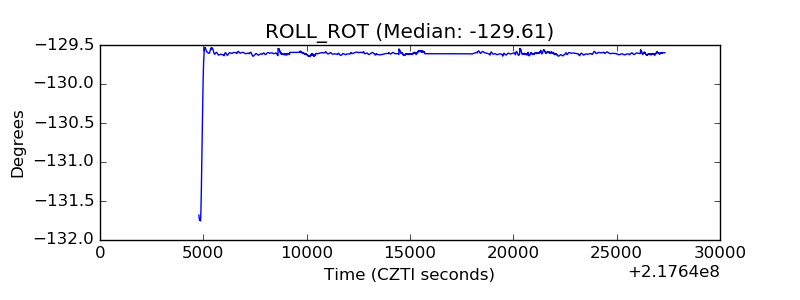 |
| _Roll_DEC |  |
| _Roll_RA |  |
| Veto Counter |  |