| Param | Original file | Final file |
|---|---|---|
| Filename | modeM0/AS1G06_168T04_9000000820_06262cztM0_level2.evt | modeM0/AS1G06_168T04_9000000820_06262cztM0_level2_quad_clean.evt |
| Size (bytes) | 489,816,000 | 75,127,680 |
| Size | 467.1 MB | 71.6 MB |
| Events in quadrant A | 3,025,529 | 459,688 |
| Events in quadrant B | 3,410,568 | 461,096 |
| Events in quadrant C | 2,978,753 | 460,409 |
| Events in quadrant D | 4,959,890 | 422,349 |
| Mode SS | |||
|---|---|---|---|
| Quadrant | BADHDUFLAG | Total packets | Discarded packets |
| A | 0 | 138 | 0 |
| B | 0 | 138 | 0 |
| C | 0 | 138 | 0 |
| D | 0 | 138 | 0 |
| Mode M9 | |||
|---|---|---|---|
| Quadrant | BADHDUFLAG | Total packets | Discarded packets |
| A | 0 | 18 | 0 |
| B | 0 | 18 | 0 |
| C | 0 | 18 | 0 |
| D | 0 | 18 | 0 |
| Mode M0 | |||
|---|---|---|---|
| Quadrant | BADHDUFLAG | Total packets | Discarded packets |
| A | 0 | 13764 | 3 |
| B | 0 | 14695 | 2 |
| C | 0 | 13733 | 2 |
| D | 0 | 19483 | 2 |
| Quadrant | Total seconds | Saturated seconds | Saturation percentage |
|---|---|---|---|
| A | 6763 | 61 | 0.901967% |
| B | 6763 | 140 | 2.070087% |
| C | 6763 | 54 | 0.798462% |
| D | 6763 | 623 | 9.211888% |
Noise dominated data is calculated using 1-second bins in cleaned event files. If a bin has >2000 counts, and if more than 50% of those come from <1% of pixels, then it is considered to be noise-dominated and hence unusable.
| Quadrant | # 1 sec bins | Bins with >0 counts | Bins with >2000 counts | High rate bins dominated by noise | Noise dominated (total time) | Noise dominated (detector-on time) | Marked lightcurve |
|---|---|---|---|---|---|---|---|
| A | 8539 | 6763 | 0 | 0 | 0.00% | 0.00% | 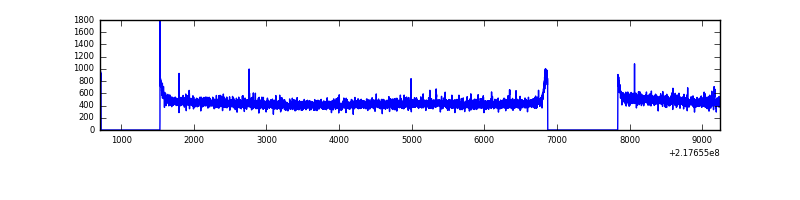 |
| B | 8539 | 6763 | 58 | 58 | 0.68% | 0.86% | 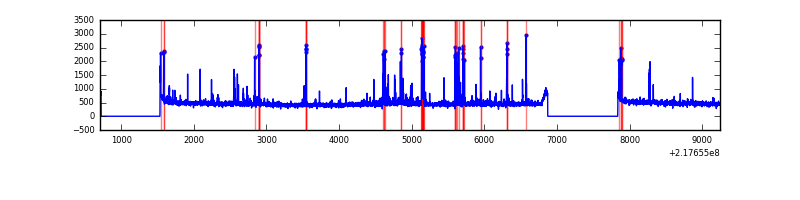 |
| C | 8539 | 6763 | 0 | 0 | 0.00% | 0.00% | 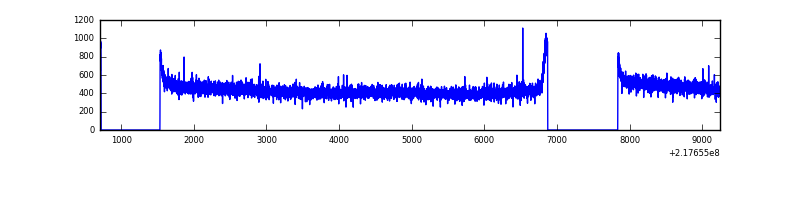 |
| D | 8539 | 6763 | 556 | 556 | 6.51% | 8.22% | 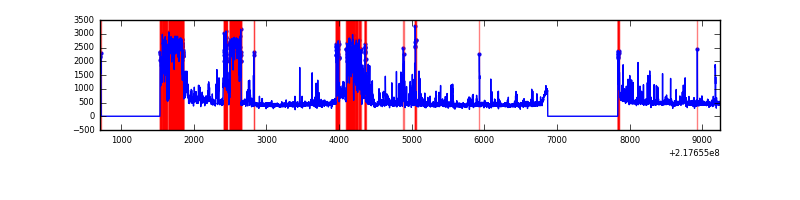 |
Top three noisy pixels from each quadrant. If the there are fewer than three noisy pixels in the level2.evt file, extra rows are filled as -1
| Pixel properties | Quadrant properties | ||||||
|---|---|---|---|---|---|---|---|
| Quadrant | DetID | PixID | Counts | Sigma | Mean | Median | Sigma |
| A | 8 | 15 | 12790 | 75.97 | 775 | 757 | 158.4 |
| A | 15 | 174 | 10568 | 61.94 | 775 | 757 | 158.4 |
| A | 0 | 226 | 7369 | 41.75 | 775 | 757 | 158.4 |
| B | 3 | 64 | 203164 | 1366.37 | 777 | 758 | 148.1 |
| B | 0 | 219 | 108619 | 728.13 | 777 | 758 | 148.1 |
| B | 11 | 51 | 45179 | 299.87 | 777 | 758 | 148.1 |
| C | 13 | 61 | 5838 | 28.77 | 761 | 763 | 176.4 |
| C | 14 | 67 | 4275 | 19.91 | 761 | 763 | 176.4 |
| C | 8 | 222 | 2980 | 12.57 | 761 | 763 | 176.4 |
| D | 13 | 105 | 1600332 | 8933.16 | 728 | 703 | 179.1 |
| D | 12 | 220 | 370078 | 2062.78 | 728 | 703 | 179.1 |
| D | 12 | 110 | 84683 | 468.99 | 728 | 703 | 179.1 |
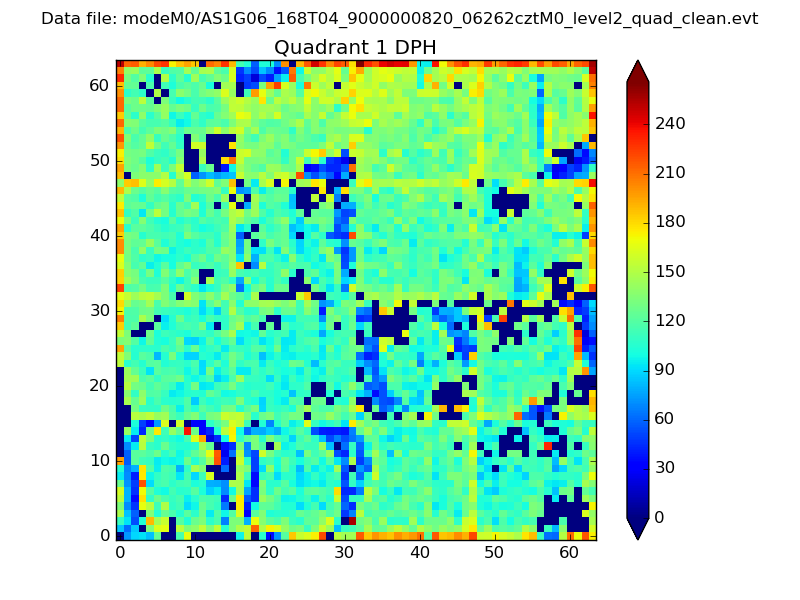
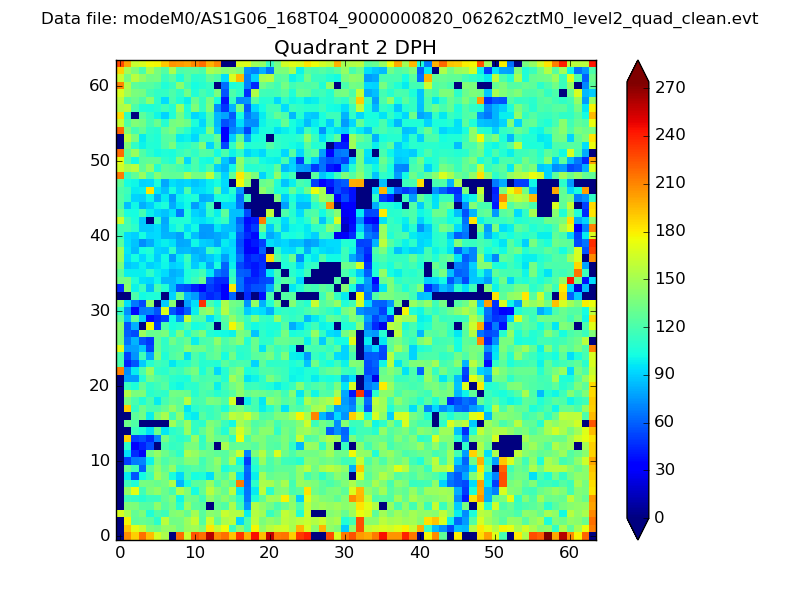
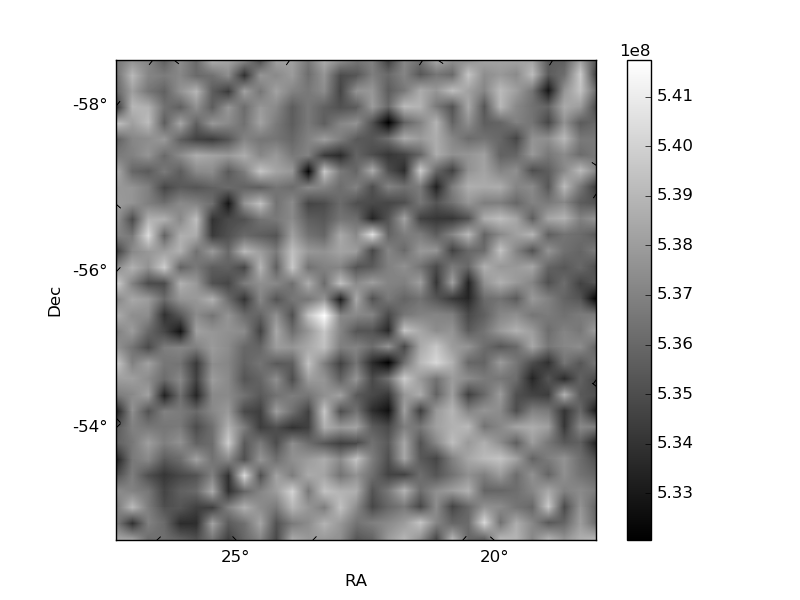
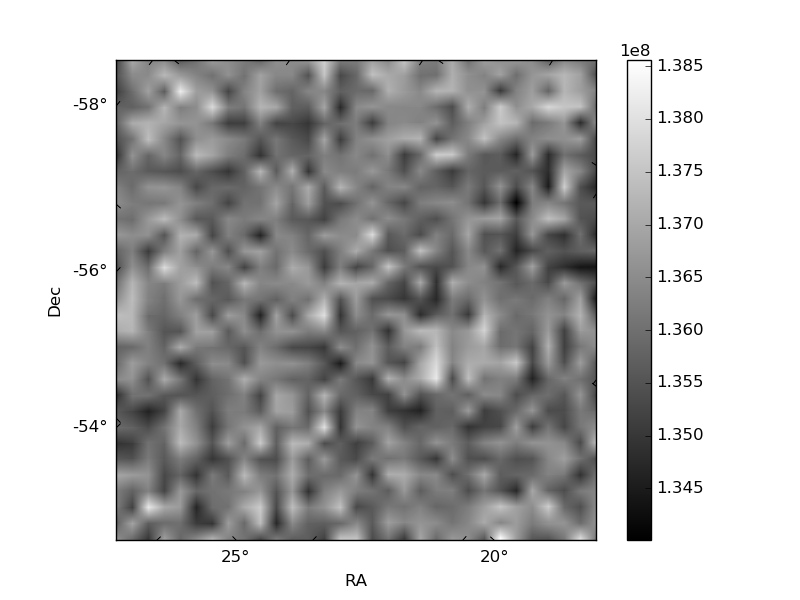
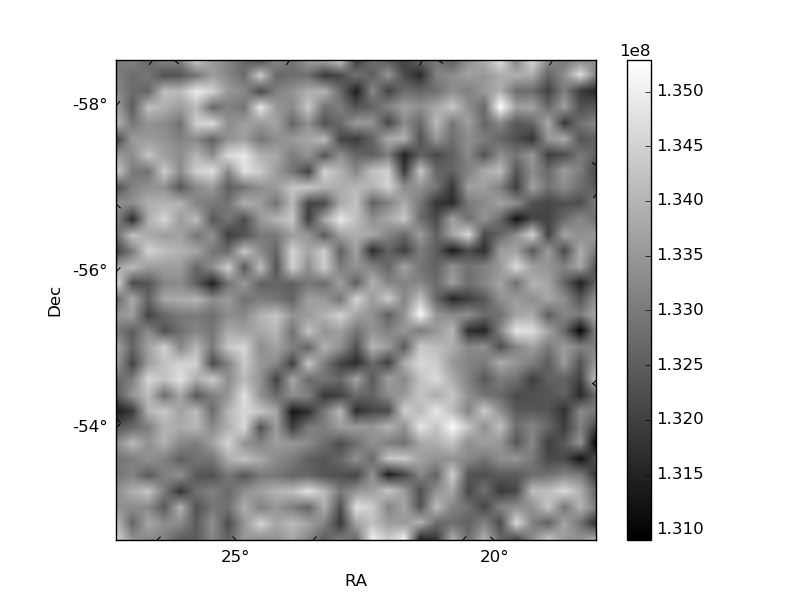
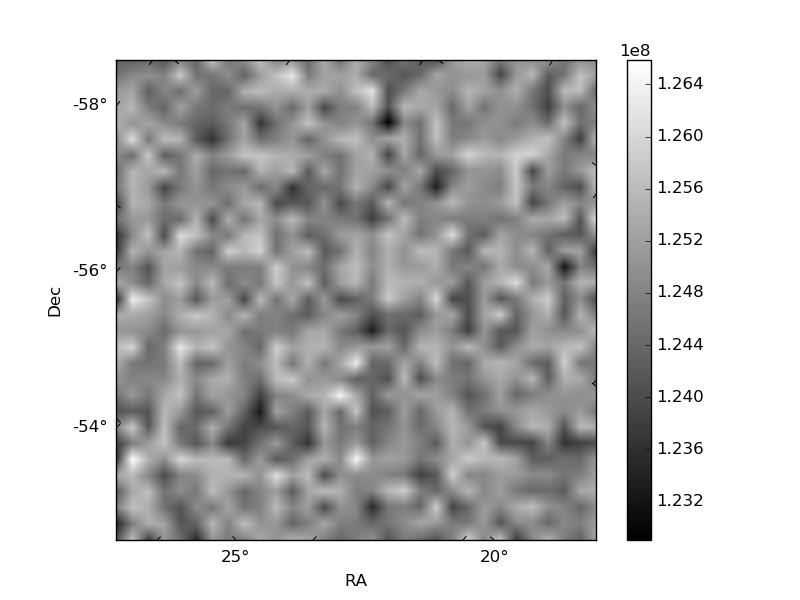
Histogram calculated using DETX and DETY for each event in the final _common_clean file
| Quadrant A |  |
 |
Quadrant B |
|---|---|---|---|
| Quadrant D | 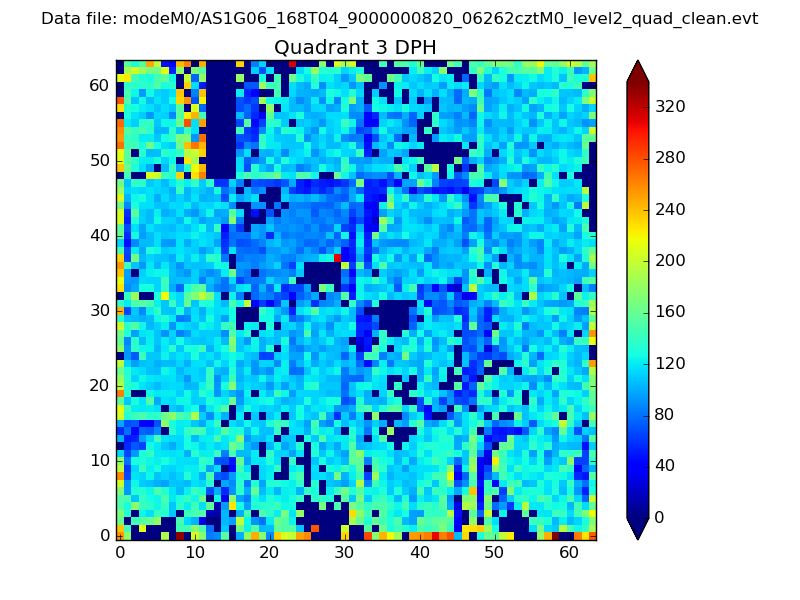 |
 |
Quadrant C |
| Plot type | Count rate plots | Images |
|---|---|---|
| Comparison with Poisson distribution Blue bars denote a histogram of data divided into 1 sec bins. Red curve is a Poisson curve with rate = median count rate of data. |
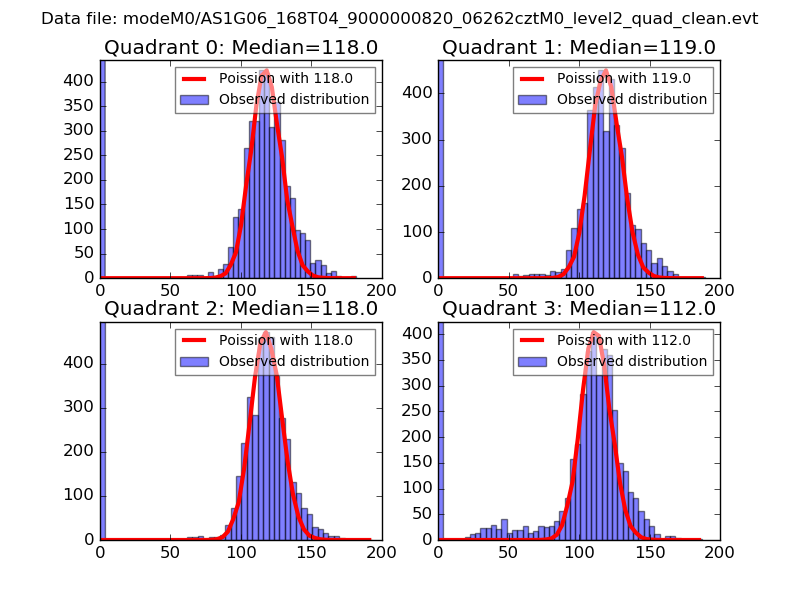 |
 |
| Quadrant-wise count rates Data is divided into 100 sec bins |
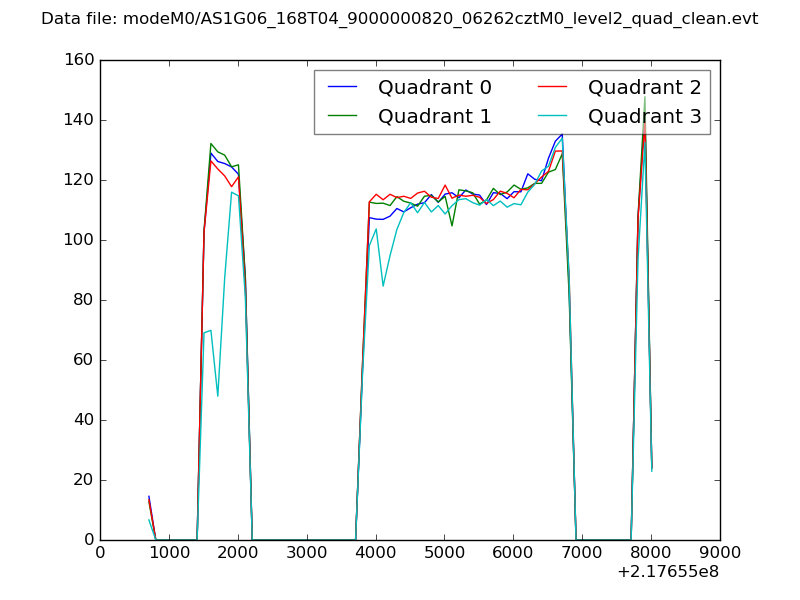 |
|
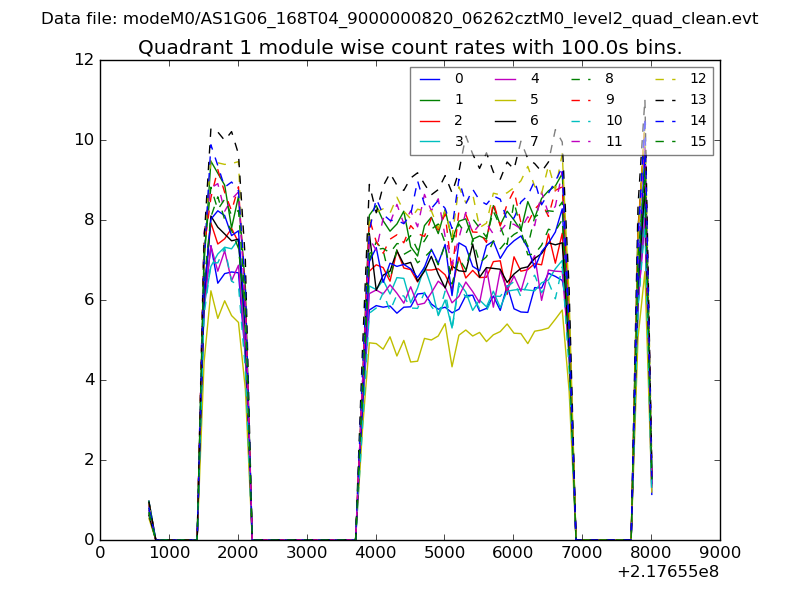
| Module-wise count rates for Quadrant A Data is divided into 100 sec bins |
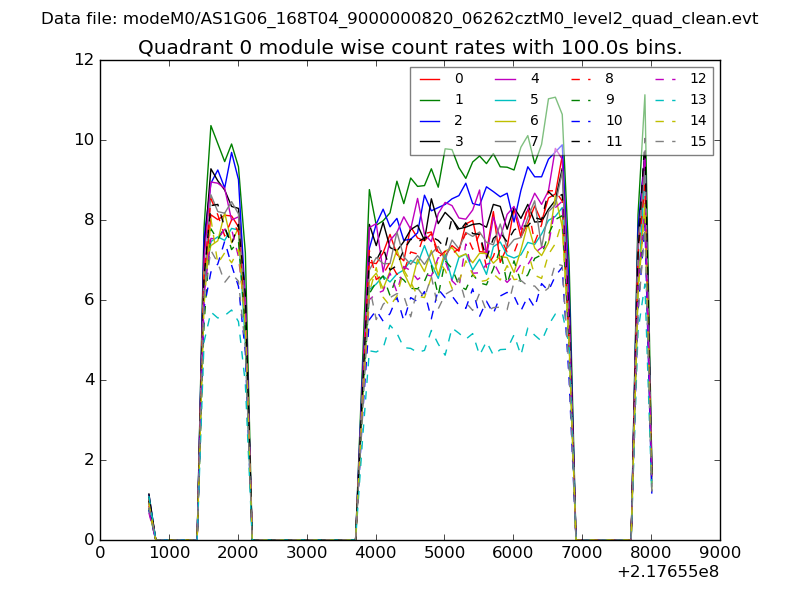 |
 |
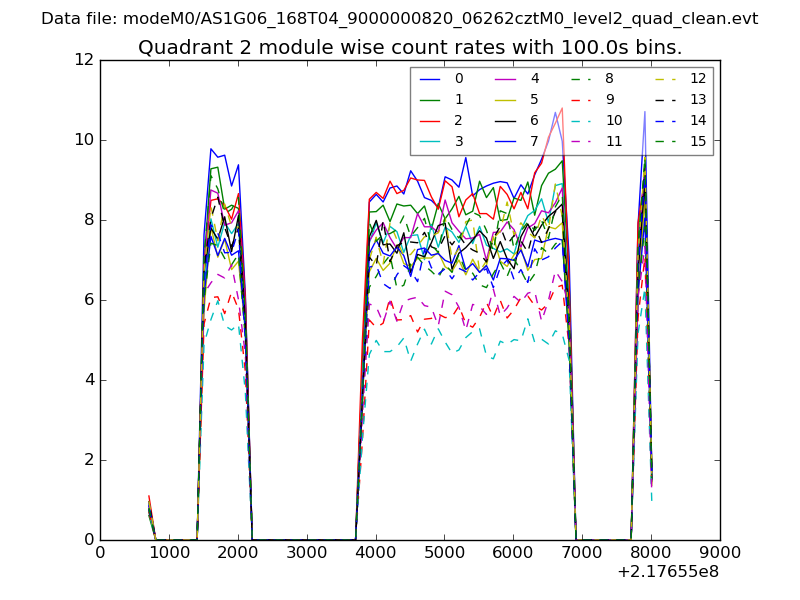
| Module-wise count rates for Quadrant B Data is divided into 100 sec bins |
 |
 |
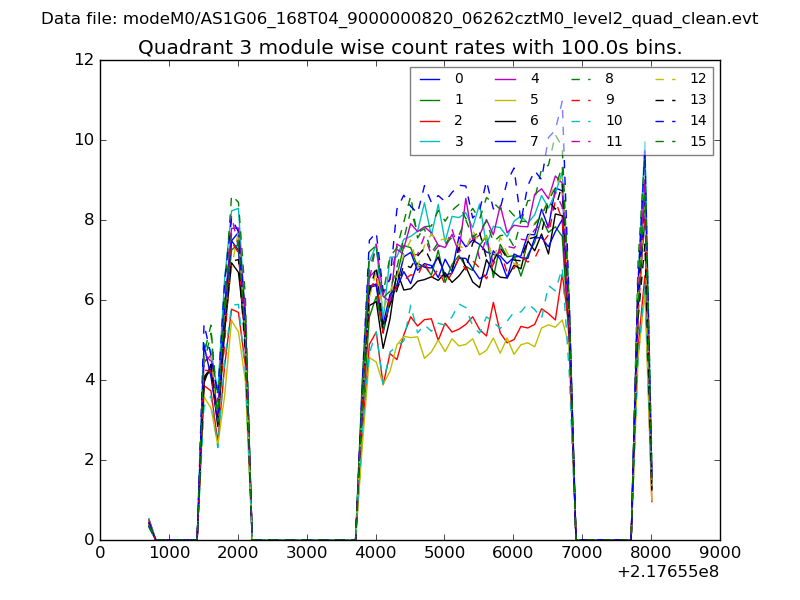
| Module-wise count rates for Quadrant C Data is divided into 100 sec bins |
 |
 |
| Module-wise count rates for Quadrant D Data is divided into 100 sec bins |
 |
 |
| Parameter | Plot |
|---|---|
| CZT HV Monitor | 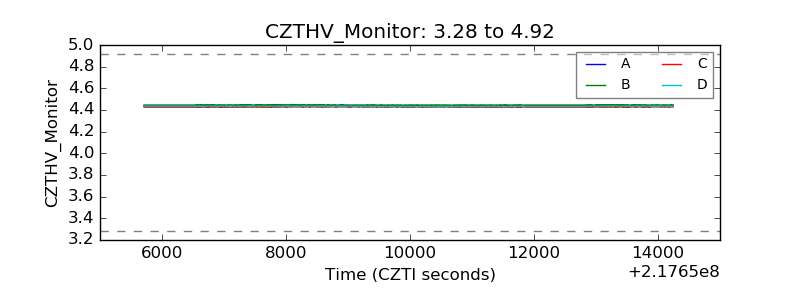 |
| D_VDD | 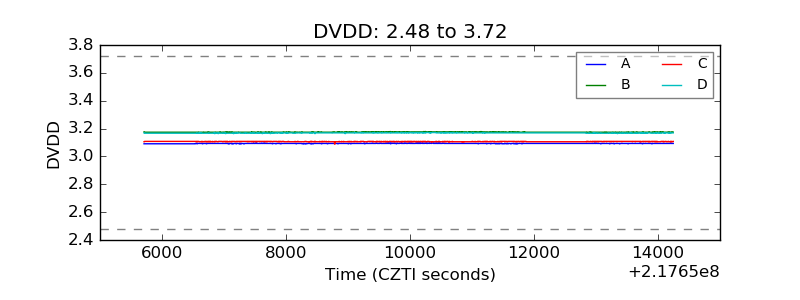 |
| Temperature 1 | 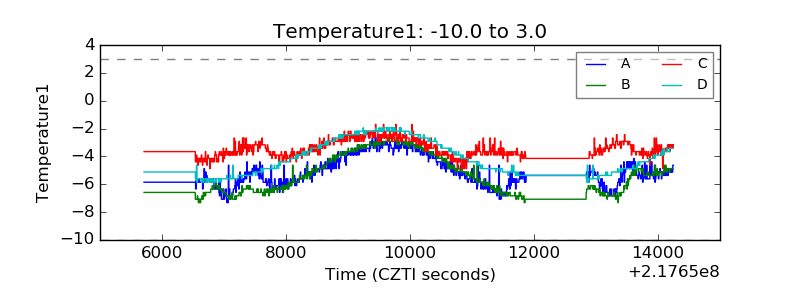 |
| Veto HV Monitor | 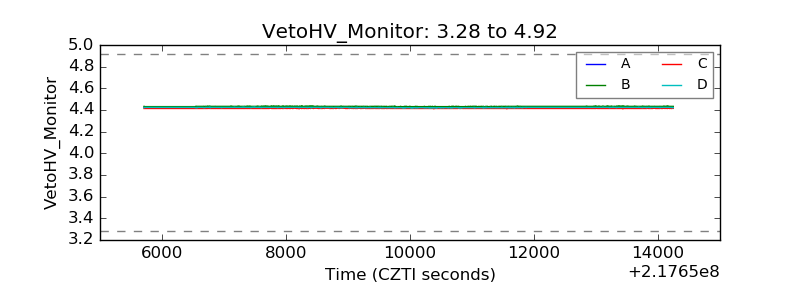 |
| Veto LLD | 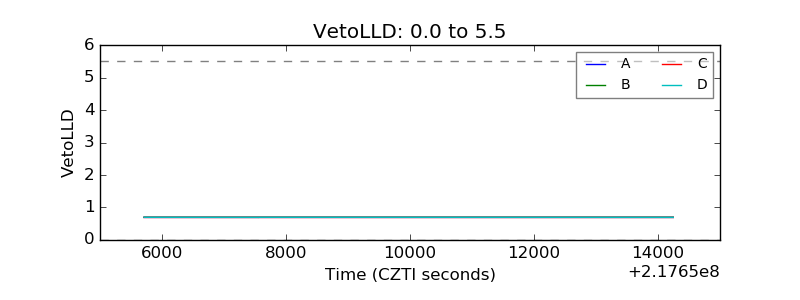 |
| Alpha Counter | 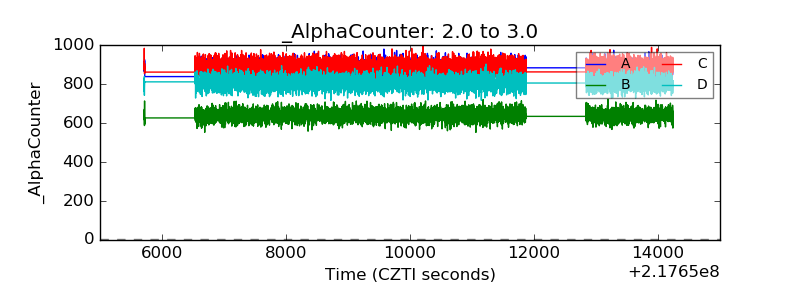 |
| _CPM_Rate | 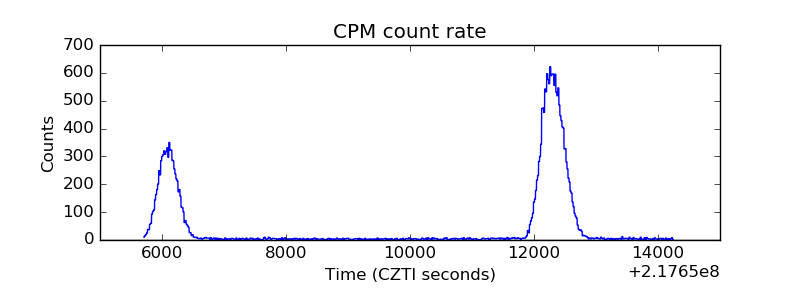 |
| CZT Counter | 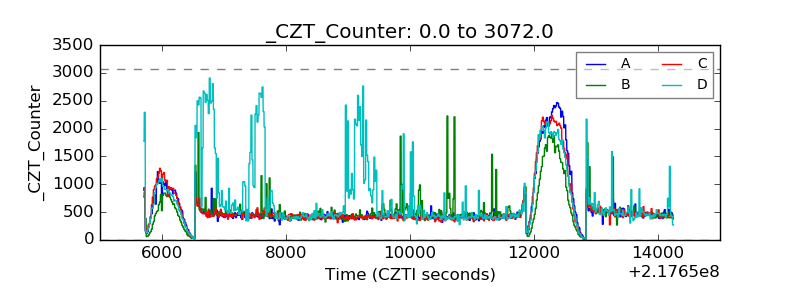 |
| +2.5 Volts monitor |  |
| +5 Volts monitor | 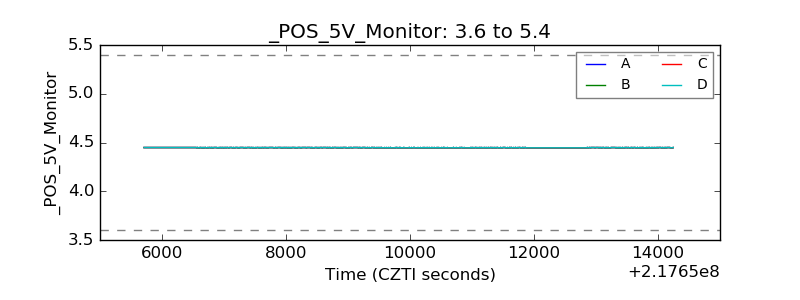 |
| _ROLL_ROT | 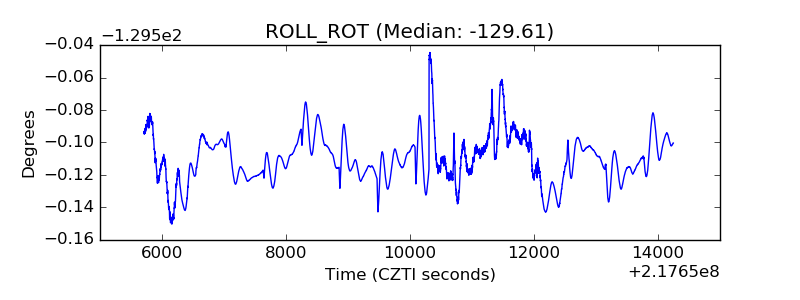 |
| _Roll_DEC | 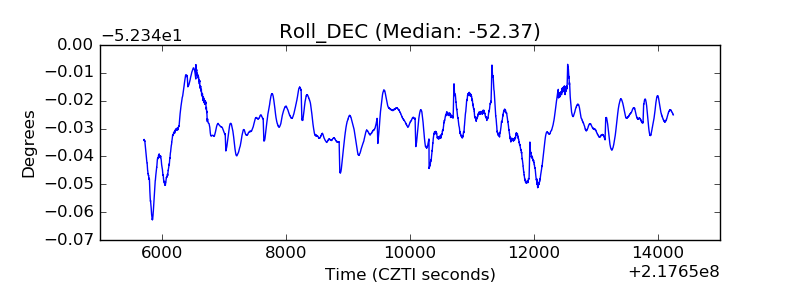 |
| _Roll_RA | 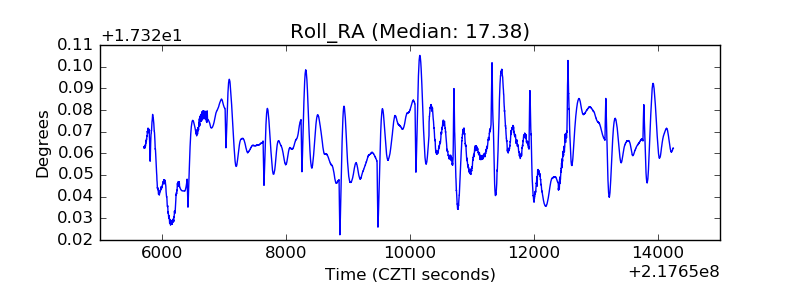 |
| Veto Counter | 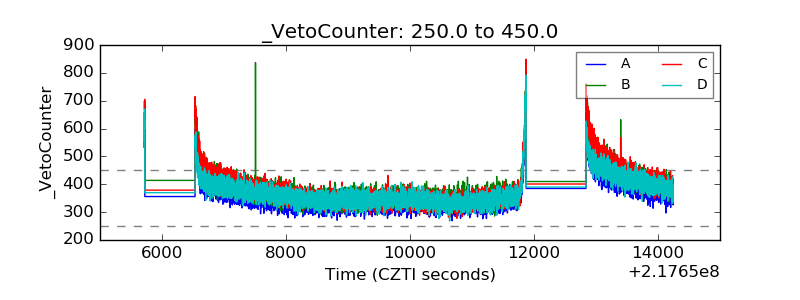 |