| Param | Original file | Final file |
|---|---|---|
| Filename | modeM0/AS1G06_168T04_9000000820_06264cztM0_level2.evt | modeM0/AS1G06_168T04_9000000820_06264cztM0_level2_quad_clean.evt |
| Size (bytes) | 293,425,920 | 53,752,320 |
| Size | 279.8 MB | 51.3 MB |
| Events in quadrant A | 1,986,490 | 328,588 |
| Events in quadrant B | 2,152,997 | 331,889 |
| Events in quadrant C | 1,928,462 | 332,743 |
| Events in quadrant D | 2,511,612 | 317,945 |
| Mode SS | |||
|---|---|---|---|
| Quadrant | BADHDUFLAG | Total packets | Discarded packets |
| A | 0 | 90 | 0 |
| B | 0 | 90 | 0 |
| C | 0 | 90 | 0 |
| D | 0 | 90 | 0 |
| Mode M9 | |||
|---|---|---|---|
| Quadrant | BADHDUFLAG | Total packets | Discarded packets |
| A | 0 | 8 | 0 |
| B | 0 | 8 | 0 |
| C | 0 | 8 | 0 |
| D | 0 | 9 | 0 |
| Mode M0 | |||
|---|---|---|---|
| Quadrant | BADHDUFLAG | Total packets | Discarded packets |
| A | 0 | 9087 | 1 |
| B | 0 | 9402 | 1 |
| C | 0 | 9042 | 1 |
| D | 0 | 10519 | 1 |
| Quadrant | Total seconds | Saturated seconds | Saturation percentage |
|---|---|---|---|
| A | 4495 | 8 | 0.177976% |
| B | 4495 | 22 | 0.489433% |
| C | 4495 | 6 | 0.133482% |
| D | 4495 | 49 | 1.090100% |
Noise dominated data is calculated using 1-second bins in cleaned event files. If a bin has >2000 counts, and if more than 50% of those come from <1% of pixels, then it is considered to be noise-dominated and hence unusable.
| Quadrant | # 1 sec bins | Bins with >0 counts | Bins with >2000 counts | High rate bins dominated by noise | Noise dominated (total time) | Noise dominated (detector-on time) | Marked lightcurve |
|---|---|---|---|---|---|---|---|
| A | 4495 | 4495 | 0 | 0 | 0.00% | 0.00% | 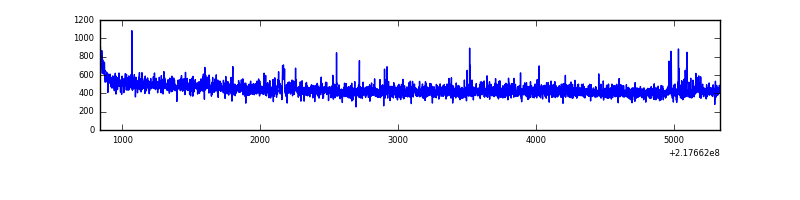 |
| B | 4495 | 4495 | 13 | 13 | 0.29% | 0.29% | 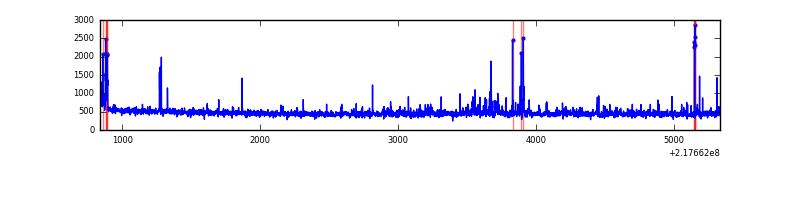 |
| C | 4495 | 4495 | 0 | 0 | 0.00% | 0.00% | 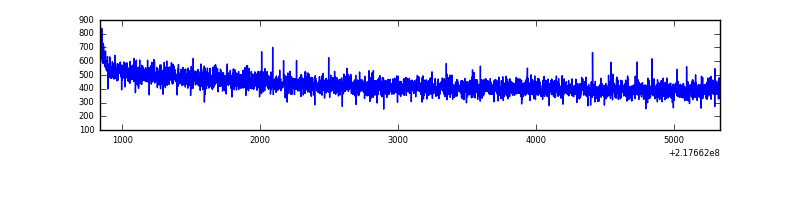 |
| D | 4495 | 4495 | 36 | 36 | 0.80% | 0.80% | 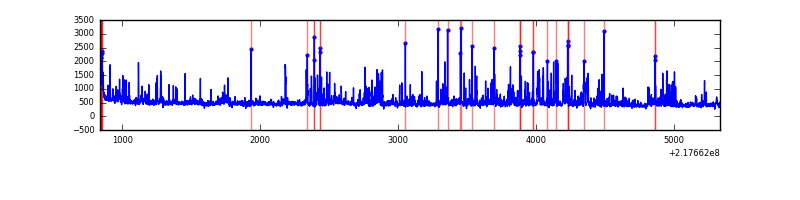 |
Top three noisy pixels from each quadrant. If the there are fewer than three noisy pixels in the level2.evt file, extra rows are filled as -1
| Pixel properties | Quadrant properties | ||||||
|---|---|---|---|---|---|---|---|
| Quadrant | DetID | PixID | Counts | Sigma | Mean | Median | Sigma |
| A | 13 | 210 | 8190 | 74.27 | 507 | 496 | 103.6 |
| A | 15 | 239 | 7427 | 66.9 | 507 | 496 | 103.6 |
| A | 15 | 174 | 7019 | 62.96 | 507 | 496 | 103.6 |
| B | 11 | 51 | 67872 | 692.15 | 509 | 496 | 97.3 |
| B | 3 | 64 | 50173 | 510.33 | 509 | 496 | 97.3 |
| B | 0 | 219 | 34767 | 352.07 | 509 | 496 | 97.3 |
| C | 13 | 61 | 3912 | 29.94 | 493 | 494 | 114.2 |
| C | 8 | 222 | 2451 | 17.14 | 493 | 494 | 114.2 |
| C | 3 | 202 | 1347 | 7.47 | 493 | 494 | 114.2 |
| D | 12 | 220 | 529550 | 4412.44 | 490 | 475 | 119.9 |
| D | 2 | 152 | 43687 | 360.38 | 490 | 475 | 119.9 |
| D | 2 | 63 | 25134 | 205.65 | 490 | 475 | 119.9 |
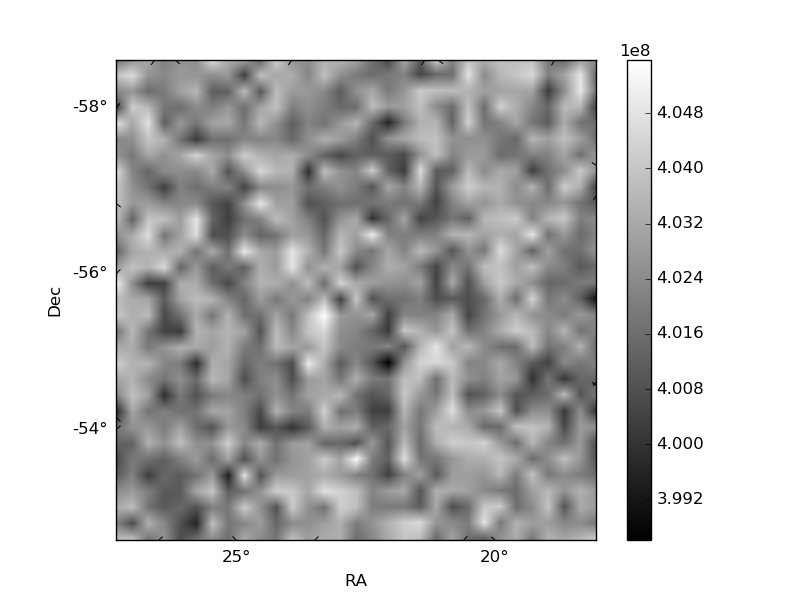
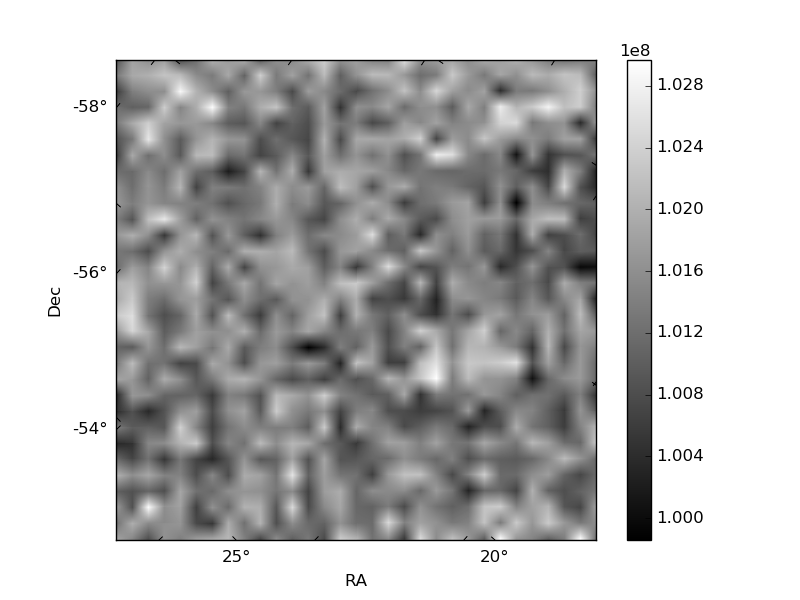
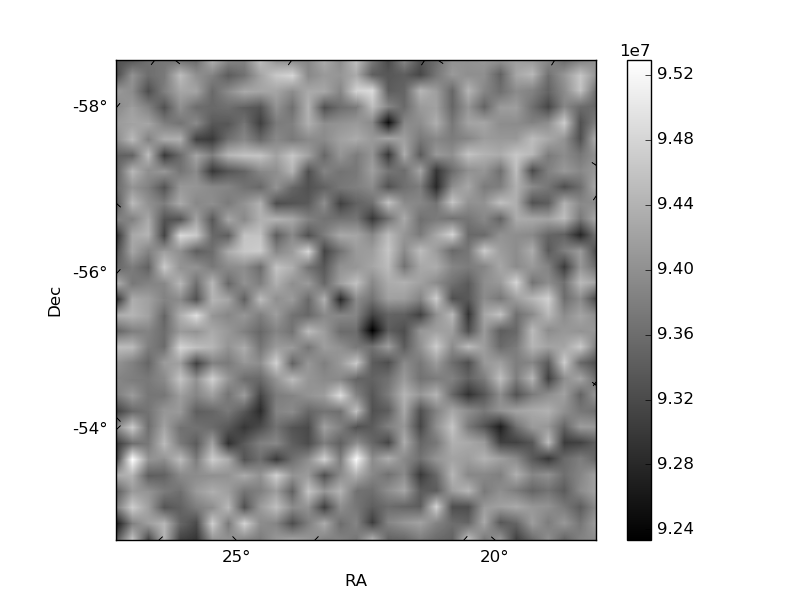
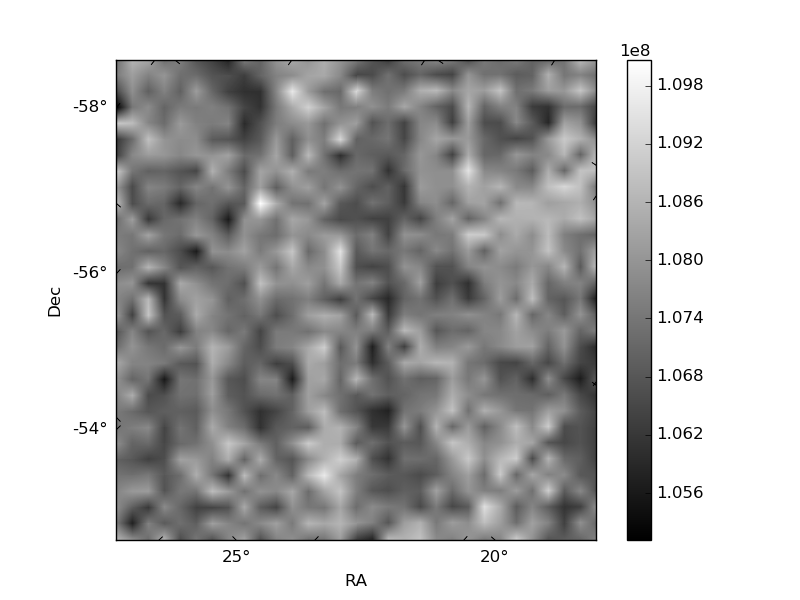
Histogram calculated using DETX and DETY for each event in the final _common_clean file
| Quadrant A | 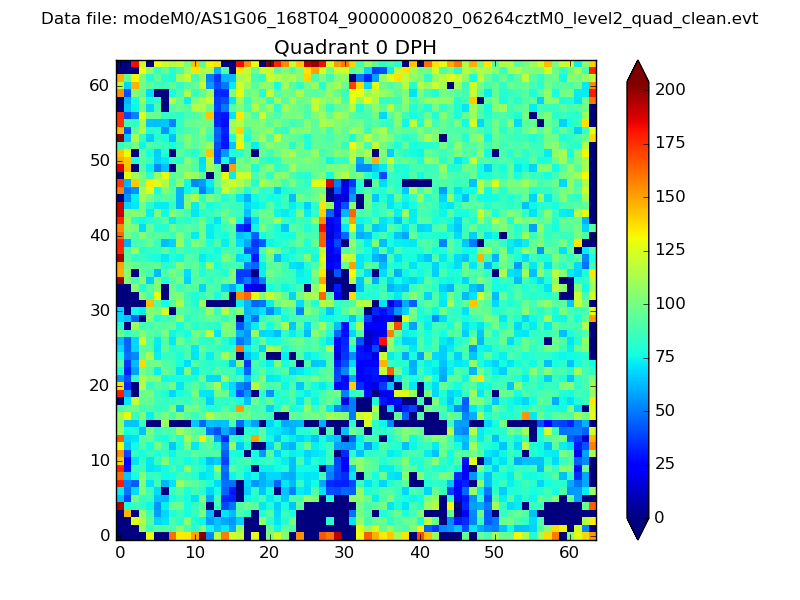 |
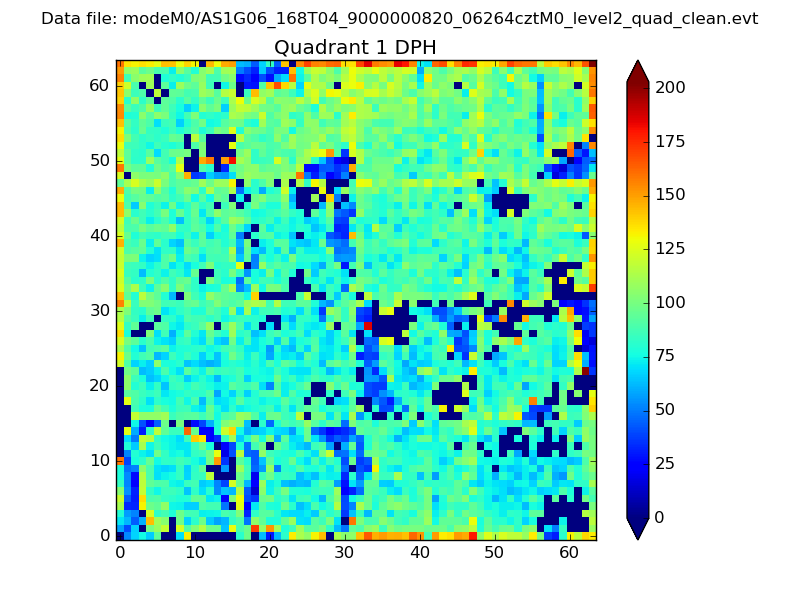 |
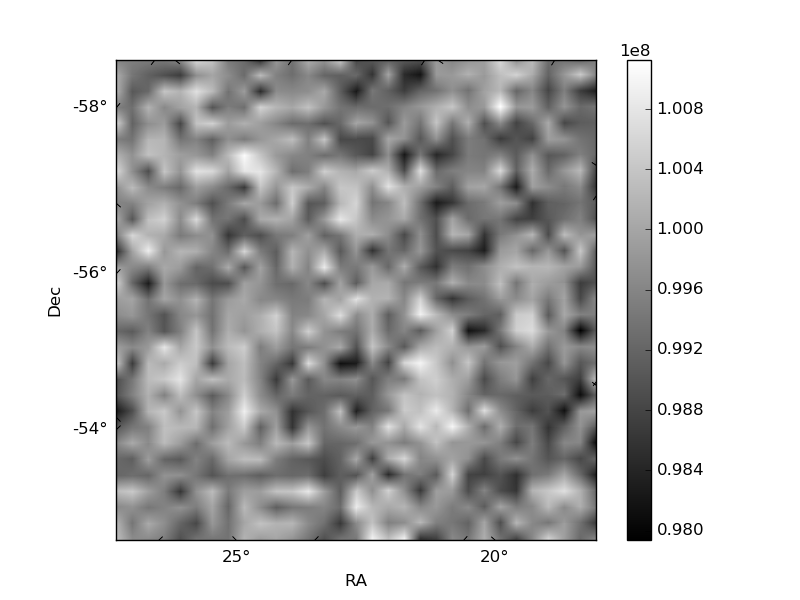
Quadrant B |
|---|---|---|---|
| Quadrant D | 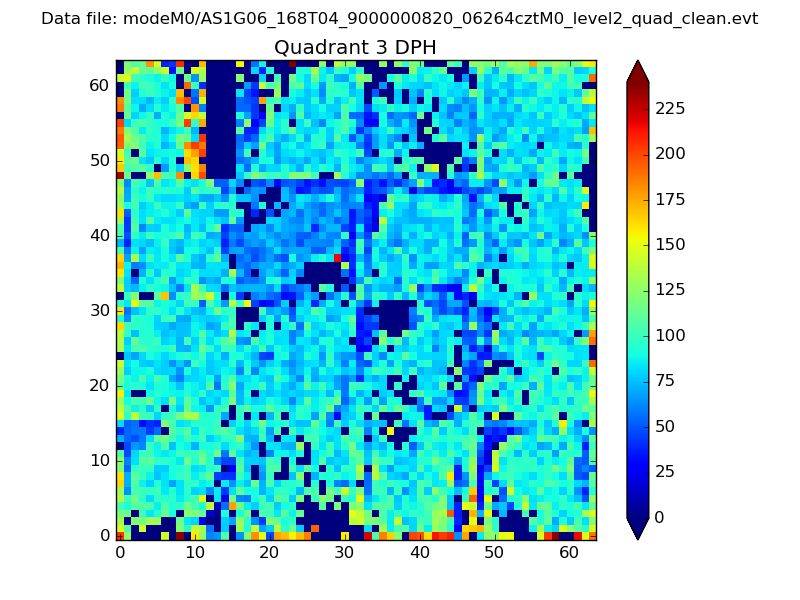 |
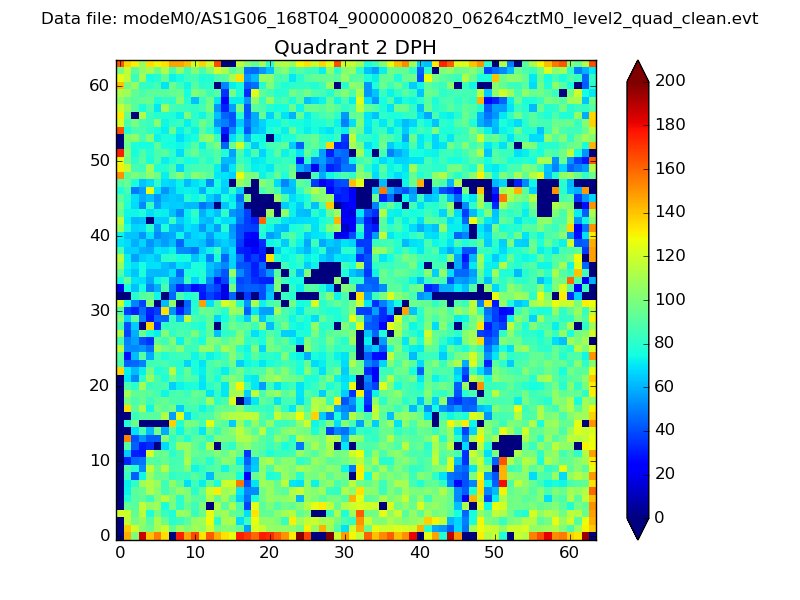 |
Quadrant C |
| Plot type | Count rate plots | Images |
|---|---|---|
| Comparison with Poisson distribution Blue bars denote a histogram of data divided into 1 sec bins. Red curve is a Poisson curve with rate = median count rate of data. |
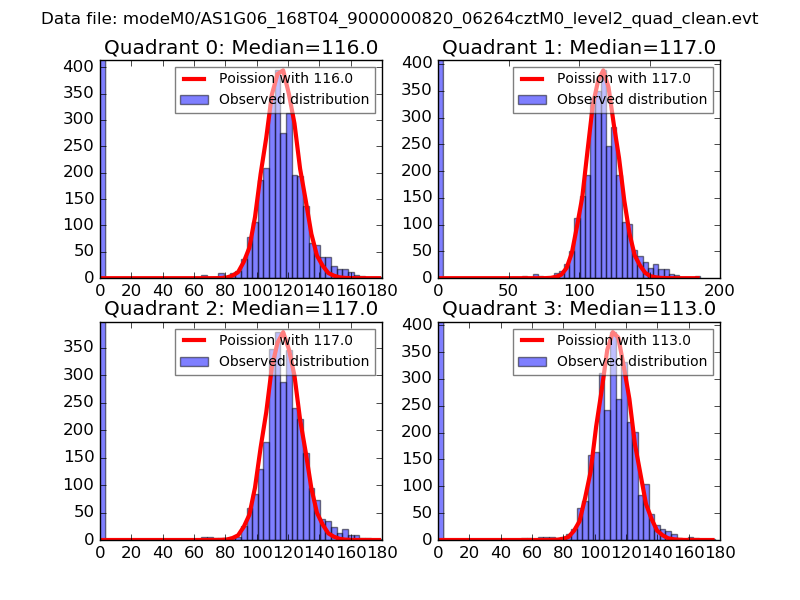 |
 |
| Quadrant-wise count rates Data is divided into 100 sec bins |
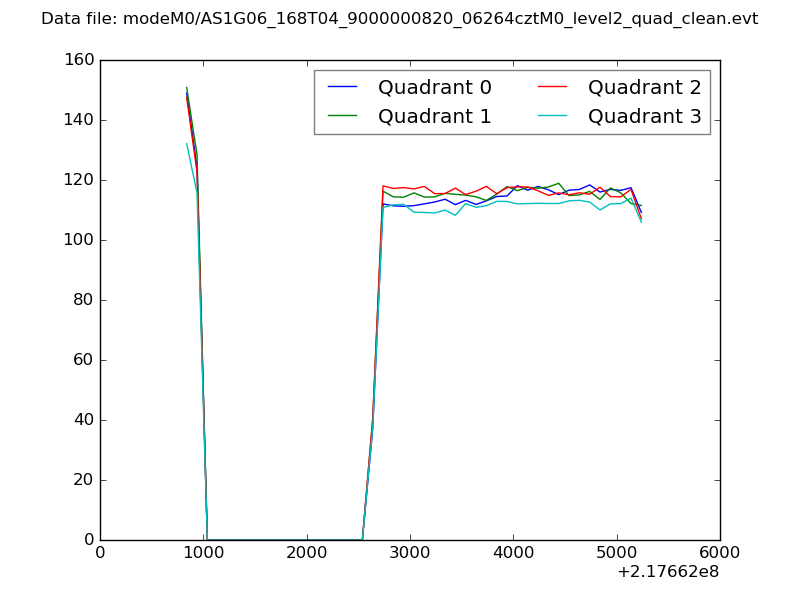 |
|
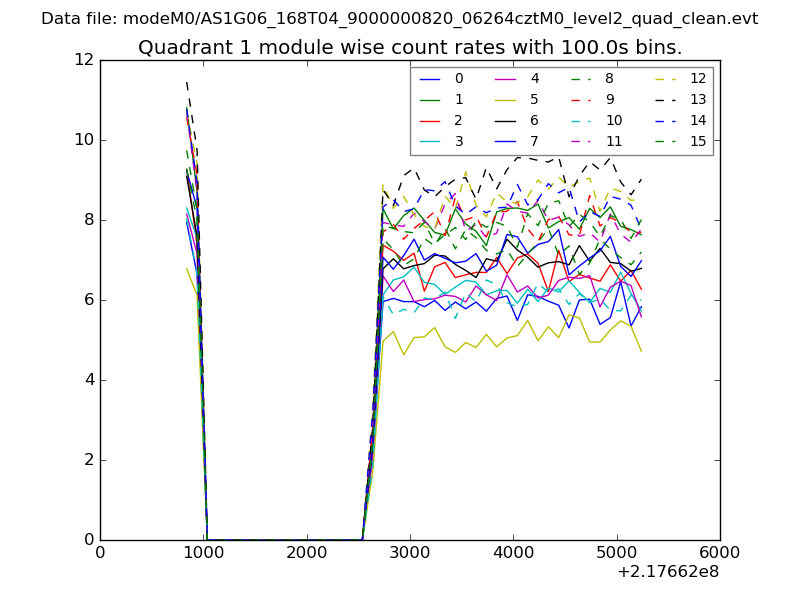
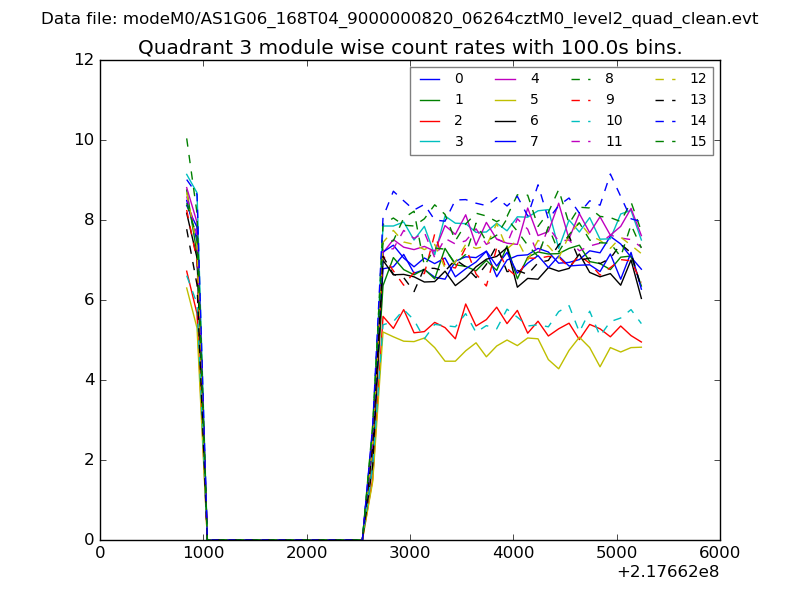
| Module-wise count rates for Quadrant A Data is divided into 100 sec bins |
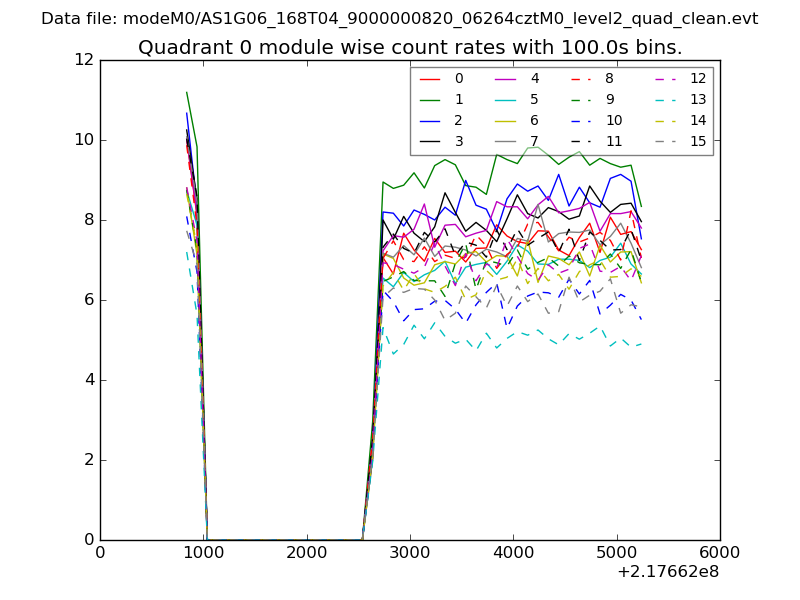 |
 |
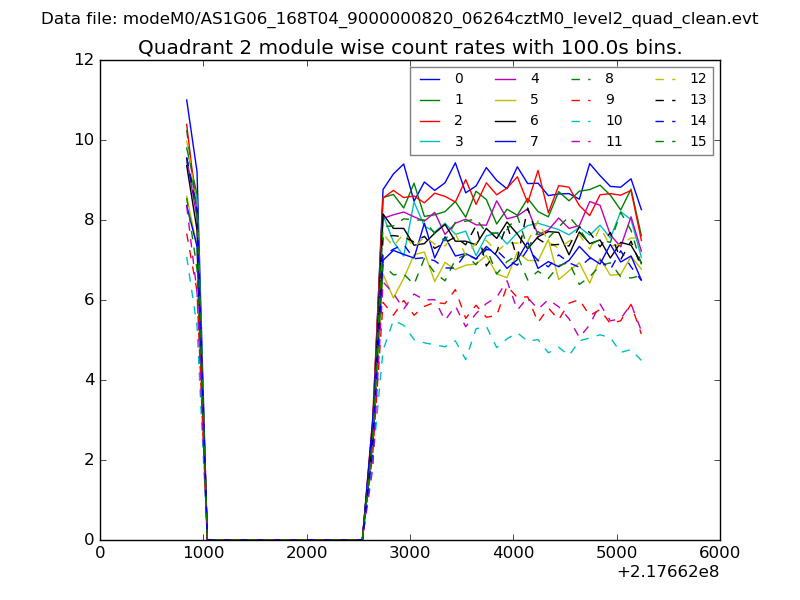
| Module-wise count rates for Quadrant B Data is divided into 100 sec bins |
 |
 |
| Module-wise count rates for Quadrant C Data is divided into 100 sec bins |
 |
 |
| Module-wise count rates for Quadrant D Data is divided into 100 sec bins |
 |
 |
| Parameter | Plot |
|---|---|
| CZT HV Monitor | 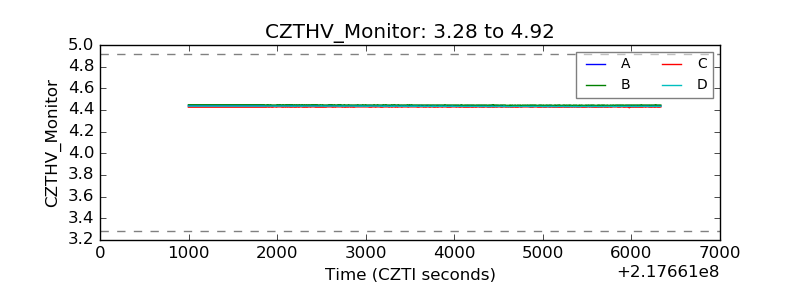 |
| D_VDD | 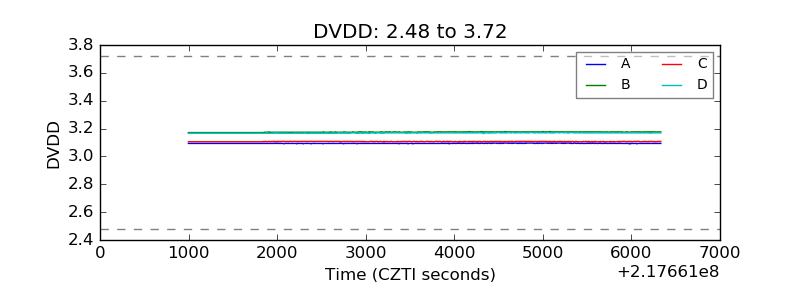 |
| Temperature 1 | 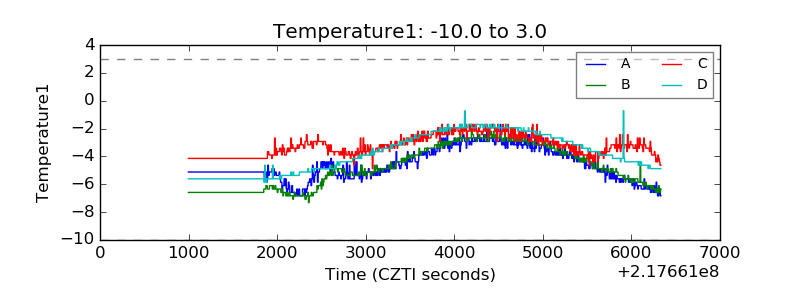 |
| Veto HV Monitor | 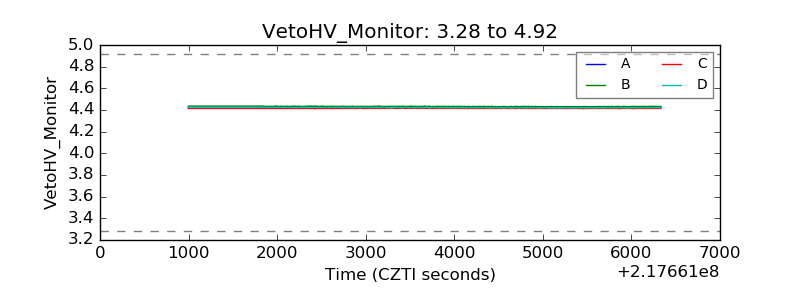 |
| Veto LLD |  |
| Alpha Counter | 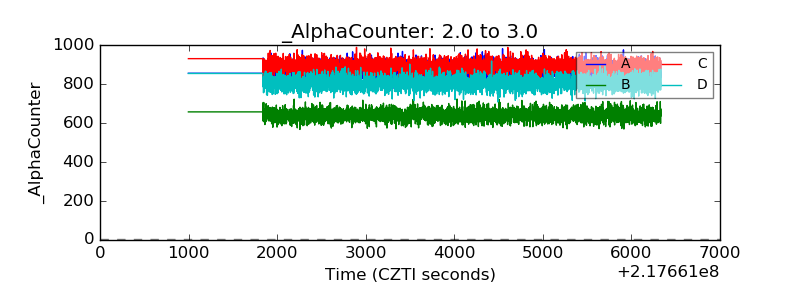 |
| _CPM_Rate | 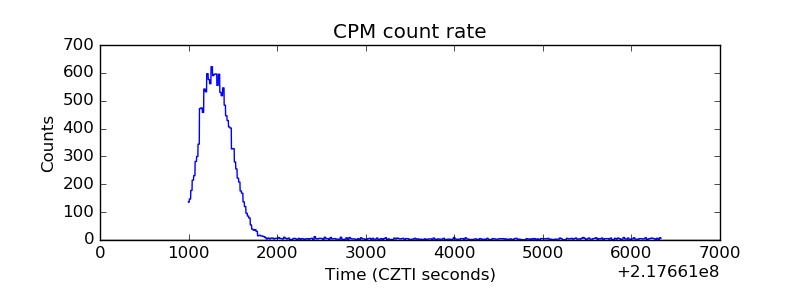 |
| CZT Counter | 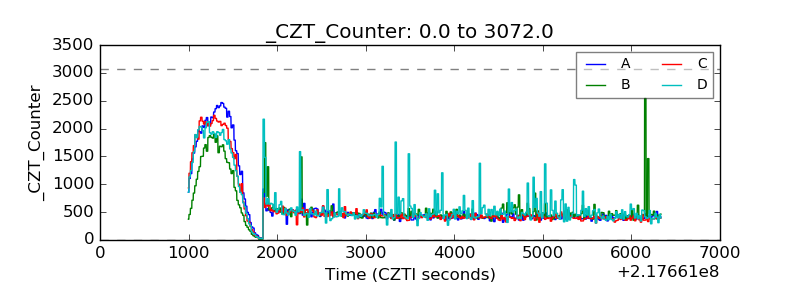 |
| +2.5 Volts monitor |  |
| +5 Volts monitor |  |
| _ROLL_ROT | 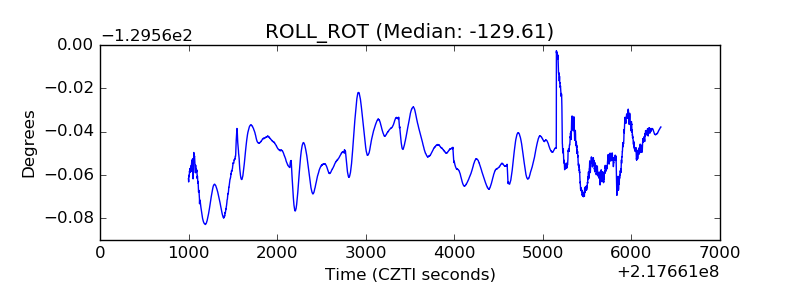 |
| _Roll_DEC | 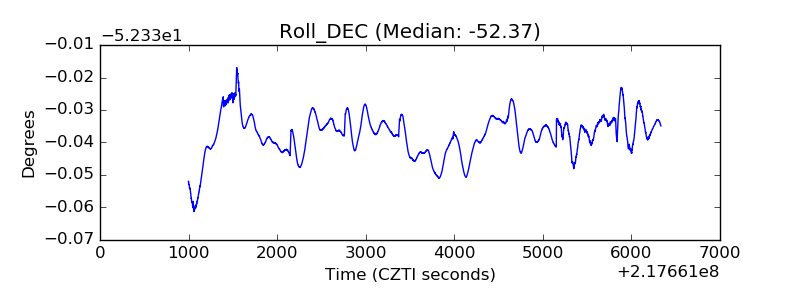 |
| _Roll_RA | 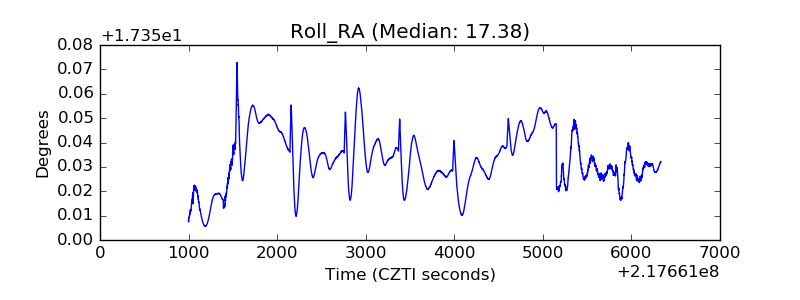 |
| Veto Counter | 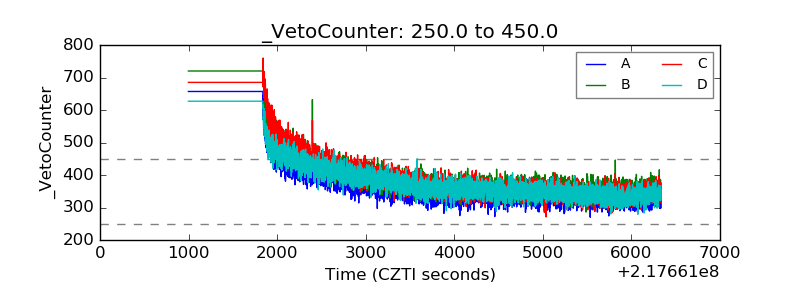 |